
Abstract
Objective:
Hemianopia after occipital stroke is believed to be mainly due to local damage at or near the lesion site. However, magnetic resonance imaging studies suggest functional connectivity network (FCN) reorganization also in distant brain regions. Because it is unclear whether reorganization is adaptive or maladaptive, compensating for, or aggravating vision loss, we characterized FCNs electrophysiologically to explore local and global brain plasticity and correlated FCN reorganization with visual performance.
Methods:
Resting-state electroencephalography (EEG) was recorded in chronic, unilateral stroke patients and healthy age-matched controls (n = 24 each). This study was approved by the local ethics committee. The correlation of oscillating EEG activity was calculated with the imaginary part of coherence between pairs of regions of interest, and FCN graph theory metrics (degree, strength, clustering coefficient) were correlated with stimulus detection and reaction time.
Results:
Stroke brains showed altered FCNs in the alpha- and low beta-band in numerous occipital, temporal brain structures. On a global level, FCN had a less efficient network organization whereas on the local level node networks were reorganized especially in the intact hemisphere. Here, the occipital network was 58% more rigid (with a more “regular” network structure) whereas the temporal network was 32% more efficient (showing greater “small-worldness”), both of which correlated with worse or better visual processing, respectively.
Conclusions:
Occipital stroke is associated with both local and global FCN reorganization, but this can be both adaptive and maladaptive. We propose that the more “regular” FCN structure in the intact visual cortex indicates maladaptive plasticity, where less processing efficacy with reduced signal/noise ratio may cause the perceptual deficits in the intact visual field (VF). In contrast, reorganization in intact temporal brain regions is presumably adaptive, possibly supporting enhanced peripheral movement perception.
Impact statement
The functional connectivity network (FCN) after occipital stroke changes toward a more “regular” pattern. It is maladaptive in the intact occipital region, possibly leading to creating perceptual deficits causing spatiotemporal visual impairments in the “intact” but crowded visual field. The FCN can also be “adaptive,” enabling temporal gyrus structures to compensate for the loss of vision.
Introduction
Hemianopia after unilateral occipital stroke creates problems in everyday visual tasks such as reading, navigating, or driving (Ribeiro et al., 2015). Although the scotoma is believed to be a “local” problem of retinotopic, cortical cell death at or near the lesion site, it also creates global problems caused by remote deafferentation or network disturbances throughout the brain (Catani et al., 2012; Monakow C von, 1914), including cross-hemispheric influences. To learn how the brain as a whole can manage this challenge, we now studied brain functional connectivity network (FCN) dynamics after occipital stroke by quantifying local and global neural network reorganization (Rossini et al., 2019).
Brain plasticity refers to the functional and structural modification of structure or function in response to environmental factors such as brain injury (Bernhardi et al., 2017; Kolb and Whishaw, 1998). Based on prior studies, we expected that brain network plasticity could be both adaptive and maladaptive (Nava and Röder, 2011). Adaptive changes could compensate or improve the function (i.e., restoration of visual function), whereas maladaptive changes would interfere, reduce, or disrupt the functional state (Li et al., 2016 ; Woolf, 1989) depending on the pathophysiological condition (Dalise et al., 2014).
Both are expected to be caused by, or associated with, structural or functional modifications of brain networks (Naro et al., 2016; Pascual-Leone et al., 2005). Examples of adaptive and maladaptive neuroplasticity were reported in various studies of pain (Li et al., 2016 ), stroke (Altman et al., 2019), focal dystonia (Quartarone et al., 2006), or tremor (Lee et al., 2014), to name but a few.
Brain FCN reorganization is well established as demonstrated by magnetic resonance imaging (MRI) techniques in different neural disorders such as early blindness (Striem-Amit et al., 2015), glaucoma (Wang et al., 2016), stroke (Wang et al., 2010b), Alzheimer disease (Dennis and Thompson, 2014), schizophrenia and depression (Wu et al., 2017), traumatic brain injury (Sharp et al., 2014), or after occipital damage (Pedersini et al., 2020). However, the functional role of FCN reorganization in hemianopia is rather unclear.
On one hand, some FCN changes might be “maladaptive,” because hemianopia patients have slowed reaction times (RTs) and perceptual deficits in their intact hemifield (Bola et al., 2013; Cavézian et al., 2015; Chokron et al., 2008). On the other hand, other instances of FCN reorganization might be “adaptive” as shown in patients with optic nerve damage, where neuromodulation-induced FCN reorganization can strengthen occipital–frontal interactions that correlate with visual field (VF) improvements (Bola et al., 2014).
We now wished to characterize plasticity and network reorganization in occipital stroke patients with vision loss by using the electroencephalography (EEG) to analyze local and global FCN dynamics, including those that are independent of energy consumption (Rossini et al., 2019). Specifically, we hypothesized that FCNs graph metrics significantly differ between healthy controls and patients with stroke, and that FCN plasticity can be either adaptive or maladaptive as revealed by correlating FCN changes with visual performance in our stroke patients.
Methods
Experimental setting
We recruited hemianopic patients with occipital ischemic stroke (n = 24; age: 58.4 ± 10.9 years, mean ± standard deviation [SD], lesion age >6 months, 21 male/3 female) and age-matched healthy controls (n = 24, age: 57.4 ± 10.5 years, 18 male/6 female), as shown in Supplementary Table S1. Of note, some patients had middle cerebral artery territory and brainstem strokes, a possible source of heterogeneity and FCN variability. Inclusion criteria: patients with a lesion age ≥6 months and stable VF defect after middle or posterior artery stroke, ensuring that the spontaneous recovery has been completed; the age of patients was in the range of 18–75 years old.
Exclusion criteria: complete blindness, any serious ophthalmological disorders with a high probability of ongoing vision loss, diabetic retinopathy or diabetes mellitus, retinitis pigmentosa, pathological nystagmus, pregnancy, any operation targeting the heart, head, or vascular system during the past 3 months. For more details, see (Gall et al., 2015; Li, 2016 ).
A high-resolution computer-based campimetric test (HRP) was used to evaluate the binocular VFs (Kasten et al., 1998). In a dark room, the patients were asked to sit in front of a 17-in. monitor and press the button on the keyboard if there was a target stimulus or whenever and isoluminant change of the fixation point occurred. An eye-tracker was used to simultaneously control and monitor eye movements. Stimulus detection and RT were measured per stimulation position. All patients were tested three times, which was then averaged, and the VF areas were labeled as intact (shown in white), partially damaged regions (shown in gray color), or absolutely impaired areas (black) (Li, 2016 ).
This study complies with the ethical standards of the Declaration of Helsinki (1964) and was approved as a clinical trial by the local ethics committee of the University of Magdeburg (IRB), Medical Faculty, Magdeburg/Germany (no. 173/13) and national regulatory bodies (
EEG acquisition, preprocessing, and analysis
High-density EEG was recorded by using a HydroCell GSN 128-channel net and a Net Amps 300 amplifier (EGI, Inc., Eugene, OR) (sample frequency: 500 Hz; impedance <50 kΩ). Five minutes long resting-state EEG per subject was recorded under eye-closed and “no-task” condition. A digital 1–145 Hz band-pass filter and a 50 Hz notch filter were applied. Data were down-sampled to 250 Hz and referenced with the common average reference method.
Bad channels of controls (4.08 ± 1.31, mean ± SD) and patients (4.67 ± 1.43) were removed after visual inspection, and six neighboring electrodes were averaged to represent the removed channels. Five minutes long EEG recordings were segmented into 2 sec. epochs overlapping 0.5 sec, with comparable clean trials count for controls (123.6 ± 20.1) and patients (120.1 ± 21.2). Components of eye-blinks or cardiac activity of controls (3.7 ± 1.4) and patients (5.9 ± 3.1) were removed by independent component analysis; the signal was then decomposed to Delta (1–3 Hz), Theta (4–7 Hz), Alpha1 (8–10 Hz), Alpha2 (11–13 Hz), Beta1 (13–21 Hz), Beta2 (22–30 Hz), and the total alpha (8–13 Hz) frequency bands. The analysis pipeline is displayed in Supplementary Figure S1A.
Fourier analysis with multitapers and discrete prolate spheroidal sequences taper was used to reduce spectral leakage and achieve frequency smoothing. In our frequency analysis, sensor-level Fourier spectra were computed to obtain cross-spectral density per frequency bin and all trials were kept. To locate the origin of neural activity, we used the standard boundary element method (BEM) volume conduction model of the head (Oostenveld et al., 2003) and a standard 3D volumetric source model in 8 mm resolution with Montreal Neurological Institute (MNI) coordinates for EEG forward and inverse computations. Generally, the forward model was calculated by using the symmetric BEM (Fuchs et al., 2001).
In contrast, the inverse model was calculated with a beamforming method by using the partial canonical correlation method (Rao, 1969), which implemented the method of dynamical imaging of the coherent sources algorithm for computing the spatial filters for each dipole location in the volumetric source model (Gross et al., 2001). This was subsequently used for connectivity analysis. Finally, the original neural activities were resourced within dipoles from 1 to 30 Hz according to frequency bands, and the frequency bins were summed and weight averaged into six frequency bands for statistical analysis. We applied the volumetric automatic anatomical labeling (AAL) for the volume of interest atlas (Tzourio-Mazoyer et al., 2002), which is constructed based on a single-subject, high-resolution T1-MRI (Collins et al., 1998), and defines 120 structures, of which we analyzed 90.
We first compared FCN in the left and right hemispheres of age-matched controls (CH) and, after averaging them, with lesioned (LH) and intact hemispheres (IH) of patients by using the small-worldness network as a parameter of global network states.
Estimating functional connectivity
The FCNs are defined by statistical synchronization of resting-state EEG patterns, which allows the quantification of interaction between different pairs of brain regions (Pereda et al., 2005) with the imaginary part of coherence (Nolte, 2003), a method insensitive to false connectivities arising from volume conduction. Our connecitvity matrices represent 128*128 (channel*channel) or 90*90 (region of interest [ROI]*ROIs) for all pairs at electrode (sensor) and source level, respectively. We adopted a parcellation scheme with the AAL atlas and averaged the connectivity values between sets of dipole pairs that belong to a given pair of parcels.
Based on the parcelled connectivity matrix (90 × 90), network measures were obtained. Coherence was segmented into short-range (local) and long-range (global) interactions, with the short-range coherence referring to within-lobe network measures (degree, strength, and centrality) after the graph theory network analysis; long-range coherence was calculated from left occipital (LO) and right occipital (RO) to the frontal, temporal, and parietal lobes of both hemisphere, that is, between (RO) and (RF, RT, right parietal [RP], left frontal [LF], LT, LP, LO) or between (LO) and (RF, RT, RP, RO, LF, LT, LP), that is, the brain was divided into eight main regions and six frequency bands (Delta, Theta, Alpha1, Alpha2, Beta, Alpha). Each region has an average coherence coefficient of the internal sub-regions for the connection of the other seven regions (6*7 matrix).
In this manner, we were able to document the brain functional connectivity enhancement or weakening between regions on the whole-brain level.
Graph theory
In our study, nodes represent brain regions and edges represent the synchronization between two regions at the anatomical level as defined by the AAL atlas (Rubinov and Sporns, 2010). We calculated the global efficiency, global clustering coefficient, and global characteristic path length (GCPL) per density to evaluate the stabilization and robustness of network patterns in the alpha band. In this case, we could retain the non-arbitrary and stabilized network pattern and also removed the weak and noisy connectivities (Fig. 1A, D).
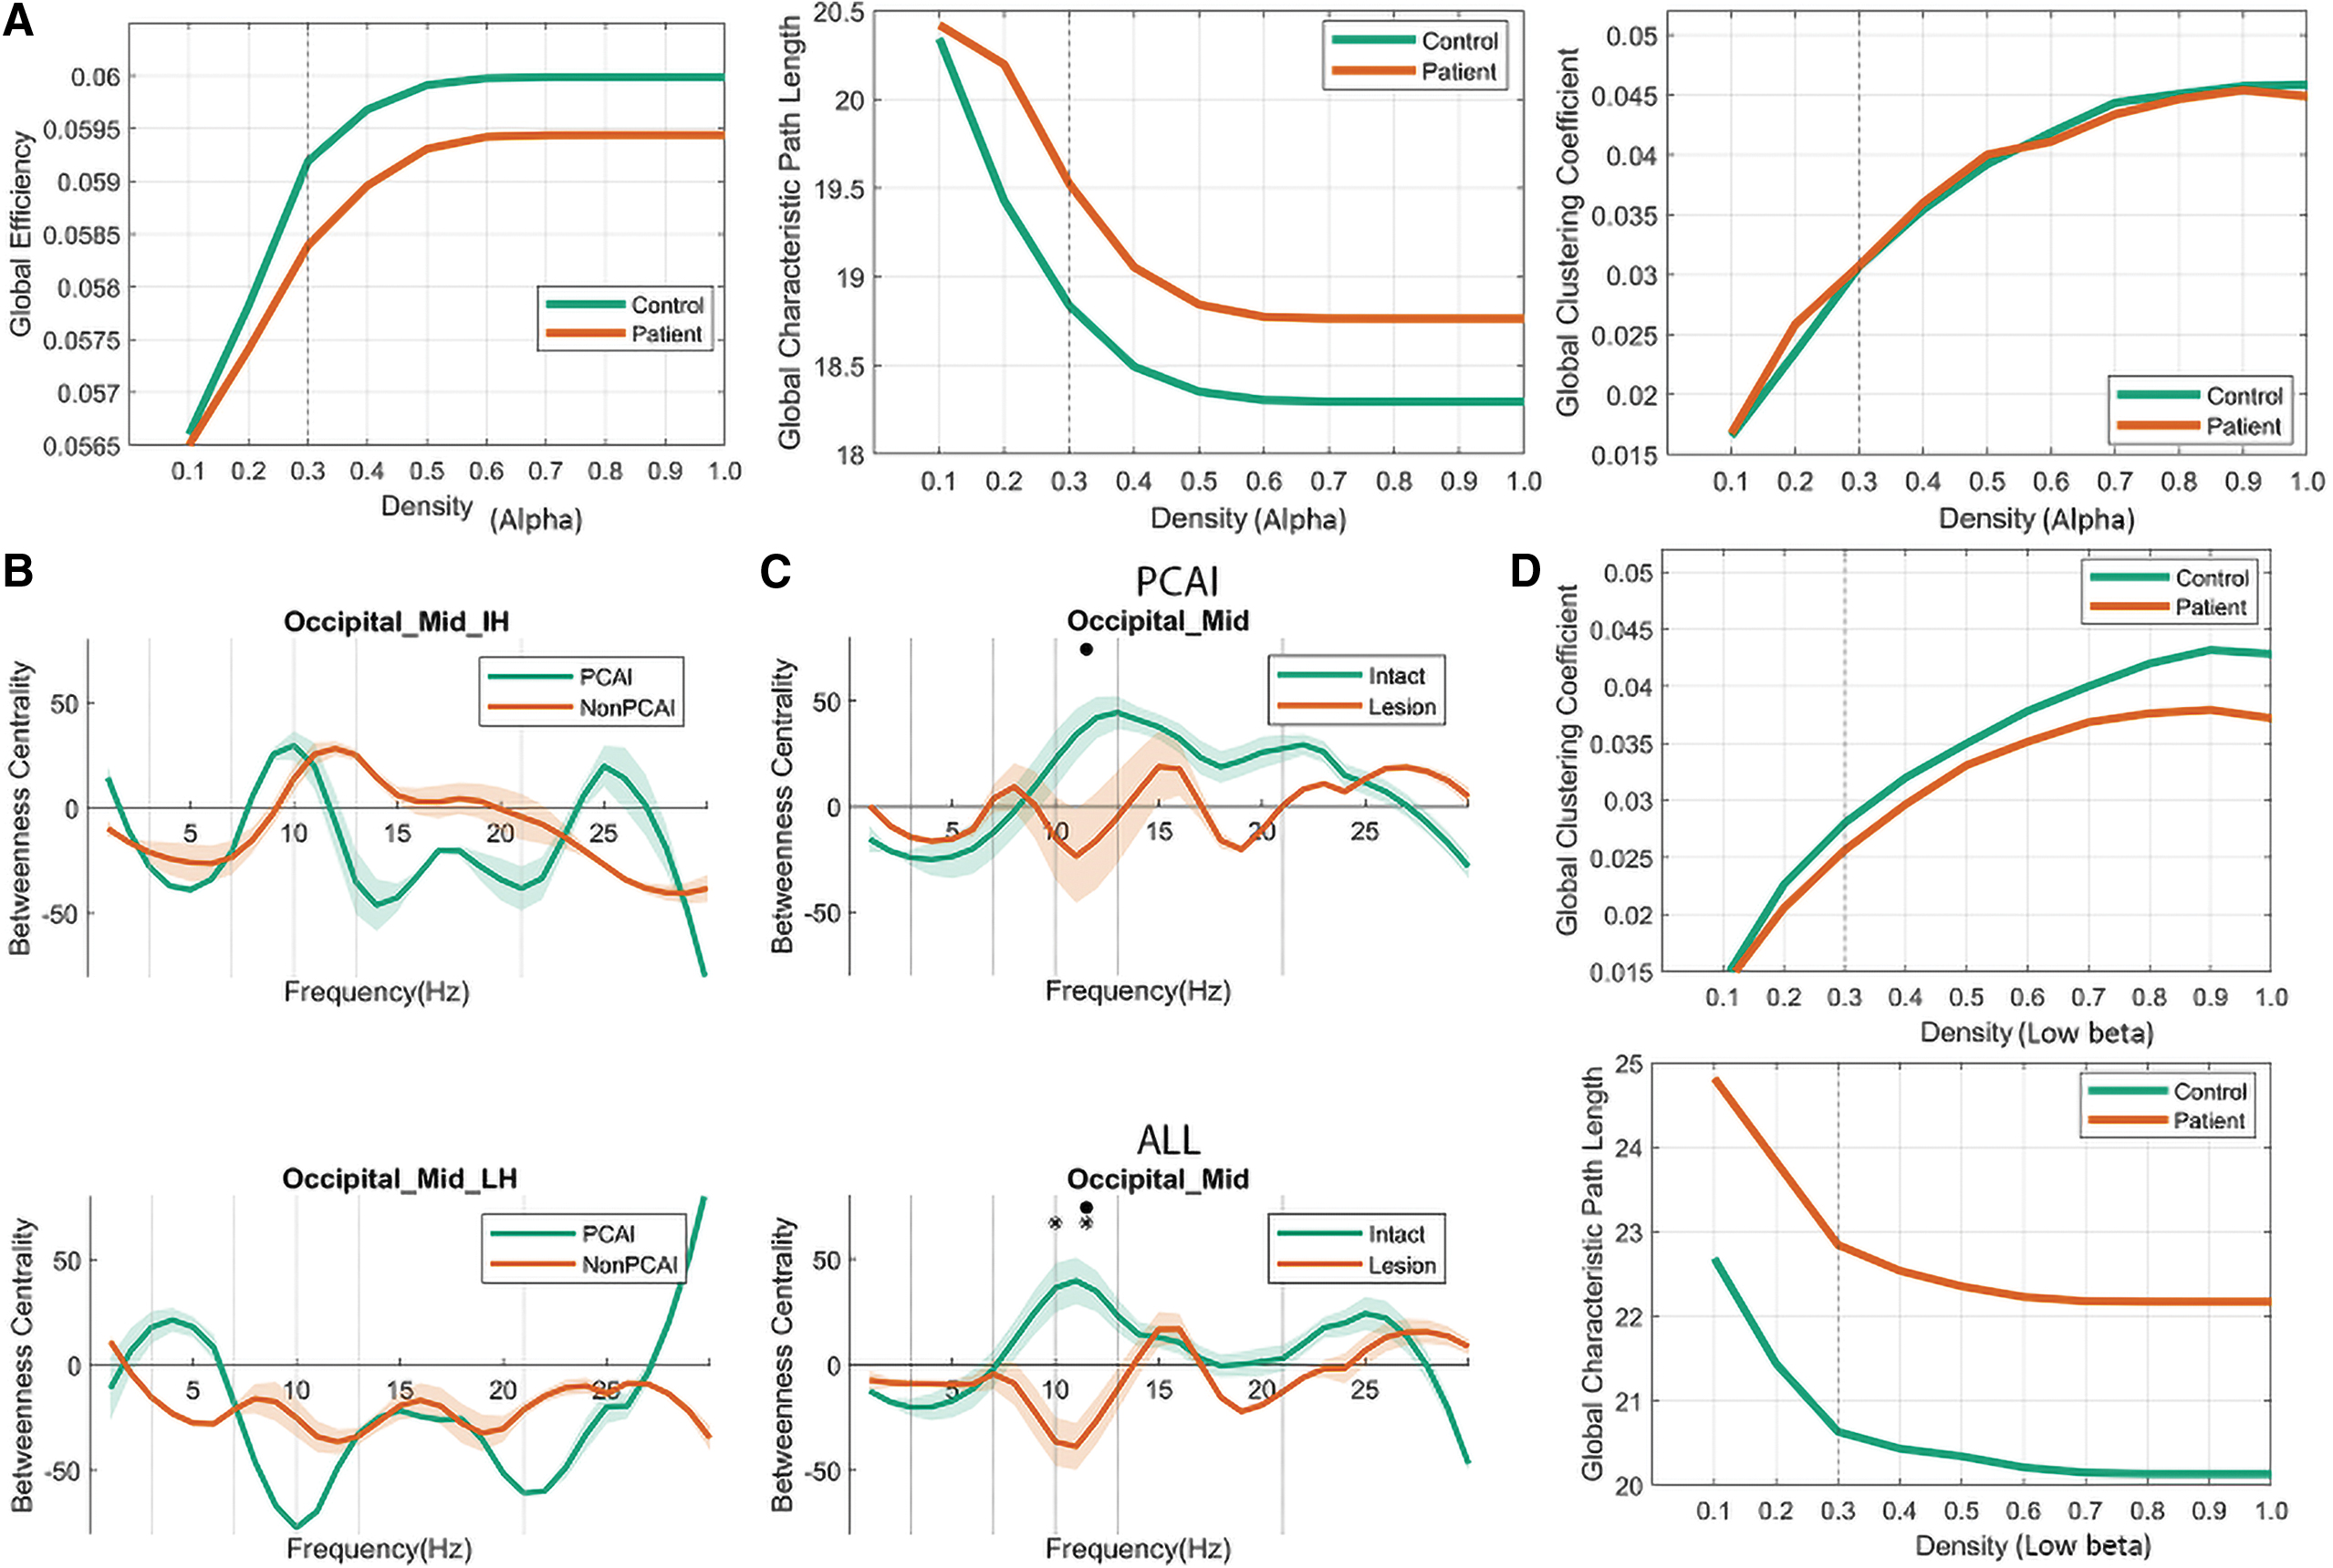
Briefly, the density of a connectivity matrix was limited to those with a threshold of 0.3; only 30% of the strongest weight edges were considered to ascertain that the densities (proportion of existing edges out of all possible edges) were equal for each graph and subject (Bola and Sabel, 2015). Generally, fixing the probability for the existence of an edge excludes criteria of Erdős-Rényi random networks for group analysis (Van Wijk et al., 2010).
We then calculated the following graph measures: node strength, node degree, node betweenness centrality, and node clustering coefficient (CC); degree and strength represent the sum of links and their weight in a node; centrality demonstrates how many shortest path lengths pass a node; and the CC describes the network around the node. In addition, we assessed the GCPL and CC to identify long-range functional connectivities between ROIs.
Data analysis and statistics
The EEG was preprocessed and resourced in Fieldtrip (Oostenveld et al., 2011) with Matlab 2017a (MATLAB, 2017) to visualize long connectivity by BrainNetViewer (Xia et al., 2013). First, the Mann–Whitney U-test was used to compare the FCN measures between the posterior cerebral artery infarct (PCAI) group and non-PCAI group to exclude the effects with non-PCAI individual lesions. We then compared control subjects with the lesioned and non-lesioned (intact) hemisphere of stroke patients (Alpha frequency*per node).
In controls, the FCN metrics were averaged for both hemispheres and compared with the IH and the LH of patients; significant differences between them were then calculated with the one-way Kruskal–Wallis test for three independent samples, and the p-value was corrected with the family-wise error rate adjusted by BHFDR (Benjamini and Hochberg, 1995) to consider the multiple comparison problem, in the post hoc pairwise comparison with the Mann–Whitney U-test (p < 0.05). Pearson correlations were calculated between FCN metrics and visual performance (detection ability, RT), as measured by high-resolution perimetry (HRP) in normal (shown in white in Supplementary Fig. S1B), impaired (gray), or blind (black) VF regions; p-value was corrected by BHFDR.
Data availability statement
Data were not published with GDPR protection in EU. However, anonymized data are available to appropriately qualified investigators on request.
Results
General
The graph theory features used to describe FCN organization are betweenness centrality, CC, and characteristic path lengths (CPLs) (Fig. 2A, B). The mean connectivity matrix of control subjects and stroke patients (Fig. 2C) shows the dominant functional connections between ROIs. Normal subjects had a more clearly defined FCN with a few regions interconnecting, whereas in patients the FCN pattern was more diffuse, with many different functional connections. Because there was no major left/right hemispheric difference in local FCN metrics in controls, both were pooled. Because non-PCAI (n = 8) and PCAI patients (n = 16) were comparable in the alpha band (Fig. 2B), both were also pooled (Supplement).

FCN graph metrics in intact and lesion hemispheres
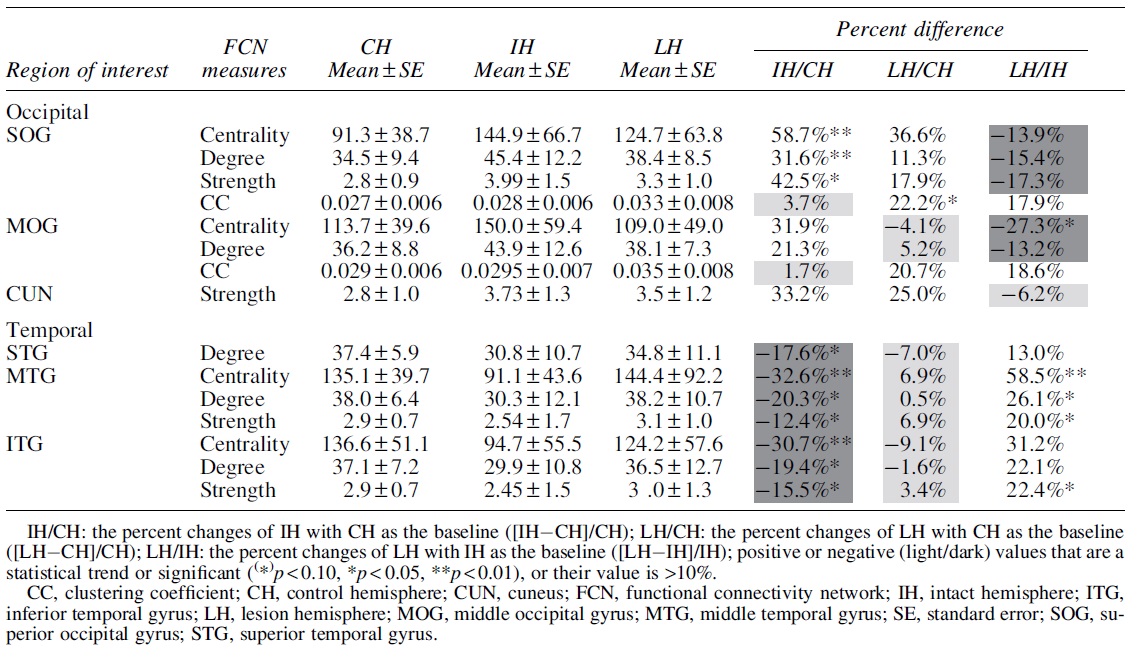
Table 1 summarizes graph analysis results for regions with the most important differences in the alpha band, namely the FCN metrics in the occipital and temporal brain regions, with no significant differences in the frontal regions. Before calculating the significant difference of an individual group comparison, we carried out the Kruskal–Wallis test for the group difference of FCN graph measures, with p-value corrected by the Bonferroni (frequency per node). The Mann–Whitney U-test was performed for the post hoc analysis; p-value was also corrected by the Bonferroni method.
The Functional Connectivity Network Measures' Change (Mean ± Standard Error) in Occipital, Temporal, and Parietal Lobes of Control, Intact, and Lesion Hemispheres
To evaluate the robustness of the result in a more conservative manner, the BHFDR method was also performed to correct the p-value after the Kruskal–Wallis test (nodes per frequency). In this case only, the network centrality patterns for the brain network changes reached significance. However, we believe that the BHFDR correction on node number is too conservative for an exploratory study, where, in fact, the pattern of significant changes among different measures was rather consistent.
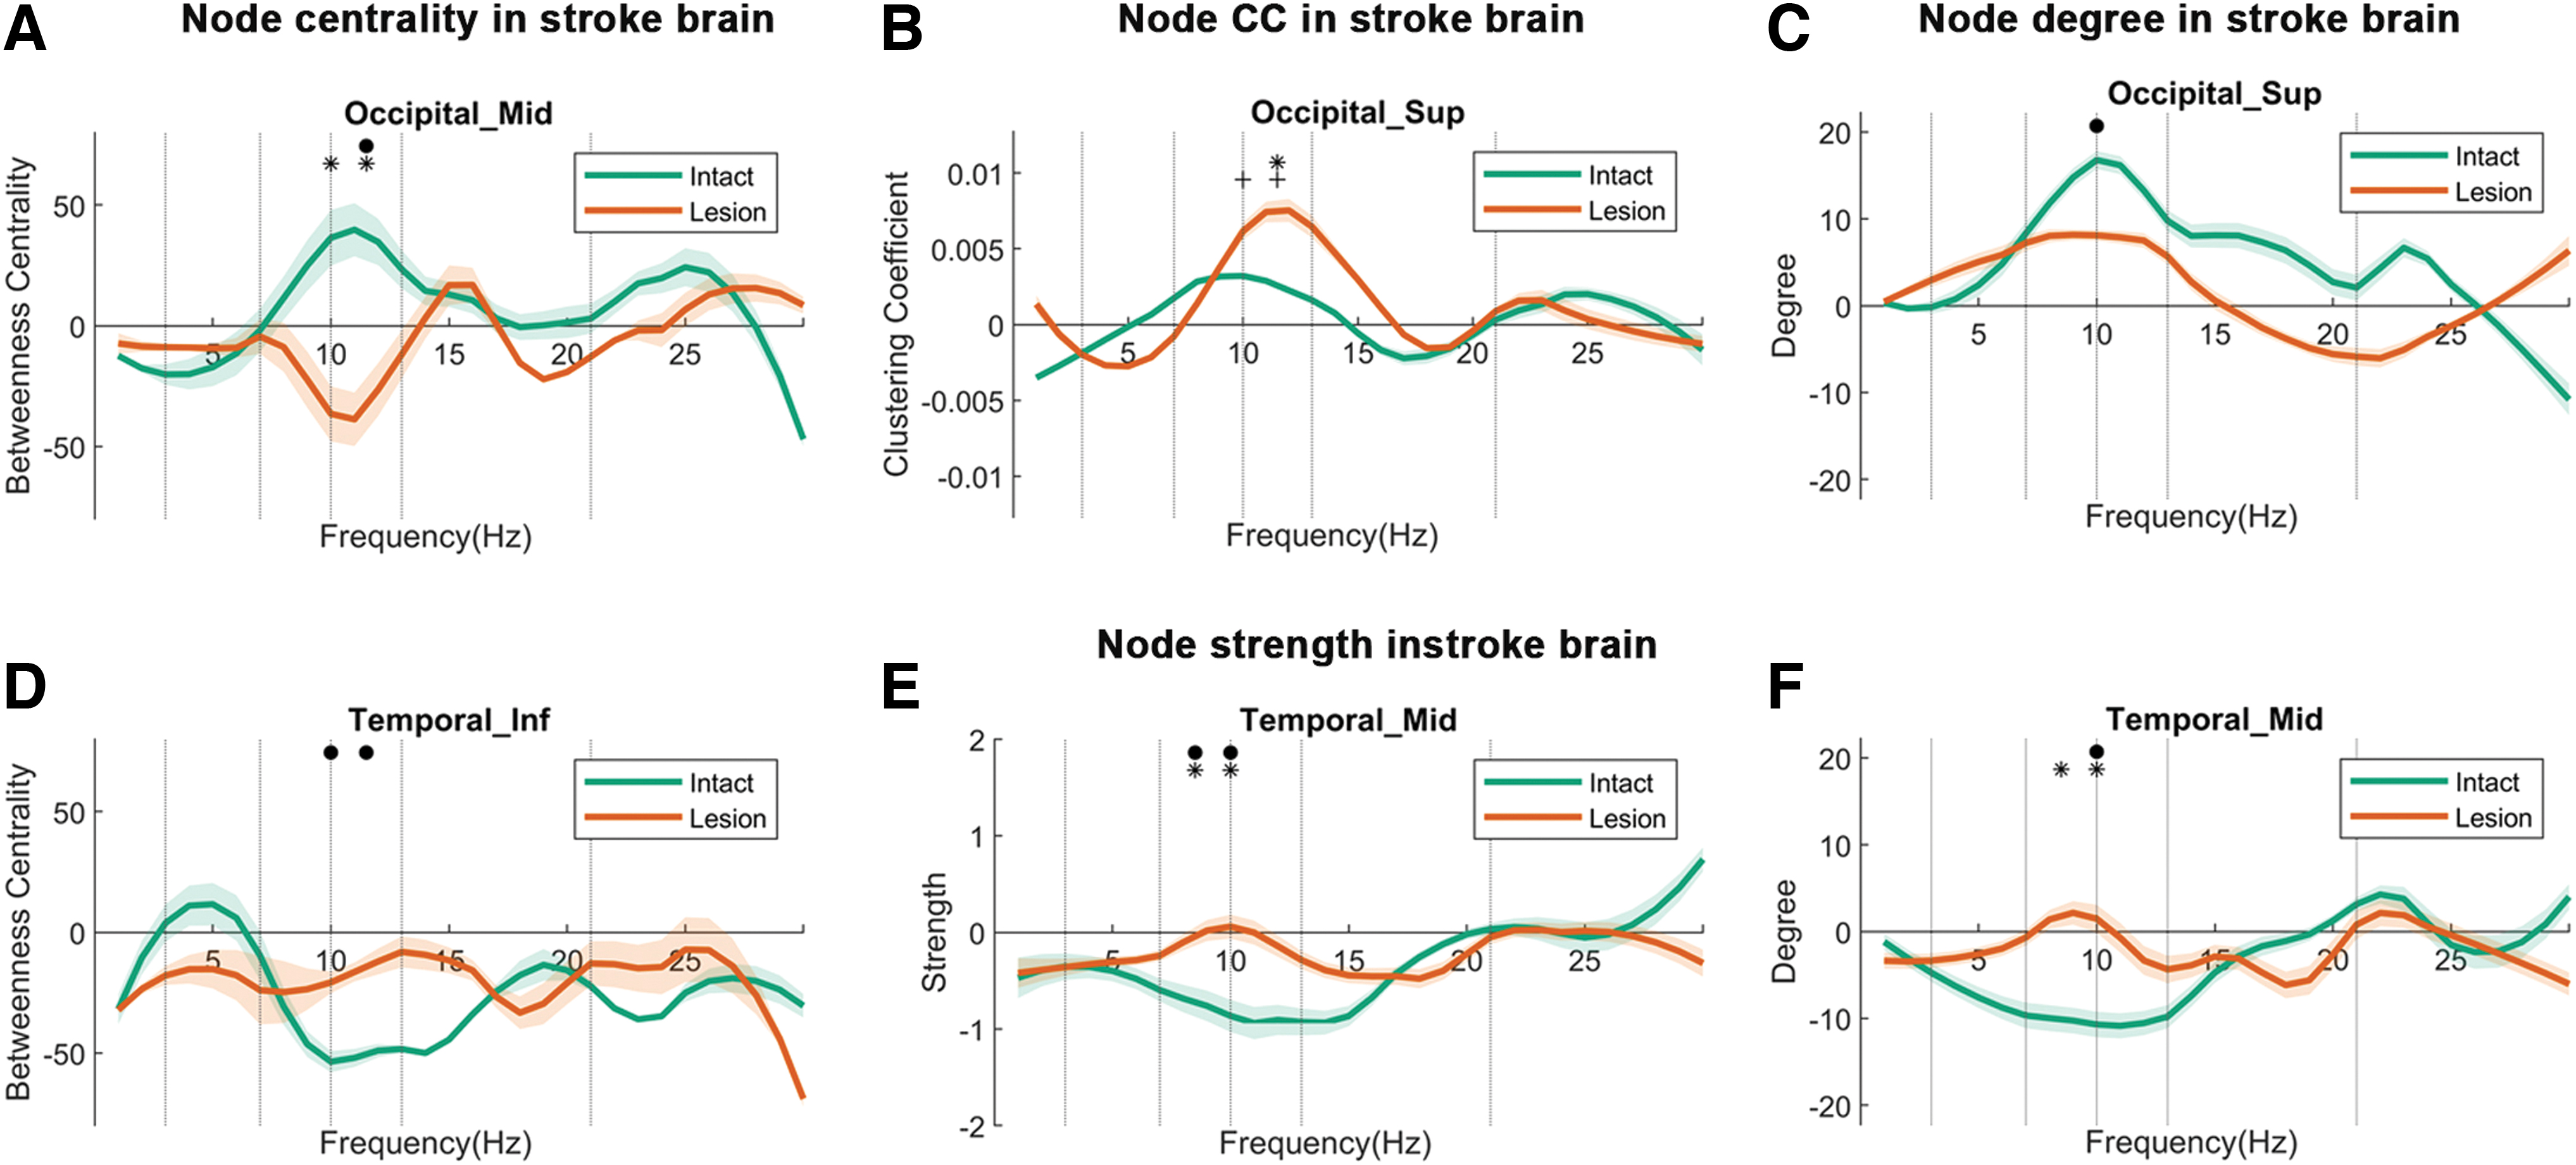
Network centrality
The parameter “centrality” (also called “betweenness centrality”) is the most relevant and sensitive graph metric in all ROIs compared with other graph measures. By comparing EEGs between patients and controls, we studied how nodes react to the occipital stroke and how they communicate with other nodes' “centrality” (Fig. 3A, D). All three groups (CH vs. LH vs. IH) (CH, IH, LH) significantly differed from each other, namely in occipital lobe structures such as superior occipital gyrus (Occipital_Sup) (F (2, 69) = 9.13, p = 0.031), and middle occipital gyrus (Occipital_Mid) (F (2, 69) = 8.33, p = 0.045).
Node centrality
Post hoc analysis shows that the centrality in the IH of Occipital_Sup was significantly higher than in the CH (p < 0.01) by 58.7%, and the IH centrality of the Occipital_Mid was 27.3% higher than the LH (p < 0.05). Thus, the visual cortex of the IH had higher centrality than the LH. Group differences were also found for the middle temporal (MT) (Temporal_Mid) (F (2, 69) = 10.52, p = 0.015) and inferior temporal gyrus (ITG) (Temporal_Inf) (F (2, 69) = 9.13, p = 0.03). Post hoc analysis showed that the centrality of Temporal_Mid (p < 0.005) and Temporal_Inf (p < 0.05) of the IH was significantly lower than the CH (−32.6% and −30.7%, respectively).
Clustering coefficient
The CC describes the network clustering capacity of the local nodes. When it is high, the node is considered to be less flexible (stable), having a “regular” FCN structure. Group differences were observed in the regions Occipital_Sup (F (2, 69) = 8.47, p = 0.044). Post hoc analysis indicates that LH CCs in Occipital_Sup (p < 0.05) was higher than in controls by +22.2% (Fig. 3B). This is a sign that the network at or near the lesion site has more stability ( = less flexibility), that is, a more “regular” FCN structure, with less global interactions due to structural and/or functional disconnection.
Network degree and strength
Degree
The number of local node connections (degree) showed significant overall group differences in Temporal_Mid (F (2, 69) = 10.13, p = 0.018), superior temporal gyrus (Temporal_Sup) (F (2, 69) = 8.22, p = 0.048) and Temporal_Inf (F (2, 69) = 10.20, p = 0.018), and in Occipital_Sup (F (2, 69) = 12.44, p = 0.006). The number of local node connections (degree) showed significant differences in post hoc analysis (Fig. 3C, F): IH degree was significantly lower in controls in Temporal_Mid (p < 0.05) by −20.3%, in Temporal_Sup (p < 0.01) by −17.6%, and in Temporal_Inf (p = 0.005) by −19.4%. Further, the degree in Temporal_Mid of IH was 26.1% lower than LH (p < 0.05) above controls. The degree of the intact temporal ITG was lower, which matches the centrality results cited earlier.
Strength
The overall group differences were significant in Temporal_Mid [F (2, 69) = 9.46, p = 0.028] and Temporal_Inf [F (2, 69) = 9.13, p = 0.031] (Fig. 3E). Post hoc analysis showed that local network strength was lower in the IH of patients than controls in Temporal_Inf (p < 0.05) by −15.5%, but it was higher in LH Temporal_Mid (p < 0.05) and Temporal_Inf (p < 0.05) by 20.0% and 22.2%. In contrast, intact temporal regions had reduced degree and strength. Thus, local node strength and degree were enhanced in the occipital lobe of IH above control levels (intact > lesion > control) whereas a significant reduction was noted in the temporal lobe (control > lesion > intact).
In the LH, FCN reorganization was less pronounced occipitally and unaffected in temporal structures. The FCN reorganization included an increased number of links and sum of weights in the intact occipital lobe while being reduced in the intact temporal lobe to levels beyond those of the LH. Clustering also increased, but only in the LH.
Reorganization of inter-cortical connectivity in left and right stroke patients
Because visual processing may differ in both hemispheres (Cavézian et al., 2015), we compared FCNs in left- versus right-sided damage in the alpha-band (8–13 Hz) for the local node measures centrality and long-range connectivity. Reorganization of long-range connectivity was enhanced in patients compared with controls, but the change differed between left and right hemispheric strokes: In left strokes, long-range connectivity (coherence) was significantly enhanced between the LO and LF lobe in the alpha 2 band (z = 3.118, p = 0.012) and the right frontal regions (z = 2.62, p = 0.031) (Fig. 4A). In contrast, in right hemispheric strokes, coherence was higher than controls in the LO and RP lobe (z = 2.70, p = 0.031).

In left hemispheric stroke patients, there was only a trend of enhanced alpha2 band connectivity between the RO and right frontal lobe (z = 2.58, p = 0.06). Thus, regardless of side, the intact visual cortex had a pronounced elevation in node centrality (Fig. 4B).
Global small-worldness network
Global CPL and CC describe “small-worldness” patterns of the global brain network (Fig. 4C, D). Here, small-worldness was calculated as described in previous studies (Humphries and Gurney, 2008; Watts and Strogatz, 1998). The Mann–Whitney U-test revealed that in the low beta band patients had a significantly higher CPL (z = 2.6, p = 0.009) and lower CC than controls (z = 2.3, p = 0.02), which resulted in an overall lower low-beta band small-worldness network pattern in stroke and an increased small-worldness network pattern in the alpha band (Fig. 4E); the stabilization of this network pattern was also evaluated across multiscale thresholding (Fig. 1D).
Correlations between network measures and vision
Correlating FCN parameters with visual performance outside the scotoma (i.e., in “intact” VF sectors) (white regions in the high-resolution perimetry chart displayed in Supplementary Fig. S1): The (intact) VF size refers to regions of normal detection in the intact hemifield as well as any residual vision on the scotoma side. The VF size was positively correlated with centrality in the IH Occipital_Sup (r = 0.526, p = 0.024) in the alpha band, and the node strength of temporal_inf (r = 0.494, p = 0.042) from LH positively correlated with the VF in the high alpha band.
Further, the node CC of temporal_sup negatively correlated with the VF in the high alpha band. The RT in the intact VF sector refers to the time of how fast the patient could respond to the stimulation in the intact hemifield; the node centrality of the IH supplementary motor area positively correlated with RT (r = 603, p = 0.006) in the alpha band; and the node strength in the high alpha band of temporal_mid from LH also positively correlated with RT. We also noted that the intact calcarine node's centrality positively correlated with RT in the high alpha band.
A correlation heat map (Fig. 5) shows how visual functions relate to FCN graph measures in the alpha band of patients. Greater visual detection ability was associated with larger values in degree and strength in the occipital and temporal regions and more clustering in the temporal structures of LH (Fig. 5A). The IH showed a reverse pattern: Detection was associated with lower values in CC in the occipital and temporal regions. Although VF size is a spatial attribute, RT probes temporal visual processing (Fig. 5B

Heat map summary of correlations between FCN graph measures in the alpha band and visual function (detection ability in HRP) of stroke patients. When FCN metrics (degree, strength, clustering) score high, this indicates greater rigidity/stability and less flexibility ( = low “small-worldness”). In contrast, low FCN metrics indicate less rigidity/stability and more flexibility ( = greater “small-worldness”). Black frames show common patterns of positive (red) or negative (blue) correlations in different structures of the occipital and temporal lobes in the IH or LH. For the interpretation of our results, we considered both significant values (*p < 0.05, **p < 0.01) and non-significant patterns of correlation polarities as they are also informative.
Because faster RTs are represented by smaller values, negative correlations indicate that better temporal processing was associated with greater “small-worldness.” Interestingly, a negative (moderate) correlation pattern was observed for alpha band clustering in the occipital regions of the brain in the LHs. Other overall correlation patterns were only found in the IH (occipital, temporal), where greater degree and strength was associated with poor temporal processing.
Discussion
This is the first systematic study of FCN reorganization using EEG-tracking in chronic, occipital stroke patients. Similar to other functional systems (Rossini et al., 2003; Vecchio et al., 2019), we found FCNs reorganization in visual system structures both locally (at or near the lesion site) and globally, that is, via long-range FCN changes, where different structures showed either strengthening or weakening of FCN patterns (Table 1).
In occipital regions, we observed increased centrality, degree, and strength, which were moderate in the lesioned (11–36%) but massive (31–58%) in the IH. This more “regular” (rigid) FCN pattern suggests less flexibility and less efficiency. The opposite was encountered in the temporal lobe, where FCN values dropped markedly in the IH (−12 to −32%), indicating greater flexibility and efficiency in neural processing. In contrast, FCNs remained unchanged on the lesion side.
What is the functional consequence of this network plasticity? Higher FCN values in centrality, degree, strength, and clustering signify greater rigidity/stability and less flexibility, signs of a more “structured” network (Fig. 2A), where nodes are more tightly connected with immediate neighbors (Fig. 4E). In contrast, lower values suggest less clustering and shorter path length, which are believed to support greater functional integration and processing efficiency (“small-worldness”). This is believed to signify increased functional (neurocognitive) relevance for a given function or action (Bassett and Bullmore, 2017; Douw et al., 2011).
Our stroke patients demonstrate massive FCN changes with both, “adaptive” and “maladaptive” signs of reorganization. In the IH, occipital brain areas (including visual cortex) show a more “regular” FCN structure, suggesting a functional disturbance, having less flexible and less efficient FCN (“maladaptive” plasticity). However, temporal regions show increased small-worldness, that is, more network efficiency and global integration (“adaptive” plasticity).
“Maladaptive” plasticity in the intact visual cortex may be triggered by a loss of cross-hemispheric inhibition after occipital lesions, leading to hyperactivation and desynchronization of visual signal processing. In contrast, greater FCN efficiency and integration in the intact temporal lobe indicates an adaptive role of temporal regions. Thus, EEG-tracking with subsequent FCN graph analysis unveiled signs of both “adaptive” and “maladaptive” FCN plasticity, which cannot be observed by MRI-imaged oxygenation changes. Thus, EEG-tracking markedly, and more precisely, extends our understanding of post-stroke brain network reorganization. The observation we collected in our patients is largely compatible with the current state of the art.
Maladaptive FCN reorganization in the intact visual cortex
Using MRI, Wang et al. report that brain activity is lower in the damaged regions but above normal values in the IH (Wang et al., 2010a). Nelles et al. (2007) stimulated the intact hemifield of hemianopia patients with visual stimuli, comparing BOLT activation patterns with normal subjects and observed more activation in the intact visual cortex (area 17) and bilaterally in the extrastriate cortex (areas 18/19). However, when stimulating the hemianopic side, this led to bilateral activation of the extrastriate cortex, which was stronger in the IH, suggesting that the IH was compensating by over-activation.
Our findings are compatible with the proposal of plasticity of the intact visual cortex. However, unlike the evidence of MRI overactivation, the EEG captures frequency-specific electrophysiological network changes even when there is no change in energy consumption (oxygenation); it offers a more detailed understanding of the neurophysiology consequences of unilateral stroke. Most prominently, our EEG analyses revealed a rather massive reorganization of the IH node centrality, -degree, and –strength, yet no change was observed in the CC (Table 1).
Patients' intact occipital regions were much less flexible and less efficient (involved in a lower small-worldness) than the control (up to 58%), suggesting that the intact cortex is not only hemodynamically more active (as shown by MRI), but also, in fact, processing neural information less efficiently, with less signal and more noise in visual cortical regions.
Over-activation of the IH should not be all that surprising. After all, in everyday life, hemianopia patients have to process visual information with only one visual cortex. This challenge could impact the physiology and function of the visual system in various ways:
(1) Functionally, the intact visual cortex can no longer share the task of analyzing the visual world with its “buddy”-hemisphere.
(2) When only one visual cortex has to manage tasks such as objects' tracking, synchronizing the right and left side of space, perceptual “crowding,” controlling perception–action interactions, and so on.
(3) Physiologically, unilateral lesions lead to transcallosal anatomical/functional deafferentation caused by the loss of inter-hemispheric inhibition (the “Sprague-effect”) (Sprague, 1966), creating an interhemispheric imbalance. This could explain why
(4) the contralateral “intact” hemifield has subtle perceptual deficits (Bola et al., 2013).
(5) In addition, eye movement coordination is a problem, because compensatory eye movements toward the hemianopic side complicate the temporal integration of visual stimuli (Dundon et al., 2015);
(6) the function and coordination of microsaccades is impaired, tiny eye movements that are critical for high-resolution vision (Gao et al., 2018).
Given this conglomerate of challenges, the intact visual cortex has a neural processing load that is way above normal levels. Although greater metabolic activity (observed with MRI) seems to signify adaptive compensation, our EEG-tracking suggests the contrary: less “small-worldness” with a lower efficiency of neuronal synchronization in space and time, which increases the effort to process visual signals.
Therefore, a reduced (neural network) efficiency in combination with a (metabolic) cell hyper-activation may signify less signal and more noise in the intact occipital lobe. Perhaps this is the price the brain has to pay when only one occipital cortex represents a “bilateral” visual world. We, therefore, propose that the more “regular” FCN structure of the intact visual cortex indicates maladaptive plasticity with less processing efficacy due to reduced signal/noise ratio, and this may be the cause of the known perceptual deficits in the intact visual field (Bola et al., 2013). In contrast, reorganization in the intact temporal brain regions is presumably adaptive, possibly supporting enhanced peripheral movement perception.
However, how can “maladaptive” occipital and “adaptive” temporal FCN plasticity be explained? In a speculative spirit, we propose that the loss of cross-hemispheric inhibition leads to FCN disturbance and over-activation of the intact region. Indeed, hemianopia patients suffer perceptual impairments in the presumably “intact” VF sector. Such deficits include accuracy and response time deficits when detecting or categorizing natural scenes (Cavézian et al., 2010), reduced detection ability and temporal processing (slowed RT) (Bola et al., 2013), pathological completion of simple figures (Paramei et al., 2017), reduced detection of contours composed of non-contiguous Gabor patches embedded in a random patch array (Paramei and Sabel, 2008), and Gestalt perception impairment with associated alterations of the gamma-band EEG activity (Schadow et al., 2009).
Adaptive FCN reorganization of the intact temporal lobe
In contrast to the intact occipital lobe, temporal regions showed markedly reduced node-centrality, -degree, and -strength, which were up to −32% of control values. This change toward an FCN structure of greater “small-worldness” signifies more flexibility and greater efficiency. Surprisingly, the temporal brain regions remained at normal (control) levels.
Temporal lobe alterations in stroke patients were also reported by others, but results are mixed. Vanni et al. (2001) recorded MRI alternations in a hemianopia patient with right posterior cortical damage who had undergone significant vision rehabilitation training. They found longer-latency responses in the damaged (right) superior temporal cortex, which was interpreted as a sign of compensation of the brain to produce synchronized population responses in early visual processing of the cortex (Vanni et al., 2001). On the other hand, when a hemianopia patient was trained with flicker stimulation (Henriksson et al., 2007), functional MRI revealed that information from both hemifields was processed in the IH.
This was true not only in visual areas V1, V2, V3, and V3a, but also in the visual motion-sensitive area V5 in the superior temporal gyrus. This finding is compatible with our EEG-tracking results and both are compatible with the hypothesis of “adaptive” plasticity in temporal structures. It is debatable whether greater oxygenation (activation) in MRI is good or bad for vision. Although increased oxygenation might well signify that more neurons fire action potentials, it does not teach us whether this creates more synchrony in neural signaling, that is, more signal (improving vision) or more noise (reducing vision).
The greater small-worldness of occipital–temporal, intra-hemispheric adaptations are behaviorally meaningful, if one considers the role of the temporal gyrus in normal vision as investigated in monkeys. The monkey brain is homologous to the human brain (Kolster et al., 2010). As in humans, the temporal lobe processes motion perception with its motion-sensitive MT/V5+ complex with four regions: the MT/V5 proper, the ventral part of the medial superior temporal area, the fundus of the superior temporal area, and the transition of V4, with each representing the complete contralateral visual hemifield.
These regions are sensitive to three-dimensional structures from motion and for the perception of static stimulus and movement perception. Together with some nearby regions, the V5+ complex supports about 70% of the motion localizer activation. The MT/V5+ complex is unaffected by occipital cortex lesions, as it receives its afferent input directly from the retina through the extrastriate route. This would explain why the temporal lobe FCN was unaffected on the LH and why it can support “blindsight” where hemianopia patients can correctly identify visual stimuli inside the hemianopic field without being aware of them (Cowey and Stoerig, 1991).
Our stroke patients had a sharp rise of “small-worldness” in the middle temporal gyrus (+32.6%) and this was correlated with improved temporal processing (faster RTs). We propose that this FCN change is “adaptive” FCN, possibly supporting better movement perception of the intact hemifield and thus helping the (overwhelmed) intact visual cortex to manage everyday activities, increase visual sensitivity, and improve temporal processing. This interpretation is compatible with reports that training with moving stimuli can improve perception in hemianopia (Huxlin et al., 2009; Jobke et al., 2009), that blindsight training improves VF sensitivity (Sahraie et al., 2006), and it may explain why “compensatory” eye movement training improves daily activities and VFs (Kerkhoff et al., 1992).
The dominant role of alpha-band oscillations
Our FCN changes were mainly found in the alpha and low beta frequency bands, confirming their well-known role in visual processing. Especially alpha oscillations are believed to increase signal-to-noise ratio by inducing a balance of inhibitory and excitatory influences in the brain (Sourav et al., 2018), where alpha regulates the bottom–up influences (Schepers et al., 2012) and controls the top–down attentional sampling of visual perception at around 10 Hz. Van Rullen (VanRullen, 2016) suggested that brain functions, including vision, are sustained by oscillations of neuronal aggregates with firing rates at various frequencies, which ascertains perception and cognition to operate periodically.
Therefore, different oscillations (frequency bands) require synchronization across space and time to transiently bind/unbind different sensory modalities, tasks, and cognitive states. We believe our FCN graph analysis is a valuable tool to help understand how multiple periodic functions are orchestrated or synchronized after stroke, so that internal sampling rhythms can be coordinated for the expression of overt behavior by way of short- (local) and long-distance (global) functional connections. As in normal vision, alpha-band oscillations play an important role in the damaged brain, and FCNs in the alpha band are critically altered in stroke-induced vision loss, both with adaptive and maladaptive consequences.
Reorganization in the damaged hemisphere
Compared with the IH, the damaged hemisphere actually had less pronounced FCN plasticity. Specifically, the Occipital_Mid and Occipital_Sup had a CC that was higher than the IH and CH (lesion > intact = control), that is, showing involvement in lower small-worldness (more stability, less flexibility). We interpret this to signify greater local activity and/or less long-range neural interactions in the lesion and/or its surround (Crofts et al., 2011; Wang et al., 2010a). Specifically, the lack of impairment in the damaged hemisphere could be explained as follows: First, the (MT)/V5+ complex receives direct retinofugal fibers through the extrastriate route that supports eye movement control and movement perception.
It is one of the two main pathways mediating blindsight (Cowey and Stoerig, 1991; Stoerig and Cowey, 1997), with the other being residual tissue of incomplete cortical damage (Wüst et al., 2002). Under normal conditions, the extrastriate pathway interacts with V1 projections so as to integrate retinotopy and eye movements. However, because this extrastriate pathway bypasses V1, it can still support movement perception and eye movement control. Hence, FCNs are largely unaltered.
Global small-world network reorganization
The “small-worldness” (Humphries and Gurney, 2008) structure of the FCN is characterized by a high CC and low CPL (Rubinov and Sporns, 2010; Watts and Strogatz, 1998) (Fig. 2). It shows whether nodes are tightly connected with their nearest neighbors (high cc and high CPL) or not (low cc and low CPL). The FCNs can be either highly stable and inflexible, or they are instable and highly flexible. Because neurological functions require both stability and flexibility to support stable and/or transient operations, the brain's FCN can adopt different states of “small-worldness,” which lies in between both extremes.
Patients had lower beta band small-worldness compared with controls, that is, global FCN synchronization was impaired, reducing neural processing efficiency (low small-worldness). Which Figure 2C shows the more diffuse FCN pattern in patients due to a greater number of connections with increased CC and CPL suggests a loss of “small-worldness,” that is, a less efficient network organization. However, patients had higher alpha band small-worldness compared with controls, as observed in Figure 4E, that is, global FCN synchronization was impaired, enhancing the neural processing efficiency in the alpha band (higher small-worldness) could be considered as an over-compensation of the lost functionalities, where alpha-band oscillations play a critical role in visual information processing.
The FCN reorganization between remote regions after stroke is well known and indicates local and global effects in different functional systems (Grefkes and Ward, 2014; Vecchio et al., 2019; Wang et al., 2012). Our previous observations of a loss of occipital–frontal functional connectivity in patients with optic nerve damage (Bola et al., 2014) are in line with our current finding that stroke patients have greater coherence between the occipital lobe and ipsilateral frontal lobe both in the damaged and intact hemisphere. However, patients' left and right hemisphere differed: Left stroke patients had enhanced coherence between the lesioned occipital lobe and the intact frontal lobe, but the right hemispheric stroke group had greater coherence between the intact occipital and the parietal lobe of the damaged hemisphere. This brain network (re-)organization may explain the known left/right differences in visual processing (Cavézian et al., 2015; Chokron et al., 2008).
Brain network correlation with behavioral data
To interpret our findings on a functional level, we correlated graph measures in the alpha band with visual function. In an explorative spirit, we created Figure 5, a correlation heatmap, where high scores in FCN degree, strength, and clustering indicate greater “regularity” of the network. Greater network regularity in the occipital, temporal of the LH was associated with larger VF size, which is found in patients who have incomplete hemianopia. This suggests that residual vision on the hemianopic side interferes with the overall network structure (lower “small-worldness”).
However, negative correlations were found in the IH of the occipital and temporal region. Figure 5B shows correlations between FCN metrics and RT, a marker of temporal processing of residual vision that is independent of VF size. In the IH, greater “regularity” (strength, degree) of the alpha band network was associated with longer RTs in the occipital, temporal, and frontal regions. Therefore, greater “small-worldness” correlates with faster temporal processing, that is, more efficient visual processing in the temporal and frontal lobes. Because temporal lobe gain of “small-worldness” ( = loss of regularity, Table 1) matches the RT gain, this indicates “adaptive” FCN-plasticity.
Limitations
Because FCN analyses were based on a standard head model, this might obscure subtle FCN changes caused by individual lesion sizes/locations. However, this would create a bias against the hypothesis of finding group differences. Second, some patients had non-PCAI lesions (Supplementary Table S1), but this did not affect our results. Third, we cannot solve the cause–effect problem, because we do not know whether FCN alterations are the result of chronic stroke or whether people with such FCNs are at a greater risk to suffer stroke. Indeed, personality and stress resilience are known risk factors for CNS diseases, such as stroke and glaucoma (Sabel et al., 2018).
Summary/Conclusions
Graph measures of FCN based on EEG-tracking are a useful tool to unravel the role of electrophysiological oscillations in brain network reorganization. As we showed, the stroke brain shows both local and global FCN reorganization in the high alpha and low beta bands, which can be both “maladaptive” and “adaptive” in different brain regions. To be clear, we do not believe that a given subject has either whole-brain “adaptive” or “maladaptive” FCN plasticity, but we rather propose that FCN reorganization may be “adaptive” in some brain regions but “maladaptive” in other regions of the same individual.
Specifically, we propose that the stroke FCN changes toward a more “regular” pattern are maladaptive in the intact occipital region, possibly leading to creating perceptual deficits causing spatiotemporal synchronization problems in the “intact” but crowded VF. However, FCN can also be “adaptive,” enabling temporal gyrus structures to compensate for the loss of vision.
Thus, exploring the complex architecture of the brain's FCN using EEG-tracking adds important information about temporal processing to our understanding of the brain reorganization to better explain normal and abnormal (low) vision. Brain FCN graph analysis might inspire new approaches for the diagnosis and rehabilitation of low vision and other neurodegenerative disorders.
Footnotes
Acknowledgments
The authors thank the patients for their participation in the study and S. Heinrich and C. Borrmann for their assistance.
Authors' Contributions
J.X.: student, design of the analysis and interpretation, statistics; drafting and revision of the article for intellectual content. M.A.S.: critical revision of the article for intellectual content, data collection. P.M.R.: critical revision of the article for intellectual content. T.T.: critical revision of the article for intellectual content. A.N.: critical revision of the article for intellectual content. A.A.: critical revision of the article for intellectual content. H.H.: critical revision of the article for intellectual content. Y.G.: critical revision of the article for intellectual content. B.A.S.: patient recruitment and data collection, designed and conceptualized study, interpretation of the data, and drafting and revision of the article for intellectual content.
Author Disclosure Statement
No competing financial interests exist.
Funding Information
This study was funded by the German Federal Education and Research Ministry, grant ERA-net Neuron (BMBF 01EW1210) to B.A.S. “REVIS” (Restoration of Vision after Stroke); by the National Natural Science Foundation of China under grant 62020106015; and in part by the CAS International Collaboration Key Project under grant 173211KYSB20190024, the Otto-von-Guericke-University of Magdeburg, and the Chinese Scholarship Council (stipend to J.X.). The sponsors had no involvement in the study design, the collection, analysis, and interpretation of data, the drafting of the article; nor in the decision to submit the article for publication.
Supplementary Material
Supplementary Table S1
Supplementary Figure S1
Supplement
References
Supplementary Material
Please find the following supplemental material available below.
For Open Access articles published under a Creative Commons License, all supplemental material carries the same license as the article it is associated with.
For non-Open Access articles published, all supplemental material carries a non-exclusive license, and permission requests for re-use of supplemental material or any part of supplemental material shall be sent directly to the copyright owner as specified in the copyright notice associated with the article.