
Abstract
Background:
Traumatic brain injury (TBI) damages white matter tracts, disrupting brain network structure and communication. There exists a wide heterogeneity in the pattern of structural damage associated with injury, as well as a large heterogeneity in behavioral outcomes. However, little is known about the relationship between changes in network connectivity and clinical outcomes.
Materials and Methods:
We utilize the rat lateral fluid-percussion injury model of severe TBI to study differences in brain connectivity in 8 animals that received the insult and 11 animals that received only a craniectomy. Diffusion tensor imaging is performed 5 weeks after the injury and network theory is used to investigate changes in white matter connectivity.
Results:
We find that (1) global network measures are not able to distinguish between healthy and injured animals; (2) injury induced alterations predominantly exist in a subset of connections (subnetworks) distributed throughout the brain; and (3) injured animals can be divided into subgroups based on changes in network motifs—measures of local structural connectivity. In addition, alterations in predicted functional connectivity indicate that the subgroups have different propensities to synchronize brain activity, which could relate to the heterogeneity of clinical outcomes.
Discussion:
These results suggest that network measures can be used to quantify progressive changes in brain connectivity due to injury and differentiate among subpopulations with similar injuries, but different pathological trajectories.
Impact statement
White matter tracts are important for efficient communication between brain regions and their connectivity pattern underlies proper brain function. Traumatic brain injury damages white matter tracts and changes brain connectivity, but how specific changes relate to differences in clinical/behavioral outcomes is not known. Using network theory to study injury-related changes in structural connectivity, we find that local measures of network structure can identify subgroups of injured rats with different types of changes in brain structure. Our results suggest that these different patterns of change could relate to differences in clinical outcomes.
Introduction
White matter tracts provide the underlying structure for communication between brain regions and therefore damage to these tracts can have significant impact on brain function. Traumatic brain injury (TBI) can cause diffuse axonal injury beyond the site of the trauma, with white matter tracts particularly vulnerable to injury (Johnson et al., 2013b). The location and extent of an injury can be assessed with diffusion magnetic resonance imaging (dMRI) and alterations in diffusion properties can characterize structural changes in the brain (Basser et al., 1994).
In humans (Benson et al., 2007; Kinnunen et al., 2011; Kraus et al., 2007; Mac Donald et al., 2007; Wilde et al., 2008) and rodents (Budde et al., 2011; Mac Donald et al., 2007; Pischiutta et al., 2018; van de Looij et al., 2012), the diffusion metrics of fractional anisotropy (FA), axial diffusivity, radial diffusivity, and mean diffusivity have all shown injury-related changes in brain structure and additional changes have been found in white matter fiber density (Harris et al., 2016a; Wright et al., 2017). In animal models, the changes in diffusion metrics and fiber density indicate the possibility that, alongside axonal and myelin degeneration, there is axonal sprouting and structural reorganization following an injury (Christman et al., 1997; Harris et al., 2016a).
Despite the extensive research in TBI-induced structural changes, thus far, it has been difficult to link observed changes in brain structure to behavioral/clinical outcomes because the extent of damage and change in brain structure is highly heterogeneous in humans and rodents.
Diffusion metrics can provide information about injury-related changes to brain structure, and the use of tools from network theory (Bassett and Sporns, 2017) offers an opportunity to understand how TBI induces local and global changes in brain connectivity (Bassett and Sporns, 2017; Feldt et al., 2011; Sharp et al., 2014). Studies utilizing structural networks have found that TBI induces changes in a subset of brain connections (Dall'Acqua et al., 2017; Hayes et al., 2016; Iraji et al., 2016; Thengone et al., 2016) and can alter a network's characteristic path length, global/local efficiency, betweeness centrality, eigenvector centrality, and small worldness (Caeyenberghs et al., 2014; Königs et al., 2017; van der Horn et al., 2017; Yuan et al., 2015). Furthermore, it has been shown that betweenness centrality and eigenvector centrality can potentially be used as diagnostic biomarkers (Fagerholm et al., 2015).
Importantly, in addition to the observed heterogeneity of changes in network structure, there is also a large heterogeneity in clinical outcomes post-TBI, ranging from cognitive impairment (Kinnunen et al., 2011) to an increased risk of developing post-traumatic epilepsy (PTE) (Annegers et al., 1998). The incidence of PTE can be as high as 53% of patients, depending on injury severity and type of injury (penetrating vs. blunt) (Frey, 2003), and correlates with the severity of the injury (Annegers et al., 1998; Christensen et al., 2009; Mahler et al., 2015). Unfortunately, there are no clear biomarkers for predicting clinical outcomes post-TBI (Pitkänen and Immonen, 2014).
In this study, we use the lateral fluid-percussion injury (FPI) model to induce severe TBI in rats and use network theory to study the associated changes in brain structure post-injury (McIntosh et al., 1989; Rau et al., 2012, 2014; Smith et al., 2018). This model mimics the damage observed clinically (Xiong et al., 2013) and displays heterogeneity in the severity of injury both structurally and functionally. In rats, neuronal injury induced by FPI is marked by a combination of focal cortical contusion and diffuse subcortical neuronal injury (Hicks et al., 1996). In addition, the FPI model produces behavioral and cognitive deficits, such as movement and memory deficits, which are commonly seen in patients with TBI (Hamm, 2001; Morales et al., 2005), and some rats will go on to display spontaneous seizures (Bolkvadze and Pitkänen, 2012; Immonen et al., 2013).
To characterize the heterogeneity in structural damage post-injury, we examine the properties of large-scale structural brain networks derived from dMRI data in injured and control rats. We find differences in subnetwork brain structure between injured and control rats, and that animals within the TBI, but not Control, group can be clustered into two distinct subpopulations driven by changes in local motif structure of the brain networks. Furthermore, simulated functional connectivity patterns predict that one subgroup shows higher levels of synchronization, which we speculate could be related to differences in clinical outcomes between subgroups such as the propensity to later develop epilepsy.
Materials and Methods
Ethical treatment of animals
The Institutional Animal Care and Use Committee at SUNY Buffalo approved all procedures in these studies.
TBI procedure
Adult, male, Wistar rats (300–350 g) were obtained from Charles River Laboratories (Wilmington, MA, USA) and single housed in a 12-h light/12-h dark schedule with ad libitum access to food and water. The lateral FPI procedure was performed as we have previously published (McGuire et al., 2019).
Briefly, animals were deeply anesthetized using 2–4% isoflurane. A 5 mm trephin was used to make a craniectomy over the right hemisphere, equidistant between the lambda and the bregma and adjacent to the lateral ridge. Animals received a 20 msec fluid pressure pulse to the dura at an average of 2.79 ATMs of atmospheres (range of 2.64–2.98 ATMs). Following injury, animals became apneic after injury for an average of 38 sec (range of 0–60 sec) and were manually ventilated with supplemented O2 until normal breathing resumed. A death rate of 33% was observed for injured animals.
Righting reflex time was recorded for each animal, averaging 34 min (range of 17–60 min). Injury severity was determined based on functional behavior as measured by the neurological severity score (NSS), assessed at 24 h after injury. In total, 8 animals received the insult (TBI group) and 11 animals received only the craniectomy (Control group). Given the small sample size, the severe model of FPI was utilized to maximize the heterogeneity of injury in the TBI group.
Diffusion tensor imaging
To record changes in brain network structure resulting from TBI, diffusion tensor imaging (DTI) scans were performed 5 weeks after the insult with a 20 cm diameter horizontal-bore 9.4 Tesla magnet (Biospec 94/20 USR; Bruker Biospin) equipped with imaging gradient coils supporting 440 mT/m gradient strength and 3440 T/m/sec maximum linear slew rate (BGA-12S HP; Bruker Biospin). We employed a cross-coil configuration with a 4-channel receiver rat-brain surface array and a transmitter volume coil. The scanner was operated with ParaVision (version 5.1; Bruker Biospin). The DTI scans consisted of a respiration-gated 3D Spin-Echo DTI sequence with a two-shot echo-planar readout and reversed readout gradients for Nyquist ghost suppression.
DTI acquisition parameters were as follows: 213 × 144 × 166 μm3 field of view; 133 × 90 × 52 matrix zero-filled to 266 × 180 × 104; 1 average; TE/TR 25.96/1000 msec; B = 1000 sec/mm2 in 30 directions across the whole sphere; 4 unweighted acquisitions (B0); and 3 msec diffusion times at 415.9 mT/m and 12 msec duration. The acquisition time with gating was ∼90–120 min.
DTI pre-processing and structural connectivity
Voxel dimensions of the diffusion images were scaled by a factor of 10 × . This scaling factor is only applied to the header information in the DTI file to make the dimensions of the voxels compatible with the FSL software package, which expects the DTI images to have human sized voxels. It is important to note that scaling does not change the underlying DTI images.
Motion and eddy-currents were corrected with FSL Eddy (Andersson and Sotiropoulos, 2016). Following eddy and motion correction, B0 images were averaged to create a brain mask using FSL Brain Extraction Tool (BET) (Smith, 2002). Advanced Normalization Tools (ANTs) (Avants et al., 2008), specifically ANTs Syn with default parameters, was used to register a brain atlas with 150 regions spanning cortical and subcortical areas (Valdés-Hernández, 2011) to the average of the B0s.
Fiber tracking and network construction
Fiber tracking was done in DSI Studio with a modified FACT algorithm (Yeh et al., 2013). Whole brain seeding was used to generate 500,000 tracts with an FA threshold of 0.12 and angular threshold of 45°, step size of 1 mm, minimum length of 2 mm, and maximum length of 300 mm based on the scaled voxel dimensions. To fully sample the fiber orientations within a voxel, tracking was repeated 1000 × with initiation at a random subvoxel position generating 1000 connectivity matrices per animal.
For each animal, an undirected weighted structural connectivity matrix, A, containing 150 brain regions was constructed by counting the number of streamlines between brain regions (Valdés-Hernández, 2011). The final connectivity matrix was based on the average of the 1000 matrices. Connectivity matrices were then normalized by dividing the number of streamlines (T) between region i and j, by the combined volumes (v) of region i and j. This normalization is important to ensure that the strength of the connectivity between two regions is not influenced by volumes of the two respective regions (Zalesky et al., 2010b).
Network similarity
We assessed global dis-similarity between two subjects, p and q, based on the similarity of their structural connectivity using the L2-Norm, which is defined as,
where Ap and Aq correspond to the structural connectivity matrices from subject p and q, respectively.
Eigenvalue spectrum
Each connectivity matrix (A) was decomposed to corresponding eigenvalues and eigenvectors. Eigendecomposition is obtained by solving the linear equation,
where λ = [λ 1 … λn ] are the corresponding eigenvalues (EigVal) and v = [v1… vn ] the eigenvectors of A. The eigenvalue spectrum of A describes structural properties of the network.
Statistical differences were based on the full distribution of eigenvalues, pooled across TBI and Control animals, respectively, and assessed with the Kolmogorov-Smirnov (K–S) test. We report the p-value and K–S test statistic (D) with a range [0, 1], which quantifies the maximum differences between the cumulative distributions.
Network-based statistics
Network-based statistics (NBS) was used to identify subnetworks that increased or decreased in strength due to trauma (Zalesky et al., 2010a). Previous research has identified subnetworks that are significantly altered in moderate to severe TBI in humans (Dall'Acqua et al., 2017; Solmaz et al., 2017). We used NBS to test if similar changes occur in the FPI model of severe TBI in rats.
NBS implementation involves initially calculating the T-statistic for each connection between animals in the TBI and Control groups followed by applying a primary threshold to the T-statistic to identify a subnetwork. The threshold results in subnetwork with L edges. Statistical significance of the subnetwork is based on randomizing the group labels between individuals and calculating the size of the subnetwork after randomization. Familywise error (FWE)-corrected p values were calculated on the subnetwork using a null distribution derived from 5000 permutations (Zalesky et al., 2010a). Subnetworks that survived a network-level threshold of p < 0.05 (FWE corrected) were considered significant. NBS analysis was conducted using the Brain Connectivity Toolbox (Rubinov and Sporns, 2010).
Since the choice of a primary T-statistic threshold is arbitrary, it is important to ensure the results are consistent over a range of thresholds. Therefore, we conducted our analysis with threshold values ranging from 1.0 to 2.5 in steps of 0.1. In this article, we present the results with the strongest FWE-corrected p-value, which occurred with a T-threshold of 1.8 for the subnetwork that increased in strength in the TBI group, and T-threshold of 2.0 for the subnetwork that decreased in strength in TBI group.
Minimum spanning tree
The minimum spanning tree (MST) is a subnetwork that connects all nodes, while minimizing edge weights without forming loops (Kruskal, 1957; Tewarie et al., 2015). Since in brain networks edge weights represent the density of tracts between regions and we are interested in information flow along these tracts, we calculated the MST using the inverse of the connections in structural connectivity. We additionally calculated the cost network associated with the MST (MST-Cost). Network cost is defined as the connection weight multiplied by the Euclidian distance between the centroids of two regions (Achard et al., 2006; Heuvel et al., 2012).
Statistical differences were based on the distribution of connections assessed with the K–S test between the pooled TBI and Controls. We report the p-value and K–S test statistic (D) with a range [0, 1], which quantifies the maximum differences between the cumulative distributions.
Degree
The weighted node degree (ki
) is defined as the sum of all connections of a node (Rubinov and Sporns, 2010),
where A is the weighted adjacency matrix of a network with N nodes (Rubinov and Sporns, 2010).
Betweenness centrality
Betweenness centrality (BC) of a brain region is the fraction of all shortest paths in the network that pass through that region and is defined as,
where
Local efficiency
Local efficiency (El
) is the global efficiency computed on the neighborhood of node i,
where Aij and Aih are strength of the connection between node i to j and h, respectively, and djh (Ni) is the length of the shortest path between node j and h that contains only neighbors of node i (Rubinov and Sporns, 2010).
Motif analysis
Motifs (M) are patterns of network connections among a specified number of nodes forming a subgraph (g), which act as building blocks for complex networks (Sporns and Kötter, 2004). Given that our structural connectivity matrices are undirected, our analysis focused on two types of three-node motifs and six types of four-node motifs. Individual motifs are named using the convention from Sporns and Kötter (2004).
To assess how strongly a brain region participates in a specific motif, we calculated the motif coherence (Q) for each brain region (Onnela et al., 2005). We used motif coherence because it accounts for low probability values attributable to one connection weight being low versus all connection weights being low (Onnela et al., 2005). For each individual motif pattern, g, Q is defined as
where lg is the set of edges in the specified subgraph, |lg | is the number of edges in that subgraph, and A is the connection strength between brain region i and j. Motif coherence was calculated using the Brain Connectivity Toolbox (Rubinov and Sporns, 2010).
Z-score calculations
To assess differences in regional measures of brain structure (degree, BC, local efficiency, and motifs), we used a permutation analysis to calculate Z-scores based on the difference in the TBI or T1/T2 subgroups when compared to the Control group. Specifically, for a single measure, Q, the difference between the TBI/T1/T2 and Control groups is as follows:
where
where
Clustering analysis
To test for the existence of subpopulations, we designed a two-step unsupervised clustering procedure that utilized network measures to cluster animals into subgroups. The clustering analysis was performed separately for TBI and Control groups. In the first step, using kmeans.m in MATLAB, we clustered animals based on similarity for each of the 16 network measures studied: Structural Connectivity (Wei), Eigenvalue spectrum (EigVal), NBS, MST, MST-Cost, Degree (Deg), BC, Local Efficiency (Elocal), and eight distinct Motifs.
Similarity between animals was calculated using the L1-Norm. The optimal number of clusters (K) was determined by iterating K from 1 to N (N TBI = 8; N Control = 11, respectively) and the K with the maximum average silhouette value, which measures how similar a subject is to other subjects in the same cluster, was chosen as the optimal number of clusters.
To implement this, we first used only the structural connectivity of each animal to perform clustering; thus, the animals were assigned to a cluster based only on the similarity in their structural connectivity. This was then repeated for the other network measures. The animals therefore were assigned a cluster label for each of the 16 network measures.
In the second step, we created an association matrix that records the number of times two animals were in the same cluster across the 16 network measures. Subgroups within a population were identified by clustering the association matrix using modularity-maximization. Modularity-maximization identifies communities in which the similarity within a cluster is greater than between clusters. In addition, modularity-maximization does not require a predefined number of clusters to be specified. The resolution of the clusters can be controlled with parameter γ.
Modularity-maximization was implemented with the Generalized Louvain algorithm (γ = 1) (Mucha et al., 2010). To avoid such suboptimal results due to initial seeding, clustering was repeated 100 × and final results were based on the consensus across the 100 runs (Bassett et al., 2013).
Predicted functional connectivity
Functional connectivity was predicted using the path transitivity (Goni et al., 2014). Path transitivity estimates the amount of signal that propagates from brain region i to j, while taking into account the number or re-entrant connections along the shortest path (Avena-Koenigsberger et al., 2017). Path transitivity was calculated using the Brain Connectivity Toolbox (Rubinov and Sporns, 2010).
To assess changes in predicted functional connectivity, statistical significance was based on the difference in the TBI and subgroups when compared to the Control group. We first calculated the average predicted functional connectivity, <FCT/S>, for the TBI and the subgroups, followed by subtracting the average predicted functional connectivity from the Control, <FCC>.
The resulting values represent the overall change in predicted functional connectivity FCD for the TBI and subgroups, respectively. We then assessed differences between the TBI and the subgroups with an analysis of variance (ANOVA).
However, because this ANOVA does not assess which specific connections have a higher propensity to change, we performed additional analysis. To assess changes in individual connections, statistical significance was based on permuting group labels 10,000 × , and connections with Z-scores (
Experimental design and statistical analysis
The lateral fluid percussion model of TBI was used to induce severe injury in Wistar rats (n = 8) and sham controls (n = 11) (Fig. 1A). The sham controls received the surgery, but no injury. Five weeks after the injury, animals underwent DTI (Fig. 1B) from which tractography and structural connectivity were determined (Fig. 1C, D).

Experimental design and analysis.
Network measures were calculated using the Brain Connectivity Toolbox (Rubinov and Sporns, 2010) and unique scripts in MATLAB 2017B (MathWorks). Statistical analyses were based on a combination of parametric and nonparametric tests as appropriate, and permutation testing was used when analyzing measures of local network structure in which multiple comparison issues applied. See individual methods sections for details. In addition, BrainNet Viewer was used to display results (Xia et al., 2013).
Results
In this study, we quantify changes in structural connectivity in a population of 8 animals that received a severe-TBI using the lateral-FPI model and 11 control animals that received only the craniectomy surgery. Five weeks after the injury, animals underwent DTI from which structural brain networks were created. We first compare brain network structure between Control and TBI animals using network measures that assess network structure at the (1) global level; (2) subnetwork level; and (3) local level, and then show how these measures can be further used to detect the heterogeneity of injuries within TBI animals.
Global network analysis
We first measured brain network structure at the global level in both TBI and control animals in an attempt to identify types of large-scale structural changes associated with TBI. Specifically, we used the Euclidean distance between structural connectivity matrices to measure the magnitude of dis-similarity between the TBI and the Control group (Supplementary Fig. S1A), but found no significant difference (Supplementary Fig. S1B). We also examined the eigenvalue spectrum of the networks, but again observed no difference between the TBI and Control groups (Supplementary Fig. S1C). These results indicate that at the global level, these two measures of network structure are not able to distinguish between the two groups.
Subnetwork analysis
We next asked if the injury induced by the FPI primarily affects only a subset of connections in the brain. We first applied NBS to identify subnetworks that increased or decreased in strength in the TBI group relative to the Control group. With NBS, we identified a subnetwork consisting of 268 connections (n = 8 rats), which increased in strength (Fig. 2A) (p << 0.001). In addition, the magnitude of the increase in strength of the connections was negatively correlated with the distance between brain regions (r = −0.46, p = 1.53 × 10⁻¹⁵) (Fig. 2B). Alongside this component, NBS identified a smaller subnetwork with 74 connections (n = 8 rats) in which the connection strengths decreased (Fig. 3C) (p << 0.001).
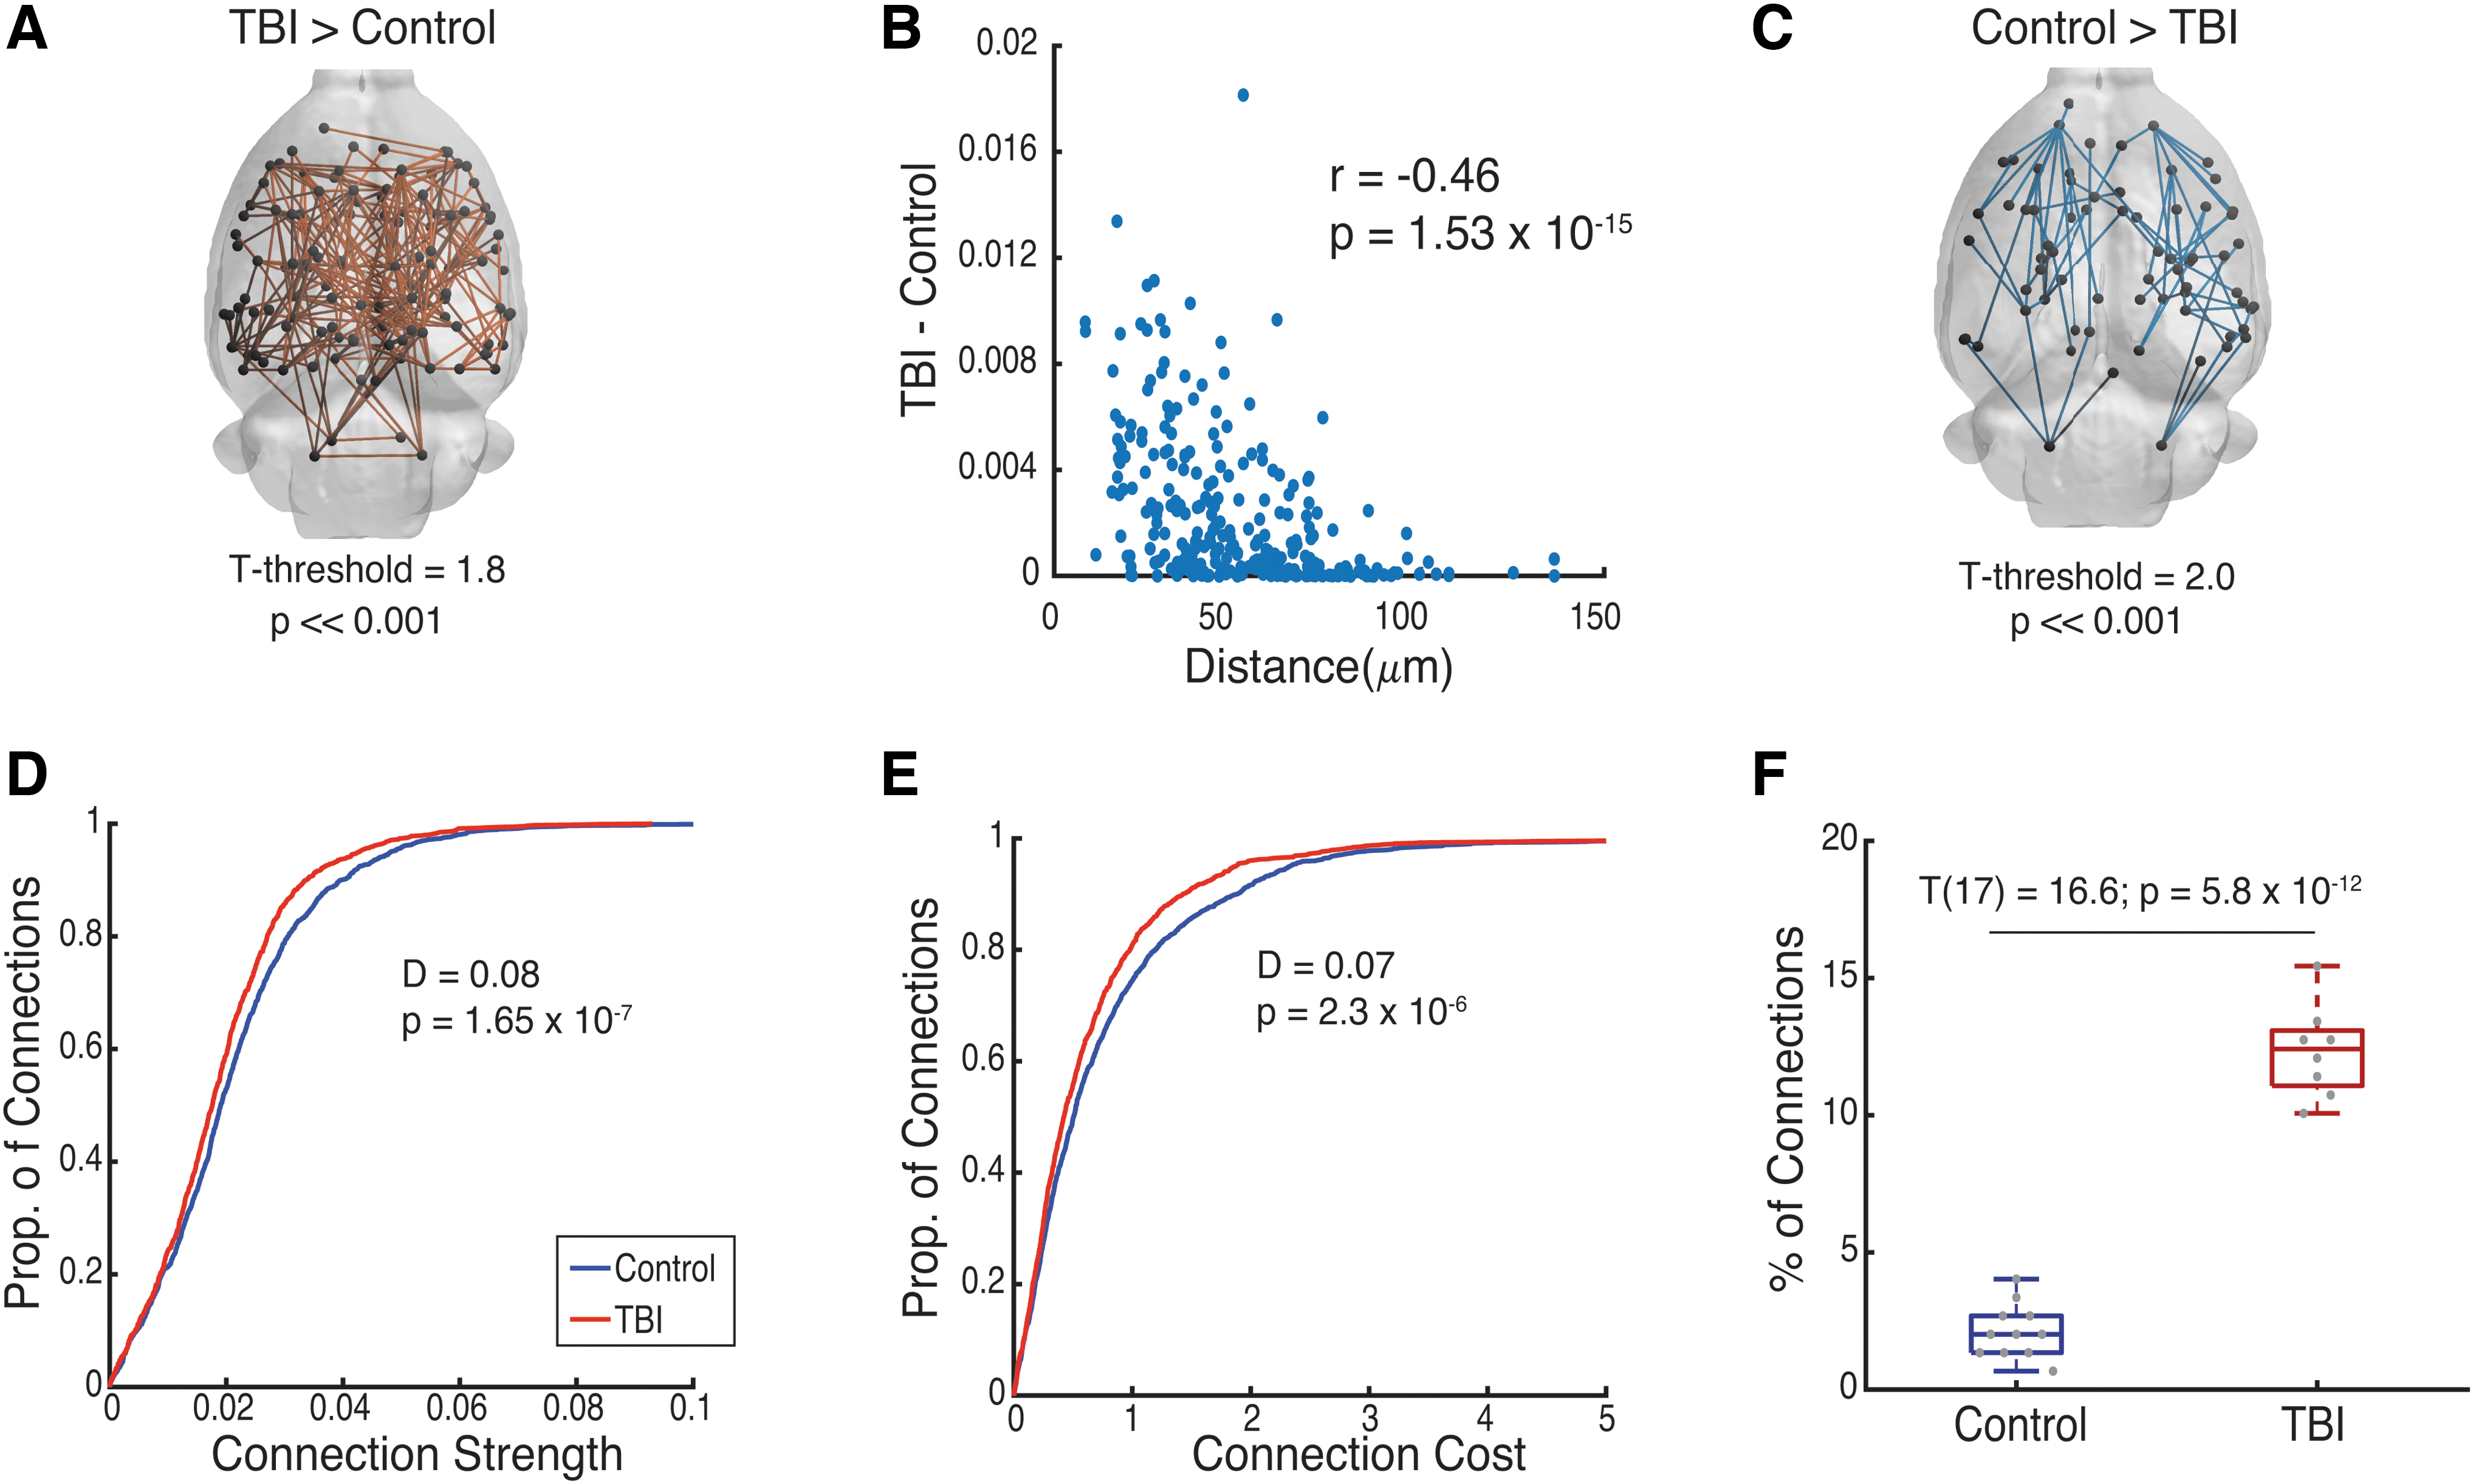
Injury-induced changes in structural connectivity subnetworks.

Local analysis of injury-induced changes. Significant differences between TBI and Control groups in a brain region's
We also assessed if there were corresponding changes in the network backbone as measured with the MST. We found that TBI induced a shift in the MST toward weaker (MST: D = 0.08, p = 1.65 × 10⁻⁷) and lower cost connections (MST-Cost: D = 0.07, p = 2.3 × 10⁻⁶) (Fig. 2D, E, respectively). Finally, we assessed for an association between connections found in the NBS and MST. We found significant differences in the percentage of connections in common between the NBS and MST subnetworks between the two groups (T 17 = 16.6, p = 5.8 × 10⁻¹²) (Fig. 2F). Specifically, in the TBI group, 12.3% ± 1.68% (SD) of connections were present in both subnetworks, while in the Control group, only 2.1% ± 0.98% (SD) were present in both subnetworks.
Local network analysis
Our previous analysis identified a series of changes in subnetwork structure, indicating that injury induced changes might be better assessed using local network measures. We therefore examined how network measures that assessed connectivity at individual brain regions could be used to measure local changes in network structure post-TBI. We first looked at three commonly used measures of regional connectivity that have previously been used to measure TBI-induced changes in brain structure: degree, BC, and local efficiency.
As seen in Figure 3A–C, for each measure, we were able to detect specific brain regions with increases/decreases in these measures relative to controls, but the spatial patterning of where these changes occurred differed between measures, suggesting that a multitude of different types of changes in local network structure are occurring throughout the brain.
We followed up these observations with a further assessment of local connectivity and investigated the changes that TBI induces in motif coherence, which measure how strongly a brain region participates in specific patterns of connections (Materials and Methods section; Fig. 3D) (Onnela et al., 2005). In the TBI group, 9.3% of brain regions (N = 14 brain regions from n = 8 rats) increased in motif coherence, and 6% of brain regions (N = 9 brain regions from n = 8 rats) decreased in motif coherence relative to the Control group (Fig. 3E). These results confirm that in the TBI group, we see changes in network structure occurring at the local level.
Detection of subgroups within heterogeneous TBI populations
One of the hallmarks of TBI is the diverse response in patients (Ghajari et al., 2017; Kinnunen et al., 2011; Sidaros et al., 2008) with a subset of patients and animals developing PTE (Frey, 2003; Kharatishvili et al., 2006). This diverse response implies the existence of subpopulations within the TBI group due to different trajectories in pathological progression. To test for the existence of subpopulations within the TBI group, we designed a two-step unsupervised clustering procedure based on the previously described network measures. Clustering based on individual network measures resulted in the detection of two clusters in the TBI group, with the exception of Motif 4–199, which contained three clusters (individual columns of Fig. 4A).

Clustering analysis and subpopulation identification of animals with TBI.
Using these results to perform our final clustering step, we identified two subgroups in the TBI population, which we labeled the T1 (n = 3 rats) and the T2 (n = 5 rats) subgroup (Fig. 4B). Notably, when the same analysis was performed on the Control group, we did not identify any subpopulations (Supplementary Fig. S2), suggesting that the observed heterogeneity within the TBI group is directly related to network reorganization post-injury.
Network motifs as markers of heterogeneity
When examining the membership of the T1 and T2 subgroups, we found that the T1 subgroup was composed of the first three animals, indicating that the motif analysis was driving the separation into two groups (see Fig. 4A). To gain a better understanding of these changes, we analyzed how motif expression changed within T1 and T2 subgroups relative to the Control group. To account for the low number of animals, statistical testing was based on a permutation test in which subgroup labels were permutated 10,000 × (see Materials and Methods section).
For the T1 subgroup, brain regions primarily increased in their motif coherence relative to Controls (increase: N = 57 brain regions and decrease: N = 1 brain regions from n = 3 rats) (Fig. 5A). In contrast, in the T2 subgroup, brain regions primarily decreased in motif coherence (Decrease: N = 23 brain regions and Increase: N = 5 brain regions from n = 5 rats) (Fig. 5B).
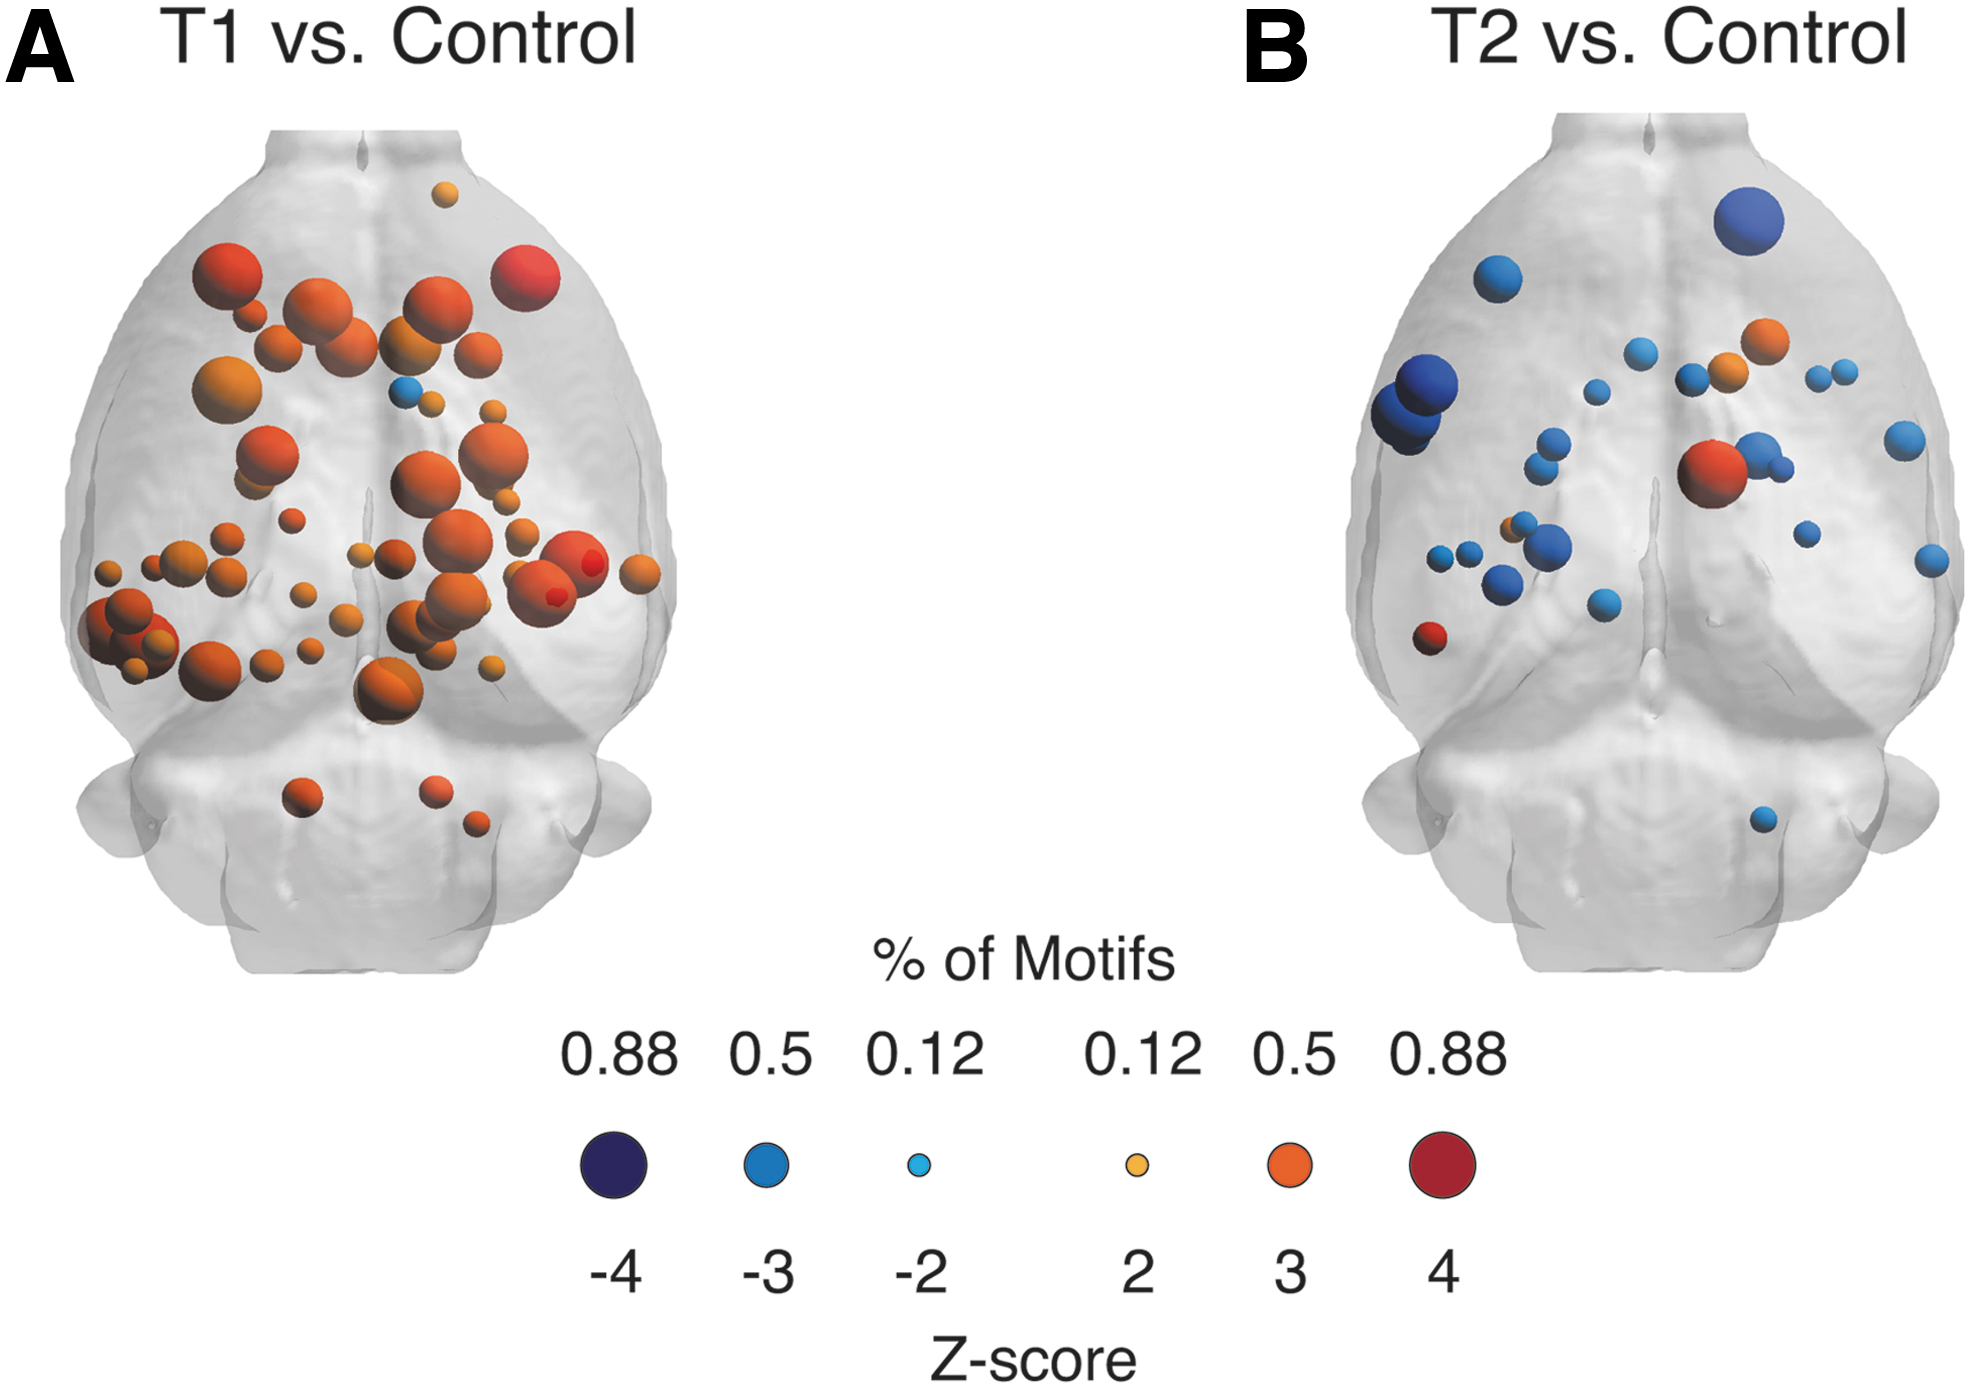
Subgroup analysis of regions for which differences in motif coherence are statistically significant.
Predicted functional connectivity
Given that we observed two subgroups with different types of structural changes in TBI animals, we next asked if these structural differences might lead to corresponding changes in functional brain activity. Previous work has indicated that the presence of different types of motifs can differentially impact the network's propensity to promote synchronous brain activity (Terry et al., 2012). Functional connectivity describes statistical relationships between the activity of two brain regions, and the degree of functional connectivity can be associated with synchronization in brain activity.
To assess potential differences in synchronized activity between the two subgroups, we tested if the structural differences observed between T1 and T2 subgroups might result in the two subgroups displaying different patterns of functional connectivity. To predict functional activity of the two subgroups, we used a computational approach based on path transitivity (Goni et al., 2014) (see Materials and Methods section).
In Figure 6A, we show the average predicted functional connectivity for the Control group, T1, and T2 subgroups. We found that the average change in functional connectivity was significantly increased for TBI group as a whole [TBI vs. Control: 0.008 ± 0.04 (SD)] and the T1 subgroup [T1 vs. Control: 0.035 ± 0.06 (SD)], but decreased for the T2 subgroup [T2 vs. Control: −0.008 ± 0.05 (SD)] relative to Controls (F 2,32631 = 1758, p << 0.0001) (Fig. 6B).
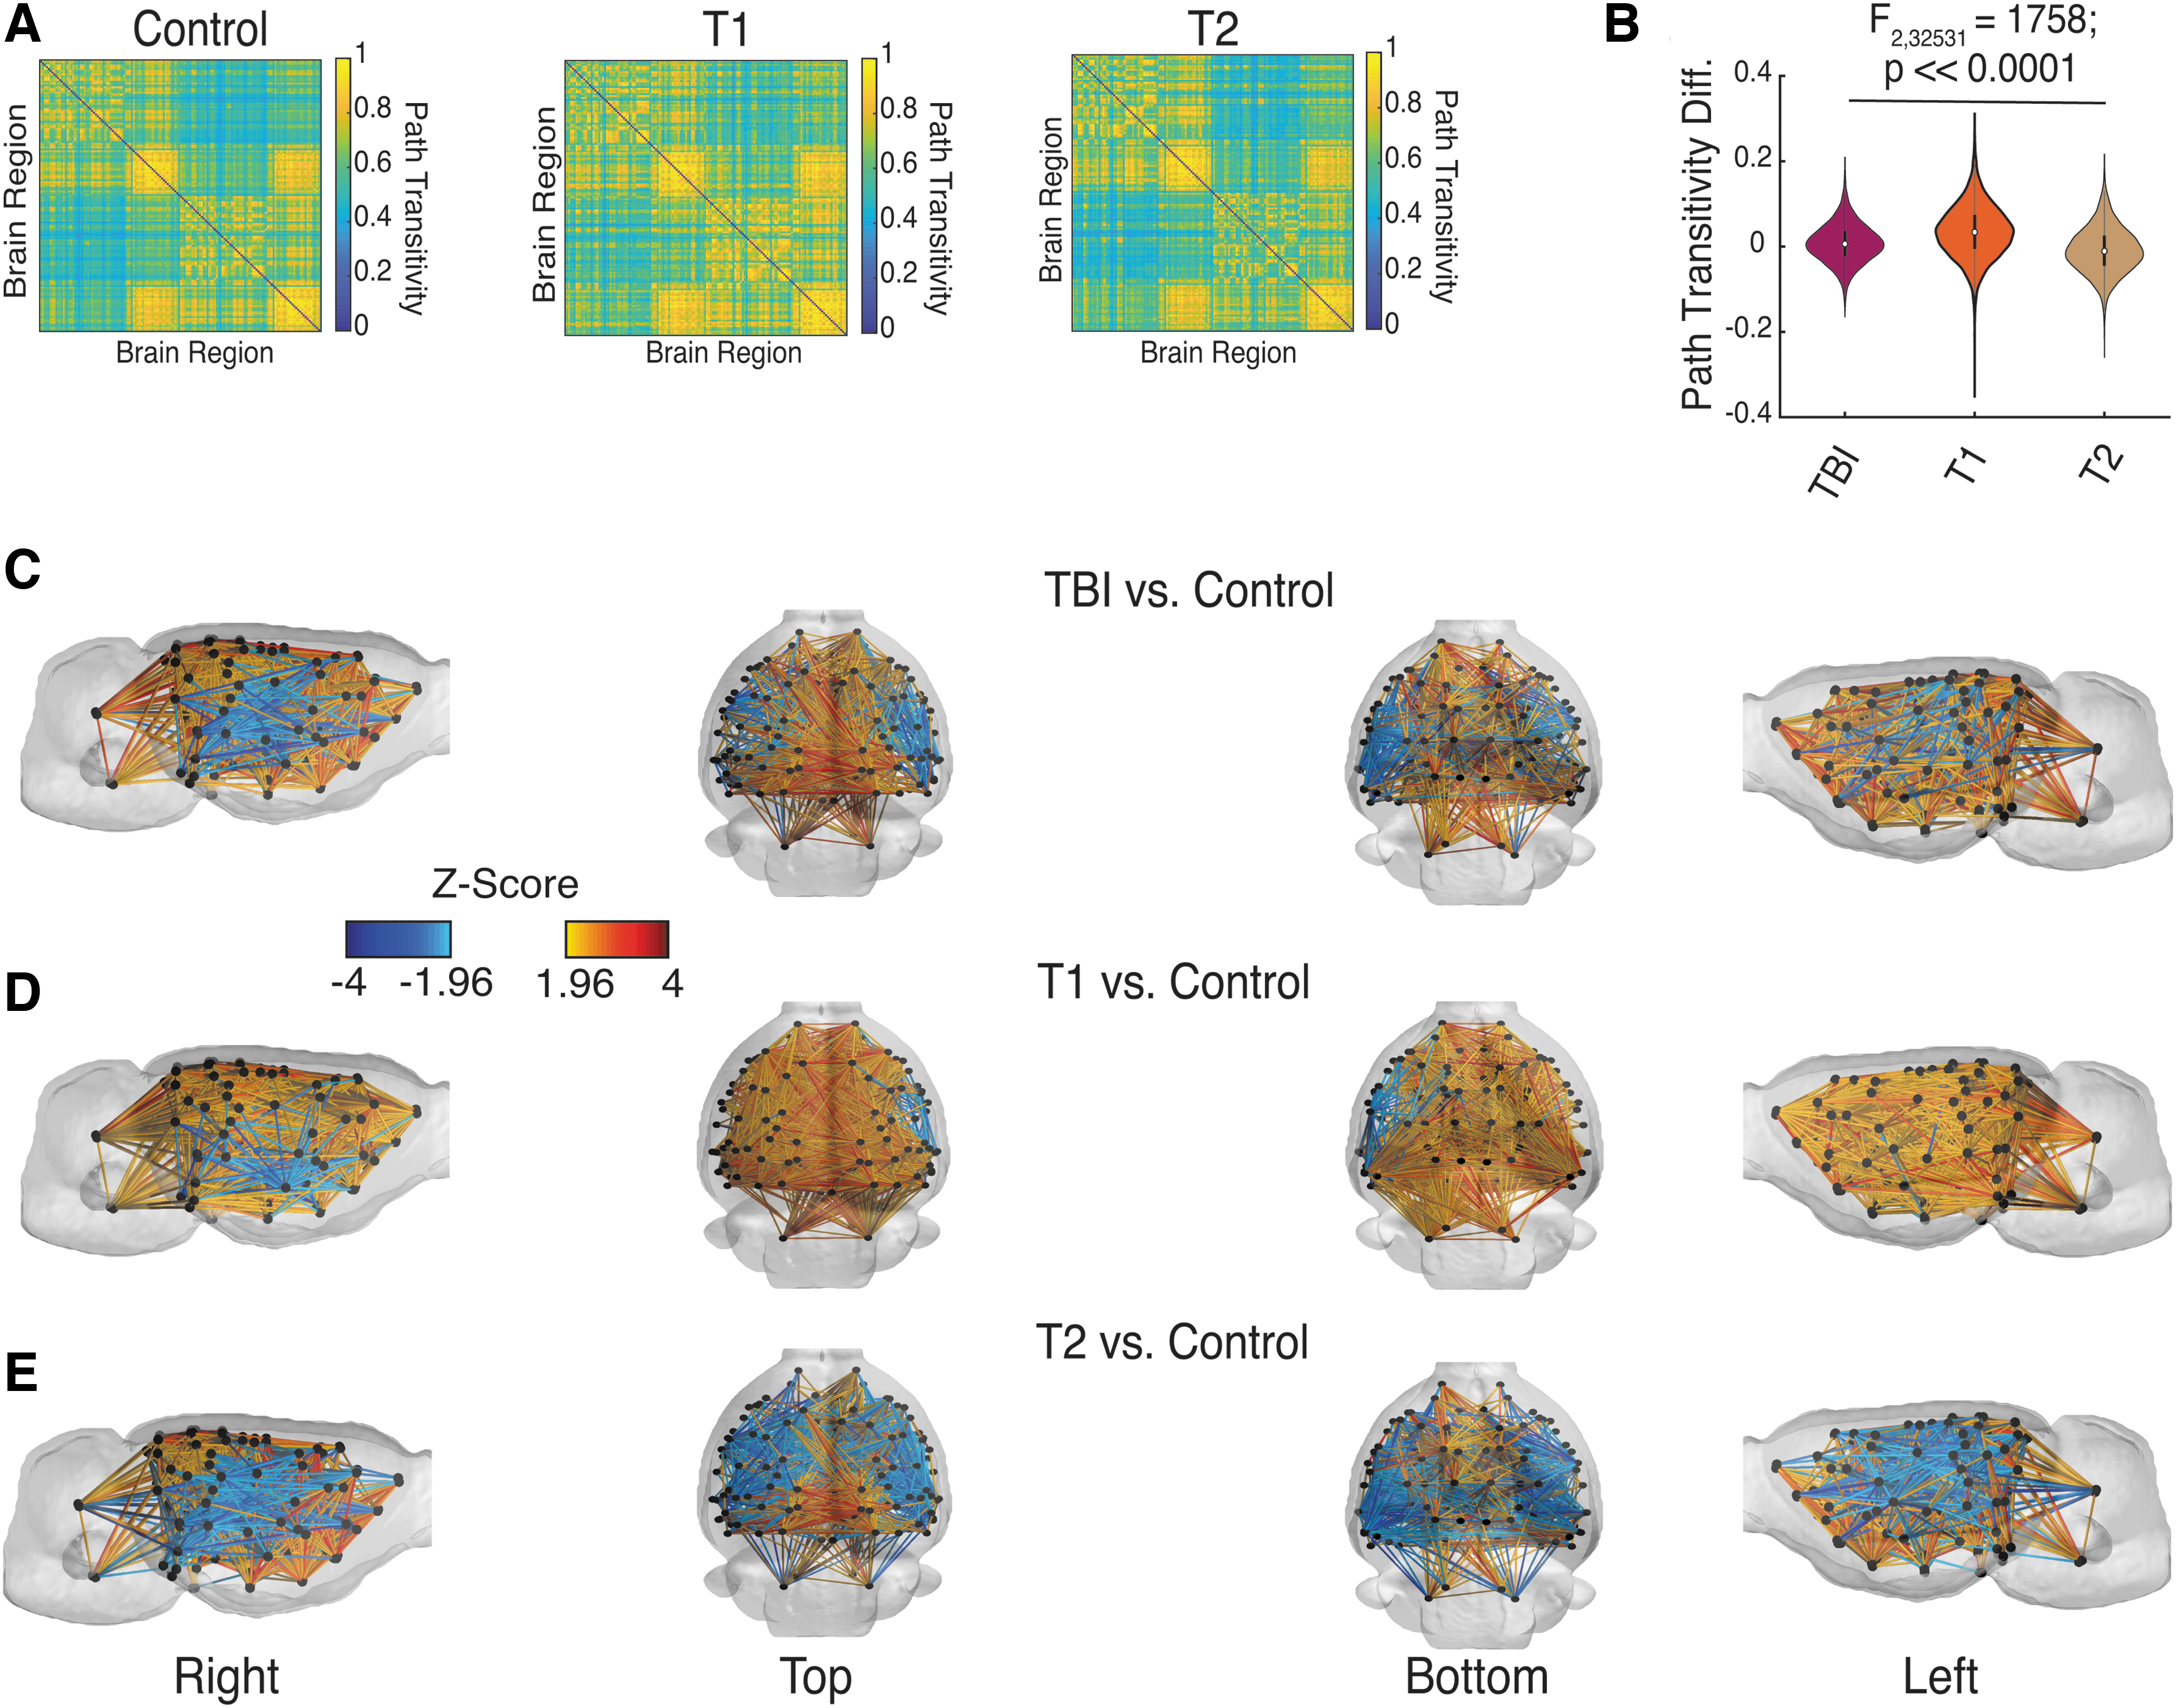
Predicted and changes in functional connectivity between TBI subgroups and Control group.
Examining individual connections in the predicted functional connectivity, we found that when compared to the Control group, in the TBI group, 5.6% of connections increased in strength (N = 630 edges in n = 8 rats), while 1.9% of connections decreased in strength (N = 207 edges in n = 8 rats) (Fig. 6C). By separating the animals into their respective subgroups, the T1 subgroup showed 9.2% of connections increased (N = 1033 edges in n = 3 rats) and 0.7% of connections decreased in strength (N = 81 edges in n = 3 rats) (Fig. 6D).
In contrast, the T2 subgroup showed 3.8% of connections increased (N = 422 edges in n = 5 rats) and 4.3% of connections decreased in strength (N = 483 edges in n = 5 rats) (Fig. 6E). Interestingly, in both the T1 and T2 subgroups, the connections that decreased in strength were located adjacent to the site of the injury.
Discussion
TBI is marked by focal and diffuse jury to both gray and white matter in the brain (Gentleman et al., 1995; Johnson et al., 2013b; Smith et al., 2003). Along with structural damage, TBI has been associated with a variety of adverse functional/behavioral changes. For example, TBI increases the risk of developing PTE (Annegers et al., 1998; Christensen et al., 2009; Englander et al., 2003; Mahler et al., 2015; Smith et al., 2018; Wang et al., 2013; Webb et al., 2015) and it has been shown that a subpopulation of TBI patients with a similar pattern of abnormal network connections exhibited decreased cognitive performance (Solmaz et al., 2017).
However, no clear biomarkers exist for predicting who will develop adverse functional effects, so it is important to characterize the heterogeneity of brain structural changes resulting from injury (Pitkänen and Immonen, 2014). In this study, we use network theory to characterize changes in global and local connectivity following TBI in rats induced by FPI to probe how heterogeneity in structural changes might drive some of the heterogeneity observed functionally and behaviorally.
We found that two global measures of structural connectivity were not able to distinguish the TBI group from the Control group, despite animals in the TBI group receiving a severe injury, which was validated by functional assessment (NSS). Instead, we found changes in a subset of connections and nodes, which is consistent with previous work that found changes in the density of a subset of fibers in moderate-to-severe injuries (Harris et al., 2016a; Iraji et al., 2016; Wright et al., 2017), and in subnetworks in structural connectivity following TBI (Dall'Acqua et al., 2017; Hayes et al., 2016; Iraji et al., 2016; Thengone et al., 2016).
These alterations indicate adaptive and maladaptive changes in brain connectivity (Fornito et al., 2015). Adaptive responses could indicate myelin repair (Armstrong et al., 2016) and/or axonal sprouting post-TBI (Christman et al., 1997; Harris et al., 2010). On the other hand, maladaptive changes could be a result of axonal death (Gentleman et al., 1995; Smith et al., 2003), myelin damage (Bramlett and Dietrich, 2002; Johnson et al., 2013b), and neuroinflammation (Johnson et al., 2013a).
The changes in local connectivity were primarily found in shorter distance connections, which increased in strength causing the network backbone to include more short-range connections. These shifts in the network backbone could be indicative of a break down in efficient communication between brain regions (Avena-Koenigsberger et al., 2017).
In humans, moderate–to-severe TBI has been found to induce subject-specific alterations in the underlying white matter, raising the possibility of individualized pathological trajectories (Ware et al., 2017). In our analysis, changes in brain structure could separate animals in the TBI group into two subpopulations, which we called the T1 and T2 subgroups. This aligns with previous work in humans in which alteration in structural connectivity in a population with moderate-to-severe injury separated individuals into subpopulations with corresponding differences in cognitive performance (Solmaz et al., 2017).
In our analysis, we found that the presence of subgroups was driven by differences in motif participation, indicating that local connections between brain regions could play an important role in network reorganization post-injury. Modeling studies that have focused on the relationship between motifs and synchronized activity have found that certain structural connectivity patterns, linear connections, Motif 3–9 (Fig. 3D), promote zero-phase lag synchrony (Gollo and Breakspear, 2014; Gollo et al., 2014). At the level of neuronal connectivity, computational modeling studies have shown that the presence of certain motifs relates to sustained neural activity (Bojanek et al., 2020).
In addition, recent modeling work identified the presence of superhubs—highly connected neurons that drive network activity through feedforward motifs—in epileptic networks (Hadjiabadi et al., 2021). Thus, the reorganization and increase of motif coherence in the T1 subgroup suggest that this subgroup might be expected to experience a change in brain activity, such as synchronization, as well.
The relationship between an increase in motif coherence and synchronization is supported by our predicted functional connectivity analysis in which we found that the T1 subgroup had an increase in predicted functional connectivity relative to both the Control group and the T2 subgroup. This finding corroborates previous analyses that have found severe TBI increases functional connectivity in humans (Hillary et al., 2014; Mayer et al., 2011; Sharp et al., 2011) and rats (Harris et al., 2016b).
This is important given that individuals who sustain a severe TBI are at a 17 times greater risk of developing epilepsy (Annegers et al., 1998), and simulation models of epilepsy have found that focal, secondary, and primary generalized seizure can arise from changes in network architecture (Terry et al., 2012). We might speculate that this subgroup could represent animals that are more likely to go on to develop PTE. However, the animals were not monitored using video-electroencephalogram to assess long-term outcomes, so future work would be needed to test this hypothesis. Despite this limitation, our analysis shows that network measures can be used to identify meaningful differences within a population and offers an insight pertaining to the disease progression for an individual.
In our clustering analysis, we were able to identify two distinct subgroups within the TBI group. While this grouping was driven by motif participation, one can see when examining the columns of Figure 3A that the structural connectivity (Wei), eigenvalue spectrum (EigVal), degree (Deg), and local efficiency (Elocal) result in the same groupings of animals, grouping all animals in the same cluster, with the exception of animal 4. This suggests that a hierarchical structure might also exist in the population, with subsubgroups existing within subgroups. While the current data set is too small to fully examine such possibilities, this will be important to examine in future work with larger populations.
While our work highlights the importance of taking into account population heterogeneity when analyzing brain network data, it also contains several limitations. In this study, in each animal, the same injury was delivered to the same location. Despite this fact, we perhaps surprisingly still see heterogeneity in how the network reorganized post-injury. While in some ways this is a strength of the study because it allows us to examine heterogeneity in a controlled environment, is also raises a question whether the observed changes in structural networks are occurring because this specific type of injury tends to produce certain changes in network structure. This is especially important because human TBI populations have injuries that are more diverse in severity and location.
Despite this challenge, work in humans has found similar changes in a subset of connections in both moderate (Dall'Acqua et al., 2017; Thengone et al., 2016) and moderate-to-severe TBI populations (Solmaz et al., 2017). In addition, subpopulations in human with moderate-to-severe TBI have been found based on changes in structural connectivity (Solmaz et al., 2017). Our analysis broadly reflects what has been found in the human TBI population, but future studies that incorporate different levels of severity and different in injury locations are required to translate our results to humans.
Another limitation of this work pertains to the relationship between structural and functional networks. As we do not have functional imaging data to calculate functional connectivity, in line with previous computational work (Alstott et al., 2009; Honey and Sporns, 2008; Olmi et al., 2019), we took a computational approach and simulated functional connections using the observed structural connectivity. The simulated functional connectivity is derived using path transitivity of the structural connectivity and only approximates observed patterns of resting state functional connectivity.
However, the fact that we observed significant differences in simulated functional connectivity between the T1 and T2 subgroups relative to the Control group remains important as it is not necessarily the case that all changes in network structure would lead to significant changes in path transitivity. This inspires further work to more closely examine heterogeneity in experimentally derived functional connectivity derived from TBI populations.
Because TBI is a complex and heterogeneous disorder, where similar insults can give rise to different behavioral outcomes, it is essential to develop new analytical approaches that are tailored to the heterogeneities present within the data. Most work that searches for biomarkers of PTE looks for correlations between a single observed variable and the development of PTE. However, our findings suggest that future work should examine and embrace heterogeneity within populations to more effectively link specific patterns of brain reorganization to functional outcomes.
Footnotes
Authors' Contributions
J.N. designed the analysis, processed the data, interpreted the data, and wrote/edited the article. M.G. designed the study and acquired data. F.S. processed the data, acquired data, and edited the article. D.P. designed the study, acquired data, and edited the article. S.F.M. designed the analysis, interpreted the data, and wrote/edited the article.
Disclaimer
The content is solely the responsibility of the authors and does not necessarily represent the official views of the NIH or NeuroTrauma Sciences.
Author Disclosure Statement
D.P. is a paid consultant for NeuroTrauma Sciences, who provided funding for this study.
Funding Information
Research reported in this publication was funded, in part, by the National Center for Advancing Translational Sciences of the National Institutes of Health under Award Number UL1TR001412. This study was also funded, in part, by NeuroTrauma Sciences, as part of contract work order through the University at Buffalo, SUNY.
Supplementary Material
Supplementary Figure S1
Supplementary Figure S2
References
Supplementary Material
Please find the following supplemental material available below.
For Open Access articles published under a Creative Commons License, all supplemental material carries the same license as the article it is associated with.
For non-Open Access articles published, all supplemental material carries a non-exclusive license, and permission requests for re-use of supplemental material or any part of supplemental material shall be sent directly to the copyright owner as specified in the copyright notice associated with the article.