
Abstract
Objective:
The irregular growth and proliferation of cells in the brain and skull is named brain tumor, which is a special serious type of tumor due to its location. Nowadays, brain tumor is diagnosed by using imaging techniques such as computed tomography, positron emission tomography, single photon emission computed tomography, infrared imaging, magnetic resonance imaging (MRI), and functional MRI. However, these methods are not affordable to be used as screening tests. In contrast, electroencephalography has the ability of measuring biological signals, and it is a cost-effective and non-dangerous tool, being feasible to be used for screening purposes. The aim of this research was to evaluate the possibility of brain tumor detection, using functional connectivity features extracted from steady-state visually evoked potentials of eight brain tumor patients and four healthy control participants.
Methods:
For this purpose, after preprocessing, phase lag index was calculated as a functional connectivity measure. Afterward, four of the channels were chosen as the selected nodes, based on the highest number of strong connectivity (top 5%) as well as the most significant ones. The selected nodes were O1, O2, P3, and P4. As a final step, node strength was calculated for these selected nodes, which was used to classify the samples in the two groups, using Naïve Bayes, discriminant analysis (DA), k-nearest neighbors, support vector machines, and logistic regression methods.
Results:
The highest accuracy of 89.6% was obtained by using a DA classifier. This result shows that, in fact, brain tumor has the ability of changing brain functional connectivity.
Conclusion:
As the physiological alterations may occur sooner than the anatomical ones in tumor onset, detection of these alterations may be a useful measure for early diagnosis of this disease. This is still a primary study, but with the possibility of leading to further research, which can lead to the development of a method for the screening and early detection of brain tumor.
Impact statement
Imaging modalities are often used to diagnose brain tumors. However, these approaches are cost prohibitive for screening tests. Electroencephalography, a method that measures biological signals from the brain, on the other hand, is cost-effective, non-dangerous, and non-invasive, making it an ideal screening tool. The goal of this study is to analyze whether functional connectivity patterns taken from Steady-State Visually Evoked Potentials may be used to detect brain tumors at early stages. Since physiological changes occur before anatomical ones in tumor development, monitoring these alterations could be a useful tool to screen high-risk individuals, and also to an early diagnosis of the disease.
Introduction
Technology advancements have resulted in several diagnostic procedures that can be used to determine whether a patient has cancer, which are usually associated with advances in cancer biology and medical imaging. Cancer screening is widely recommended, being usually believed that it is risk-free; however, all modern screening tests have a certain associated risk. Indeed, many screening experts believe that a screening test should only be performed when the benefit clearly surpasses the risk (Brawley and Kramer, 2005).
Previous studies have shown that some proteins and genes in the human body have an important role in the proliferation and development of healthy and unhealthy cells, and the incidence of cancer is related to the existence of these proteins and genes (Umbricht et al., 2001). On the other hand, these components affect both the generation and the pattern of action potential by controlling the flow of ions through ion channels. Therefore, this will affect the electrical activity of the body (especially in the brain), which can be recorded by an electroencephalography (EEG).
Previous studies have reported that there is a relationship between brain electrical activity and the presence of some cancer-related genes (Poulos et al., 2009, 2012). As a result, it seems that with appropriate processing algorithms, EEG can be used as a safe and effective cancer detection tool, in addition to its easy accessibility and low cost.
Brain tumor is one of the most dangerous tumors, due to its location. Between 2014 and 2018, the average annual age-adjusted incidence rate of all malignant and non-malignant brain and other central nervous system tumors was 24.25 per 100,000 people, according to the Central Brain Tumor Registry (CBTRUS) (Ostrom et al., 2021). Nowadays, brain tumor is diagnosed by using imaging techniques such as computed tomography (CT), positron emission tomography (PET), single photon emission computed tomography (SPECT), infrared imaging, magnetic resonance imaging (MRI), and functional MRI (fMRI).
However, these methods are too expensive, and consequently not affordable for being used as screening tests. Moreover, CT, PET, and SPECT imaging systems have dangerous radiation that is considered a hazardous imaging modality, especially for children. Also, MRI and fMRI methods can be prohibited in some cases, such as in patients with metal implants and pacemakers. In contrast, using bioelectrical signals in diagnostic applications is less expensive, non-invasive, and safe (Tabanfar et al., 2016, 2018).
Several researchers (Chetty and Venayagamoorthy, 2002; Habl et al., 2000; Handayani et al., 2019; Karameh and Dahleh, 2000; Murugesan and Sukanesh, 2009a, 2009b; Padmapriya et al., 2016; Samant et al., 2012; Selvam and Devi, 2015; Selvam and Shenbagadevi, 2011; Sharanreddy and Kulkarni, 2013; Silipo et al., 1999; Surkar, 2015; Tabanfar et al., 2016, 2017, 2018) have looked at the potential of diagnosing brain cancers by using EEG signals in recent years.
Since all of these studies focused on “brain tumor diagnosis” rather than “screening,” only the local and single channel/component aspects were considered in all of them. There is a growing awareness that cognitive functions rely on network functional integration, rather than functional segregation of brain regions. Consequently, it can be presumed that compensation for disturbed neural functions due to brain tumors is enabled by functional reorganization, which is independent of tumor location. Since the location of the tumor is unknown during the screening, this characteristic appears to be appropriate for periodic screening examinations. Brain tumors can lead to changes in brain functional connectivity, due to the following reasons: - When lesions in the white matter and cortex of the brain disrupt neuronal fibers that connect to other areas, functional connectivity changes in contrast to the normal state. Moreover, the probability of interhemispheric connectivity reduction in the affected hemisphere increases (Harmony et al., 1994; Martino et al., 2011). - Brain is considered a set of organized distributed networks. So, local lesions will disturb the synchronization of the activity between the damaged area and other connected areas, in this interconnected network (Esposito et al., 2012). - When a lesion in the brain occurs, its networks are reorganized through several neuroplasticity processes, leading to the change of function of other areas, to compensate the damage effects (Esposito et al., 2012).
Recent technological developments have demonstrated that brain tumors change components of resting-state and task-related networks (Fox and King, 2018). Two studies showed a reduction of functional connectivity around the tumor (Martino et al., 2011), and increased global connectivity in theta frequency band (Douw et al., 2010), using magnetoencephalography (MEG) signals. Another MEG study (Bartolomei et al., 2006) found that brain tumors cause a loss of functional connectivity, which affects several brain areas, and that left-sided brain tumors show more serious effects in this regard. In Derks and associates (2021), it was shown that patients with glioma have non-local network abnormalities.
Tumors from patients with high global clustering usually have a preferred localization, particularly areas with reduced clustering in controls, indicating that tumor localization is related to network disruption level. The fMRI studies also showed reduced functional connectivity in local (Otten et al., 2012) and global (Esposito et al., 2012) networks in brain tumor patients. These works showed that both local and global functional connectivity patterns are affected by brain tumors.
Vision is an important source of information for humans, incorporating a variety of cognitive functions, including the evaluation of both essential sensory and wider perceptual/cognitive networks. This is due to the fact that successful visual processing requires not only intact retinal projection to the primary visual cortex, but also a globally distributed network spanning from the occipital cortex to higher-level functional areas in the temporal, parietal, and frontal lobes.
These are related to a wide range of functional processes such as visual perception, attention, semantic retrieval, and memory, among others (Goodale and Milner, 1992; Tong, 2003). Recently, the dynamical patterns of functional reorganization in visual processing tasks in brain tumor patients were investigated in Yang and associates (2022). According to their findings, greater cortical responsiveness was discovered be a consequence of the functional compensation in an early processing phase, which was highly restricted to the visual cortex and functional networks, while being less related to tumor position.
Further, their visual task evoked a widespread increase in the whole-brain functional connectivity. Visual evoked potentials necessitate subject training, and the identification of the components in this method needs repetition of the stimulus for the subject. This is not the case of steady-state visually evoked potentials (SSVEPs), which do not require user training or stimulus repetition, and consequently are a more appropriate tool for visual stimulation with a screening purpose.
Flickering visual stimuli are used in the SSVEP paradigm to induce certain patterns, mostly in the brain's visual cortex. Typically, the frequency of the evoked patterns is the same as the frequency of the flickering visual stimulus (Nouri and Azizi, 2020; Tabanfar et al., 2022).
The purpose of this study is to present a methodology for detecting brain tumors by using functional connectivity patterns in the SSVEP task. This approach is designed to be used as a non-invasive screening test for high-risk individuals whose tumor location is unknown. However, in the first step, pilot research toward this low-cost non-invasive screening is required.
Materials and Methods
Participants
For this study, the EEG signal of eight patients with brain tumor (mean age: 39.5 ± 10.46) and four normal participants (mean age: 47 ± 10.55) in Loghman Hakim Hospital was recorded. Based on our prior study (Tabanfar, 2016), the sample size was 4, and the number of participants in the two groups of the current research is larger and equivalent to this amount. The groups did not differ significantly in terms of age, gender, and handedness. The brain tumor in the patient group was diagnosed by a neurosurgeon, and all eight patients had an MRI image in support of their disease. Glioma or meningioma was the tumor type in this study's participants. Because the main goal of this research is screening, the tumor location was not taken into account in our analyses. Table 1 shows the demographics of the patients who took part in this research.
Demographic Information of the Patients
The first criteria for each participant to be included in this research was not suffering from serious mental diseases such as migraine, Alzheimer, acute anxiety, and bipolar disorder. The study protocol was approved by the ethics committee at Tarbiat Modares University (
It has been shown that stress (Shon et al., 2018) and depression (Mohammadi and Moradi, 2021) can alter EEG signals. So, the levels of these two moderator variables were observed by using Hospital Anxiety and Depression Scale (HADS) questionnaire for all 12 participants.
Signal acquisition protocol
The EEG signals were recorded by using 24 channels based on the international 10-20 standard system. The EEG data for all participants were obtained under eye closed condition when a flickering light was positioned in about 20 cm from his/her eyes. Four frequencies of 6, 9, 12, and 15 Hz were presented to the participant, with each one for 12 sec. Because the stimulation time was so short (12 sec per stimulus frequency), no inter-stimulus-interval was taken into account. The recording was unipolar with the reference and ground electrodes placed on the ears.
The participants were asked to relax while they lay down on a bed and not to move as far as possible. The EEG device used was Nihon-Kohden EEG-1200 in Loghman Hakim Hospital. NeuroWorkbench™ software was used in the computer that was linked to the EEG device, helped to see the EEG signal during acquisition and restore it for further analyses.
As some brain tumor patients may experience seizures during the course of their disease, this issue was thoroughly investigated during signal acquisition; as a result, patients were requested to let us know whether they experienced any unpleasant feelings during the recordings. At the hospital EEG center, a neurologist was also present for all of our recordings. In addition, during the recording period, NeuroWorkbench software in the computer that was linked to the EEG device helped to see the EEG signal, allowing us to terminate the recording if an abnormal pattern was observed.
As a result, during our data collection, we did not come across any incidences of seizures in patients. Further, the stimulus frequencies used in this study do not fall within the frequency range of seizures.
Signal processing
Preprocessing
The EEG signals are subject to noise and artifacts. Electrocardiogram (ECG), electrooculogram (EOG), electromyogram (EMG), eye blinks, and the power line noise are the most common. To minimize the EMG effect, all participants were requested to lie on a hospital bed and stop from moving as much as possible throughout the recording, as well as positioning their muscles in the most comfortable and relaxed situation possible.
To reduce the EOG and eye blinks artifact effect, all recordings (for both the healthy and sick groups) were performed with the eyes closed and the flashing light roughly 20 cm from the eyes. To eliminate the remaining effects, several steps such as baseline rejection, re-referencing, and high pass (an elliptic fifth order filter with a cut-off frequency of 1 Hz) and notch (50 Hz) filtering were conducted. All EEG signals were then visually inspected to detect and remove the likely remaining artifacts, including ECG and also non-physiological ones.
Preliminary local analysis of the signal
The canonical correlation feature (which is a standard method in SSVEP studies) was used to compare the performance of brain functional connectivity analysis with the case where only local and single-channel features are taken into account. More details for the canonical correlation analysis (CCA) are available in Chen and associates (2015). In this study, the maximum correlation for each stimulus frequency was used as a feature and calculated as:
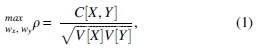
in which X is the EEG signal and Y is the sine and cosine signals with the stimulus frequency and its three harmonics. In the CCA, the WX and WY weight vectors are determined in such a way as to maximize the correlation between x = XTWX and y = YTWY .
Functional connectivity analysis
One of the most common measures of functional connectivity that is less sensitive to volume conduction effect is Phase Lag Index (PLI) (Sakkalis, 2011; Stam et al., 2007). The fact that the existence of a constant non-zero phase difference between two time series cannot be the extended effect of one source is the reason that this measure can be an acceptable estimate of phase synchronization without caring about volume conduction. The PLI can be calculated by using Equation (2):

The PLI values vary between [0, 1] and zero represents zero connectivity, whereas one represents complete phase synchronization.
In this research, PLI was calculated for different possibilities of channel pairs. Since the measurement of the connectivity between any time series pair leads to a non-zero value, only the top 5% of the PLI values were considered in this step as the most consistent connectivity. The channels with the most connectivity with other channels were chosen, and the connectivity between these selected channels was statistically checked to detect significant differences in the connectivity pattern between the two groups (brain tumor vs. healthy control). After that, the channels with the highest number of significant connectivity were chosen as the selected nodes. Then, node strength (si for the ith node) was calculated as a feature for these selected nodes by using Equation (3) (Fornito et al., 2016) and was fed to the classifiers.

where PLIij is the PLI value between node i and j. This procedure is shown in Figure 1.
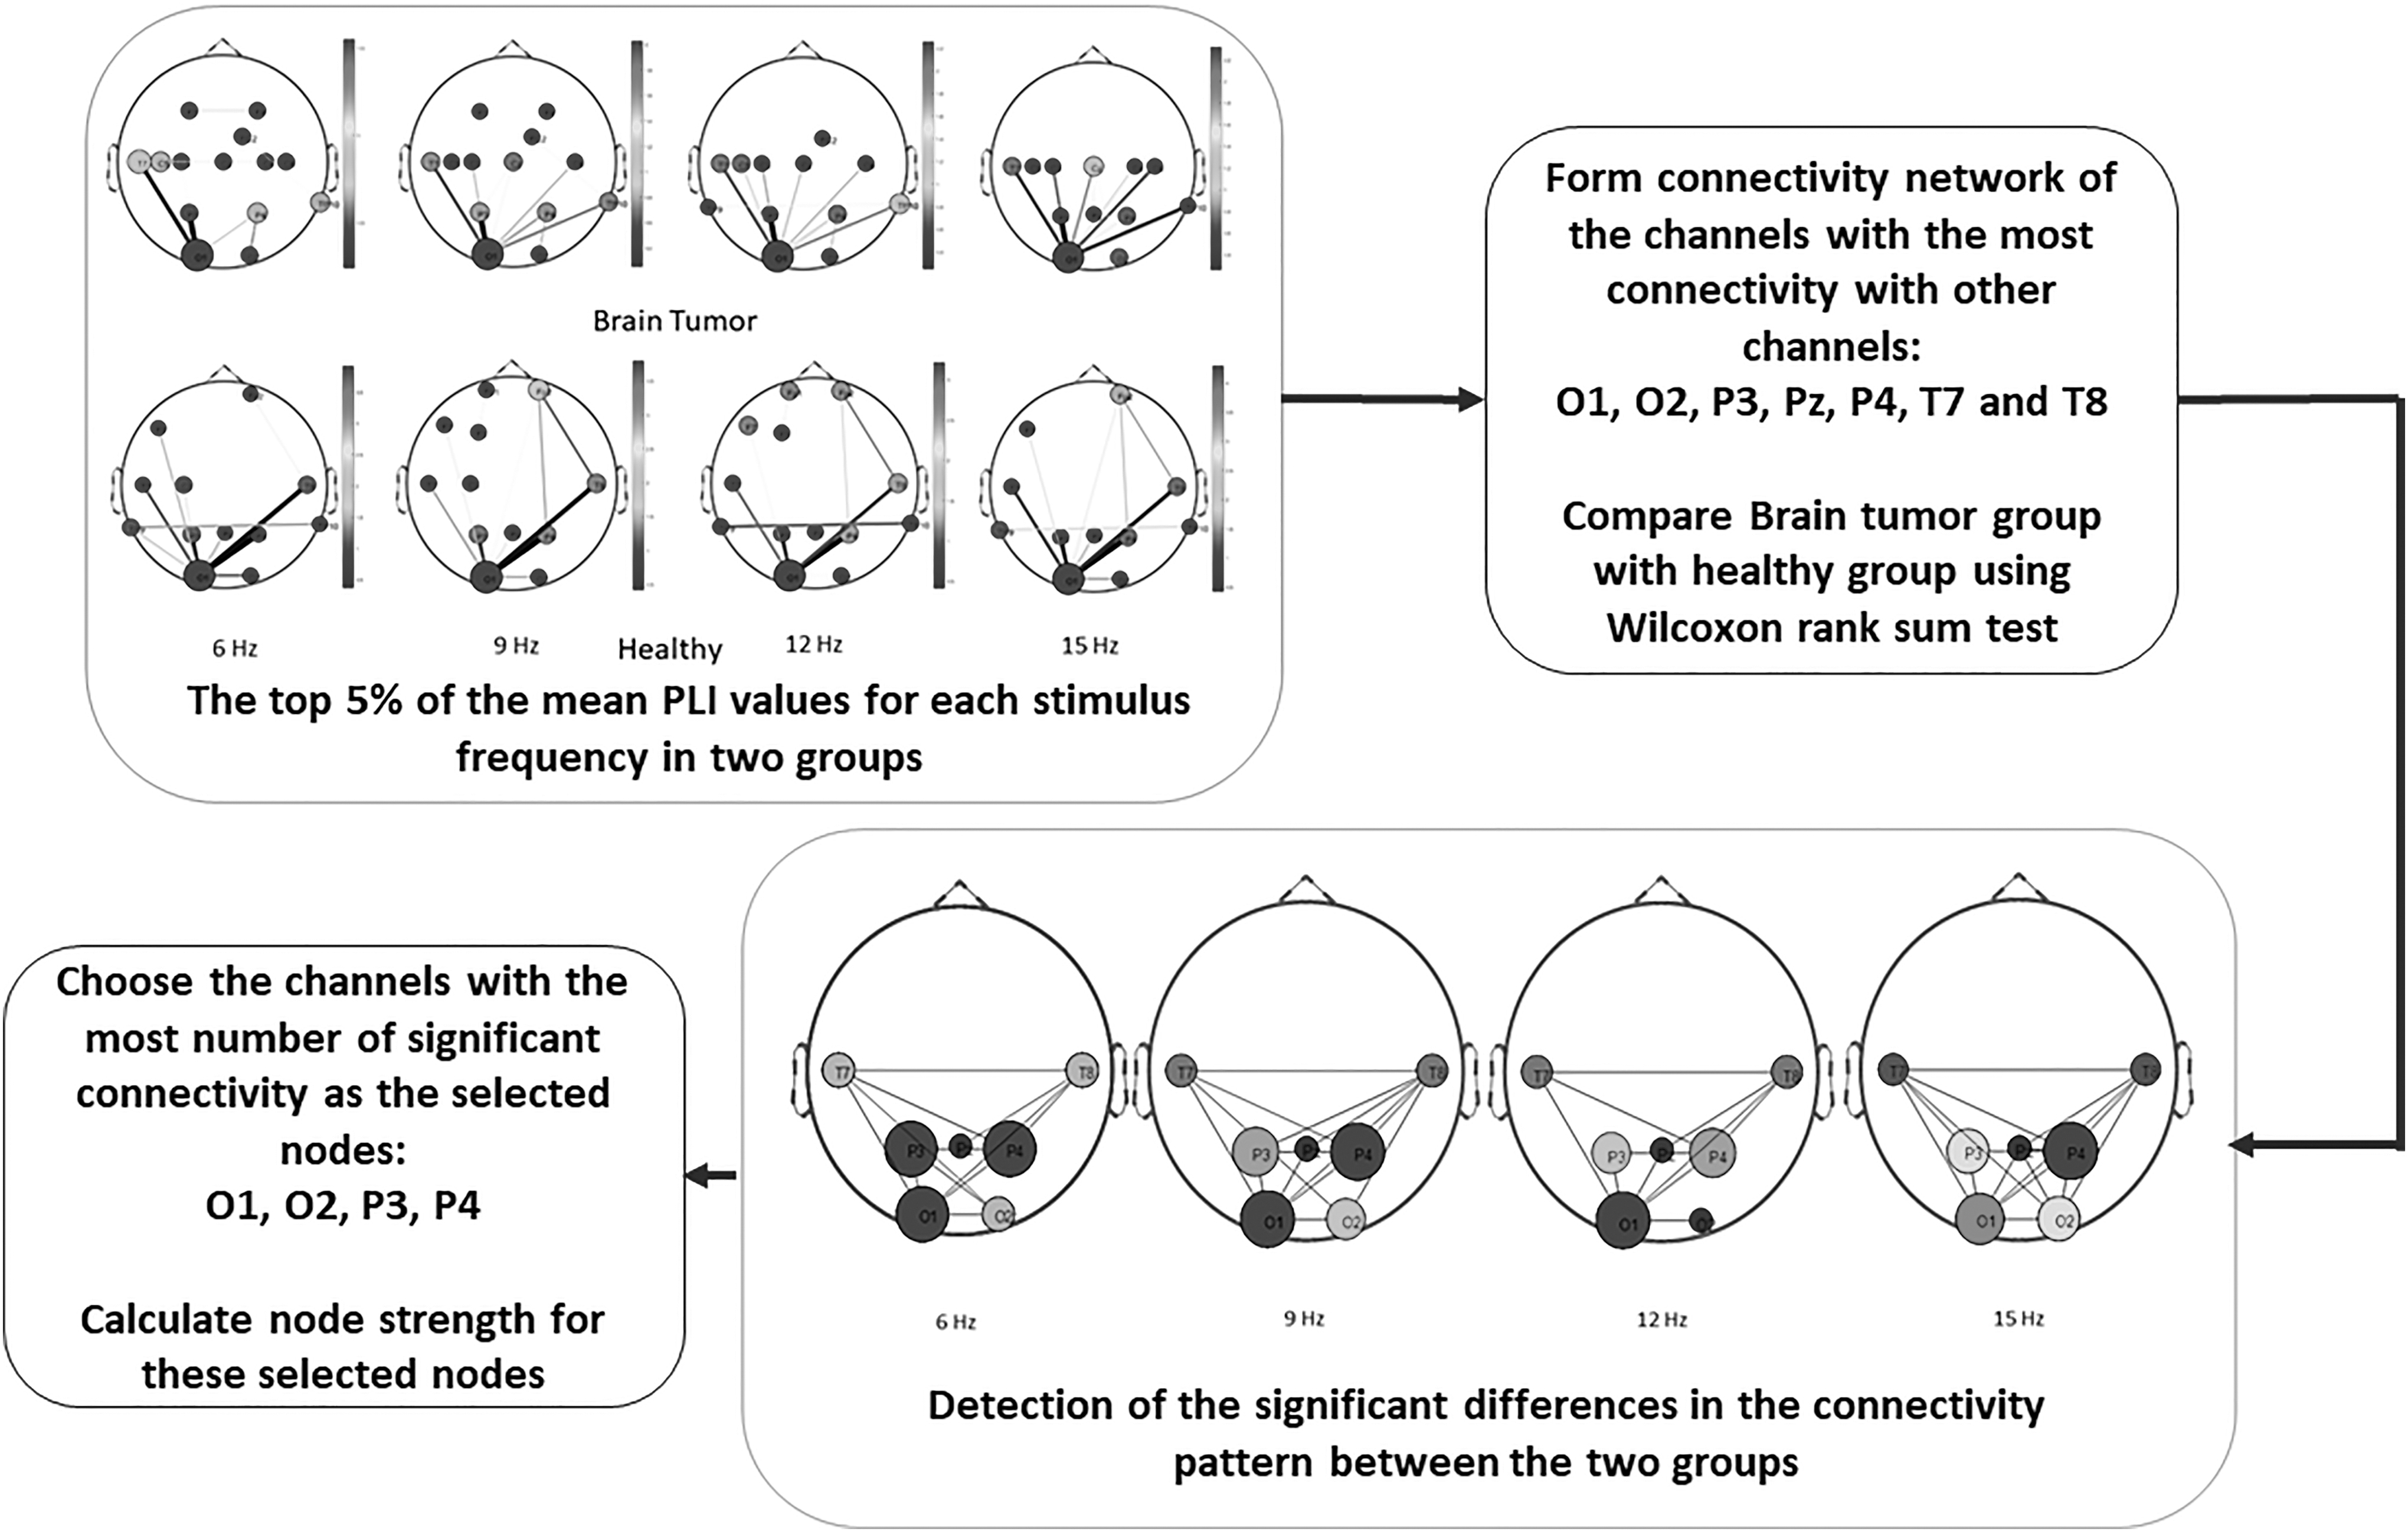
Block diagram of the functional connectivity analysis.
Classification
Many classification and regression models, such as Naïve Bayes (NB), discriminant analysis (DA), K-nearest neighbor (KNN), support vector machine (SVM), and logistic regression (LR), have been proposed in the literature.
The NB classifier is a highly practical Bayesian learning approach. It is based on the simplifying assumption that the attribute values are conditionally independent given target value, and it is best suited when the inputs have a high dimensionality. Despite its simplicity, NB classification algorithms frequently outperform more complicated classification approaches (Islam et al., 2007).
The DA classifier is one of the most fundamental and uncomplicated classifiers. Linear discriminant analysis and quadratic discriminant analysis classifiers are the two forms of DA classifiers (Tharwat, 2016).
The KNNs rule, among the different approaches of supervised statistical pattern recognition, regularly produces good performance without making a priori assumptions about the distributions from which the training examples are obtained. It entails a set of classes for training. The sign of the majority is assigned to a new sample by taking the k closest points (Islam et al., 2007).
The SVM is a powerful classification technique that uses one or more feature vectors to predict labels and construct a decision boundary between two classes. The resulting hyperplane, or decision boundary, is oriented to be as far away from each of the classes’ nearest data points (support vectors) as possible (Huang et al., 2018).
The LR is a regression model that generates a model to estimate the likelihood of a given data entry belonging to each of the classes. The LR models the data by using the S-shaped sigmoid function. Utilizing a set of independent variables, this method is used to predict a categorical dependent variable (Dreiseitl and Ohno-Machado, 2002).
The aforementioned algorithms were used in this study to identify brain tumor by using functional connectivity patterns.
Results
Eight patients suffering from brain tumor and four healthy control ones participated in this study. At first, the individual characteristics such as age, body mass index, and HADS grades were observed statistically by using SPSS 16.0. According to the results, there were no significant differences in these characteristics between two groups (p-value >0.05). Then, PLI was calculated for all preprocessed segmented signals (1-sec segments) by using MATLAB 2017a. As there were 12 sec of signal per stimulus frequency, each participant had a total number of 48 (12 segments × 4 stimulus frequencies) segments of signal.
Preliminary local analysis of the signal
To have a comparison between local (single channel) analysis and global (functional connectivity) analysis, at first, canonical correlations between the signal in each stimulus frequency with the sine and cosine signals with the same frequency were calculated for each segment (1-sec segments) of the signal. Afterward, the two groups were classified by using the canonical correlations, with five different classifiers of NB, DA, KNN, SVM, and LR. For evaluation of these classifiers, the cross-validation method (k = 5) was utilized. The results of the classifications are shown in Table 2.
Results of the Five Classification Methods, Local Analysis
DA, discriminant analysis; KNN, K-nearest neighbor; LR, logistic regression; NB, Naïve Bayes; SSVEP, steady-state visually evoked potential; SVM, support vector machine.
As can be seen in Table 2, the classification accuracies are near to the chance level (there were eight brain tumor patients and four healthy control ones, which leads to a 66.67% chance level).
Functional connectivity analysis
In this step, all the EEG signals were divided to 1-sec segments. Then, the PLI values were calculated between all possibilities of channel pairs, which leads to a 22 × 22 matrix for each segment. Afterward, the top 5% of the mean PLI values (the strongest connectivity) of each group were observed on a scalp map for each stimulus frequency (Fig. 2). In Figure 2, the greater the number of connectivity each channel has, it is shown in a bigger circle and with a darker color. The color of the channels shows the channel strength.

The top 5% of the mean PLI values (the strongest connectivity) of each group for each stimulus frequency (total mean ± standard deviation in the captions). The higher the number of connectivity each channel has, it is shown in a bigger circle and with darker color. PLI, Phase Lag Index.
It is seen in Figure 2 that the channels O1, O2, P3, Pz, P4, T7, and T8 are present in the top 5% of the two groups in most stimulus frequencies. This result is in line with the physiological fact that the visual stimulation induces activity mostly in occipital and parietal lobes (visual cortex) (Nouri and Azizi, 2020). At this stage, the connectivity between these selected channels (7 × 7 matrices) was statistically analyzed to detect significant differences in the connectivity pattern between the two groups (brain tumor vs. healthy control).
According to the non-normal distribution of the data, Wilcoxon rank-sum test was used for this analysis. The resultant significant connectivity (p-value <0.05) is shown in Figure 3. It can be observed in Figure 3 that the channels O1, O2, P3, and P4 are the channels with the highest number of significant connectivity. These channels are labeled as the selected nodes. Then, using Equation (3), node strength was calculated for these selected nodes.
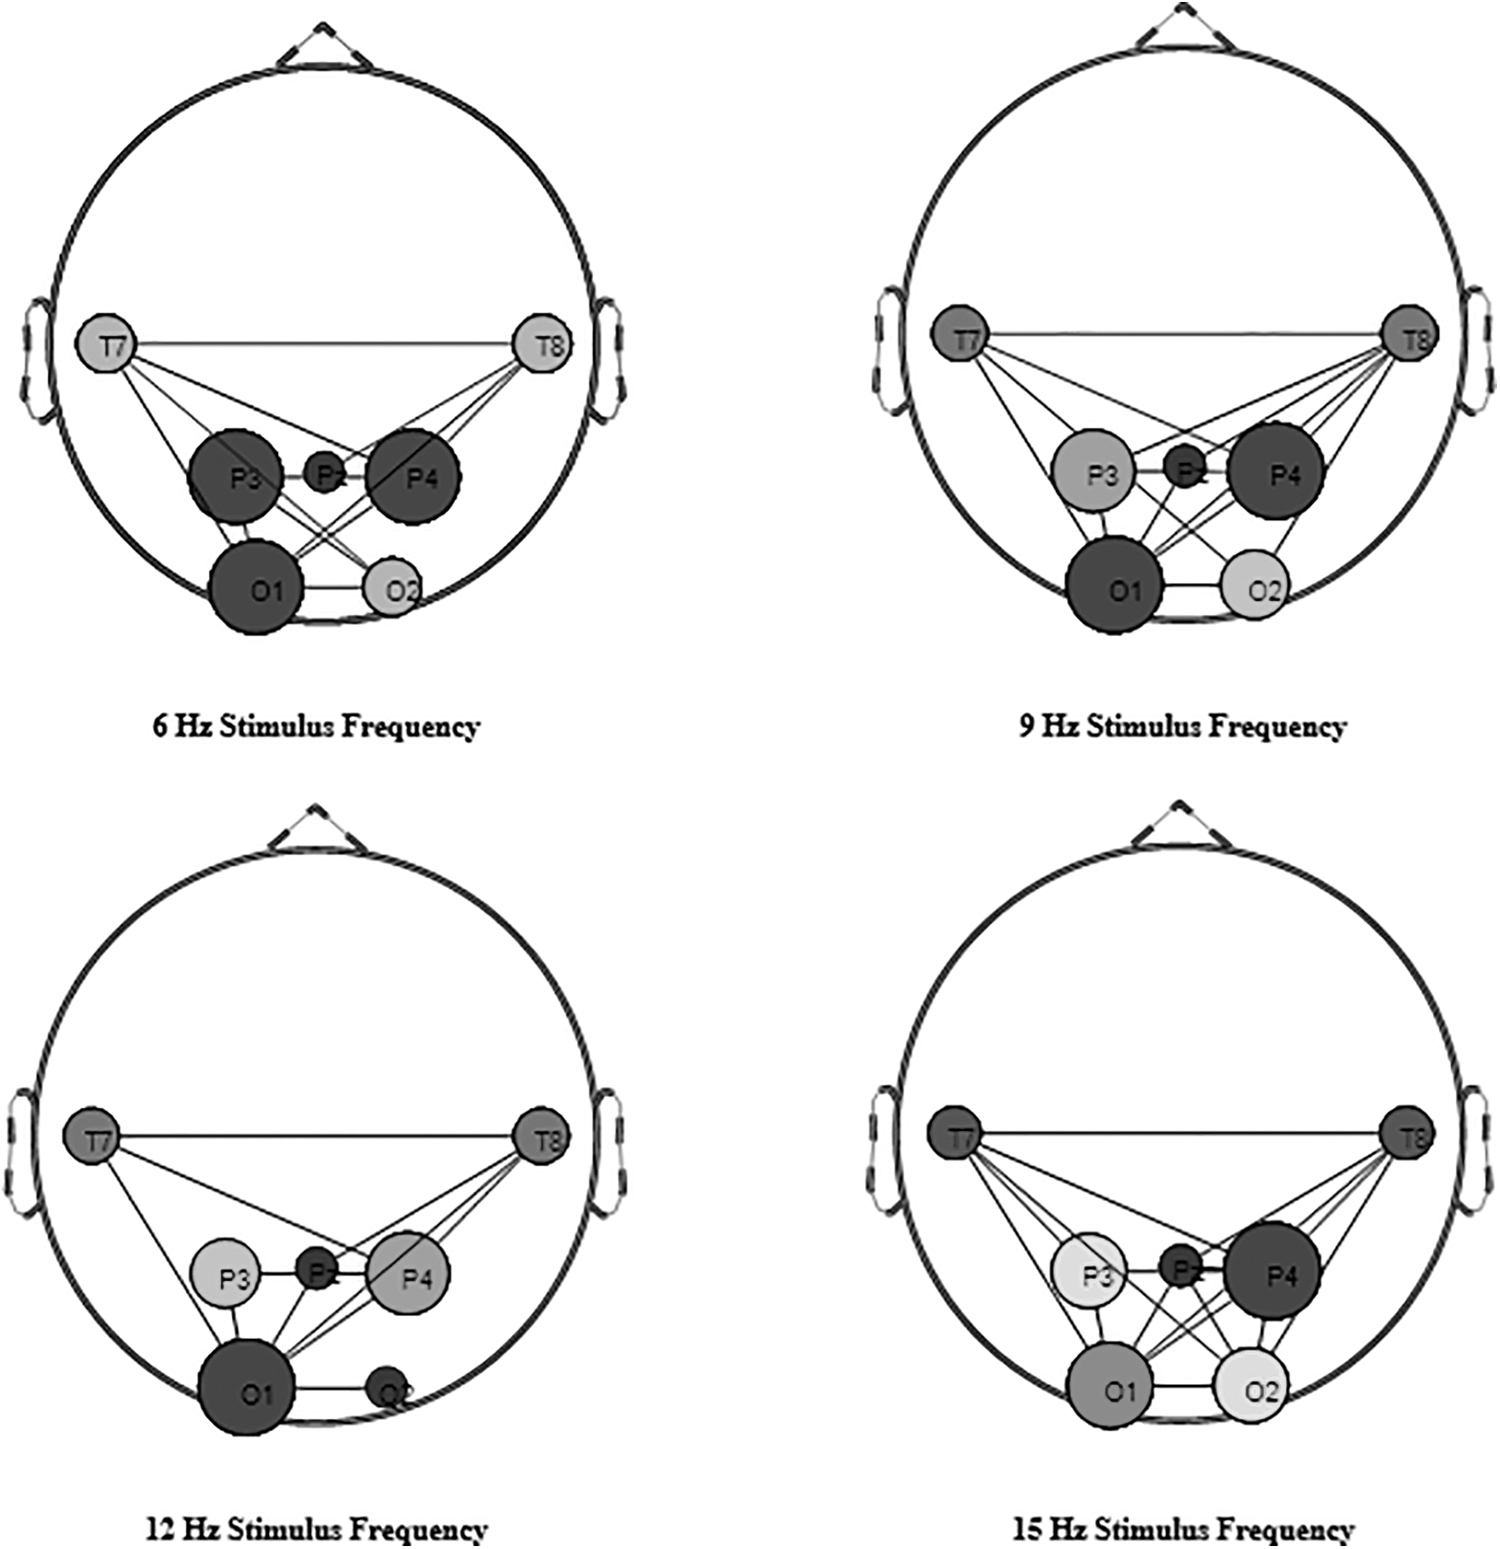
The connectivity among the seven selected channels that are significantly different (p-value <0.05) between the two groups (brain tumor vs. healthy control). The more significant connectivity each channel has, it is shown in a bigger circle and with darker color.
Classification
In this stage, the two groups were classified based on the O1, O2, P3, and P4 nodes’ strength, with five different classifiers of NB, DA, KNN, SVM, and LR. For evaluation of these classifiers, the cross-validation method (k = 5) was utilized. The results of the classifications are shown in Table 3.
Results of the Five Classification Methods, Global Analysis
PLI, Phase Lag Index.
As seen in Table 3, using the functional connectivity measure (global analysis) enhances the performance of brain tumor detection.
Conclusion and Discussion
The aim of this research was to evaluate the possibility of using EEG functional connectivity measures for brain tumor screening. To achieve this goal, PLI of different channel pairs were extracted from preprocessed SSVEP signals with four stimulus frequencies of eight brain tumor patients and four healthy participants. Initially, it was observed that in the top 5% of the strongest connectivity in two groups, the channels O1, O2, P3, Pz, P4, T7, and T8 were present in the majority of the stimulus frequencies.
The process by which the brain network changes as a result of a lesion (including tumor) is known as neuroplasticity. Because visual stimulation stimulates activity primarily in the occipital and parietal lobes (visual cortex) (Nouri and Azizi, 2020; Tabanfar et al., 2022), in this study, visual cortical stimulation (SSVEP) was expected to cause changes in the visual processing network. Afterward, four channels were chosen as the selected nodes, based on the highest number of strong connectivity (top 5%) as well as the most significant ones.
The selected nodes were O1, O2, P3, and P4. Then, node strength was calculated for the selected nodes, to classify the two groups by using NB, DA, KNNs, SVMs, and LR methods. The highest accuracy (89.6%) was obtained by using the DA classifier, which shows an acceptable performance of this method in comparison with the local analysis (maximum accuracy of 77.79% when using canonical correlations as features).
The data points in the DA classifier are assumed to have the same covariance, and the probability density is assumed to be normally distributed. As a result, in the case of normal data distribution, using DA allows for the use of a priori knowledge and possibly better classification. Most feature distributions in this study were quite close to normal. This could explain why this classifier performed better in this study. In addition, optimization techniques were used in this research to fine-tune the classifiers parameters.
However, optimization strategies can sometimes produce suboptimal results. Because the obtained results for the various classifiers are so close, there may be no difference in their functioning, and by modifying these parameters, one may obtain results that are close but in a different order.
As seen in Figure 2, healthy individuals, at most of the stimulus frequencies, have their top 5% of the connectivity as the connectivity of the occipital to the parietal areas, or the connectivity of the occipital and parietal areas (visual cortex) to the frontal areas. It has been also shown in Li and colleagues (2015) that an 8 Hz stimulus can lead to an enhanced linkage strength between the frontal and visual cortex. Moreover, in Ding and associates (2006), it has been shown that a different frequency stimulus can induce different networks activities between various brain lobes, such as occipital, frontal, and parietal.
In Figure 2, it is possible to see that brain tumor patients, at most of the stimulus frequencies, have their top 5% of the connectivity as the connectivity of the occipital to the parietal areas, and the connectivity of the occipital and parietal areas (visual cortex) to the central areas. These results show that brain functional connectivity is altered in the presence of brain tumor. This may occur because of the existence of destroyed tissue around the tumor, and consequently the modification of the neural connections. Another reason that may lead to this effect may be the change in cells’ ionic channels, as well as the membrane depolarization in the affected cells, which may change the current flow and consequently brain functional connectivity.
As the physiological alterations may occur sooner than the anatomical ones in tumor onset, detection of these alterations may be a useful measure for early diagnosis of this disease. This is still a primary study, which may be the beginning of other works, and lead to the development of a method widely used for the screening and early detection of brain tumor.
Footnotes
Authors’ Contributions
Z.T.: Conceptualization, methodology, software, writing, visualization, and investigation. M.F. and Z.S.: Supervision, methodology, validation, reviewing, and editing. G.S.: medical advisor, data acquisition supervision, reviewing, and editing.
Author Disclosure Statement
No competing financial interests exist.
Funding Information
No funding was received for this article.