
Abstract
Introduction:
The concept of local sleep refers to the phenomenon of local brain activity that modifies neural networks during unresponsive global sleep. Such network rewiring may differ across spatial scales; however, the global and local alterations in brain systems remain elusive in human sleep.
Materials and Methods:
We examined cross-scale changes of brain networks in sleep. Functional magnetic resonance imaging data were acquired from 28 healthy participants during nocturnal sleep. We adopted both metrics of connectivity (functional connectivity [FC] and regional homogeneity [ReHo]) and complexity (multiscale entropy) to explore the global and local functionality of the neural assembly across nonrapid eye movement sleep stages.
Results:
Long-range FC decreased with sleep depth, whereas local ReHo peaked at the N2 stage and reached its lowest level at the N3 stage. Entropy exhibited a general decline at the local scale (Scale 1) as sleep deepened, whereas the coarse-scale entropy (Scale 3) was consistent across stages.
Discussion:
The negative correlation between Scale-1 entropy and ReHo reflects the enhanced signal regularity and synchronization in sleep, identifying the information exchange at the local scale. The N2 stage showed a distinctive pattern toward local information processing with scrambled long-distance information exchange, indicating a specific time window for network reorganization. Collectively, the multidimensional metrics indicated an imbalanced global–local relationship among brain functional networks across sleep–wake stages.
Impact statement
Brain connectivity metrics and multiscale entropy were adopted to examine network-specific patterns throughout the sleep–wake cycle and the local–global balance in brain circuits. The distinct patterns of the cross-scale metrics among sleep-related resting-state networks reflected nonuniform brain activation, supporting the concept of local sleep. The imbalance of global–local relationships reflected by multiscale functional metrics suggests changes in regulation across sleep–wake stages.
Introduction
The sleep–wake transition is regarded as a biphasic switch for the unresponsive behavior of humans during sleep (Song and Tagliazucchi, 2020; Tononi and Cirelli, 2014). However, since the 1990s, neuroimaging findings have indicated that human sleep is a dynamic process involving brain functional integration that varies across spatial and temporal scales and deviates from an exclusive state of wakefulness. For example, slow waves progressively transition from the frontocentral to the posterior brain during the deep sleep stage (Finelli et al., 2001; Werth et al., 1997). Positron emission tomography (PET) findings revealed the regional reactivation of emotional and sensory systems during rapid-eye-movement (REM) sleep (Braun et al., 1997).
Furthermore, functional magnetic resonance imaging (fMRI) findings demonstrated disrupted network synchrony associated with a decreased consciousness level during non-REM (NREM) sleep (Horovitz et al., 2009; Sämann et al., 2011). In addition to the overall reduction of brain activity during sleep, the local neural activities in various distributed brain regions may serve as crucial indicators of enhanced cognitive engagement before sleep (Hung et al., 2013; Konadhode et al., 2016; Mukhametov, 1987; Rasch and Born, 2007, 2013; Vyazovskiy et al., 2011). This concept of local sleep has been reported on the basis of sustained vigilance observed in marine mammals (Konadhode et al., 2016; Mukhametov, 1987), and use-dependent memory formation in rodent (Vyazovskiy et al., 2011) and human sleep (Hung et al., 2013; Rasch and Born, 2007, 2013). In other words, functional specificity in the sleeping brain can be reflected by the dynamicity of local brain activity or local neural synchrony.
However, previous sleep neuroimaging studies focused on consistent changes in whole-brain or network-specific connectivity across NREM sleep stages (Horovitz et al., 2009; Sämann et al., 2011; Spoormaker et al., 2010; Wu et al., 2012), which targets on long-distance synchronizations instead of local functionality. The high consistency of cross-network changes across NREM sleep stages might not reveal the functional specificity indicative of local sleep in the human brain. To date, the long-distance (distributed) and local features of brain functions in human sleep remain elusive in board concept. Therefore, we investigated the local functionality of the sleeping brain based on multiple neuroimaging metrics across sleep stages. Specifically, we examined functional changes from the global to local scales. We utilized two common metrics—connectivity and entropy—to explore the cross-scale functionality of the neural assembly during sleep.
Functional connectivity (FC) refers to the integration of distributed brain areas through temporal similarity (Friston, 2011). Compared with the invasive measures of neural synchrony at the local scale, noninvasive fMRI evaluation of resting-state FC changes is more feasible and applicable for mapping the human brain during sleep. The general consensus reported that the FC strength (FCS) of between and within specific brain networks decreases during sleep (Larson-Prior et al., 2009; Wu et al., 2012), particularly in the default mode network (DMN) that is further disrupted during deep sleep (Horovitz et al., 2009; Sämann et al., 2011).
Although the decrease in within-network FC during sleep appeared to be a general phenomenon across networks, the distinguished pattern of regional interactions was found among sleep stages (Song and Tagliazucchi, 2020). For example, small-world networks in the brain are randomly organized during light sleep but move toward regularity during slow wave sleep (SWS) (Spoormaker et al., 2010).
Studies have not examined local specificity in the human sleeping brain. Electrophysiology studies have shown that the local scale of neural synchrony spans 2–10 mm, in which interneurons are clustered and exhibit a common resonance mode (Gray, 1999). Individuals with sleep deprivation exhibit elevated regional homogeneity (ReHo), an intraregional metric of similarities within a set of the nearest neighbors at a voxel-wise millimeter scale can reflect local neural synchrony (Zang et al., 2004), indicating that ReHo can be a voxel-wise metric for identifying hyperarousal (Kay and Buysse, 2017). To date, the cross-scale metric from the ReHo to FC has not been compared mutually in the sleeping human brain.
Our previous findings (Kung et al., 2019) indicated that FC is spatially disrupted during NREM sleep with increased between-network connections; however, local synchrony remains consistent or even increases. Therefore, we hypothesize a functional distinction between global FC and local ReHo across sleep stages. The pattern of resting-state brain activity identified using ReHo was similar to that reported in the previous PET study (Aiello et al., 2015), indicating that ReHo can be used for investigating human brain activity across sleep stages and may reveal the complexity of human brain.
Entropy, which indicates differences in neurophysiological complexity across NREM sleep stages, is the second metric we used to explore cross-scale brain dynamics during sleep. Electroencephalography (EEG) signal entropy significantly decreases with sleep deepening (Bruce et al., 2009; Janjarasjitt et al., 2008) and was characterized for automated sleep staging (Nicolaou and Georgiou, 2011; Rodríguez-Sotelo et al., 2014). In the fMRI analysis, the mean and variability of dynamic signal complexity decrease in SWS (Deco et al., 2017). Moreover, the dynamicity in FC changes during NREM sleep (Tarun et al., 2021), with high variance both within and between networks, reflects local and global information, respectively (Kung et al., 2019). Thus, the qualitative shifts in mental states can be linked to the degree of irregularity of neuronal activity.
Multiscale entropy (MSE) is a quantitative measure of complexity (Costa et al., 2002, 2005) that considers the entropy (Richman and Moorman, 2000) over multiple timescales inherent in time-varying physiological signals. Different timescales are associated with distinct complexity levels: fine timescales measure signal complexity for local information processing, whereas coarse timescales measure that for distributed information processing (McIntosh et al., 2014; Mizuno et al., 2010; Vakorin et al., 2011). Therefore, MSE enables the estimation of short- and long-range neural fluctuations through the use of fine and coarse timescales, respectively. High entropy during wakefulness was reported only at a fine timescale, whereas high entropy during deep sleep was observed at a coarse timescale (Miskovic et al., 2019).
Although MSE has been used to evaluate complexity in the fMRI of patients with healthy aging (Siero et al., 2014; Yang et al., 2013) and psychosis (Hager et al., 2017; Yang et al., 2015), it has not been applied to fMRI signals across sleep stages. On the basis of the regulation of neural synchronization theory (McDonough and Nashiro, 2014), we hypothesized that fine-scale entropy would decrease, implying increased local connectivity, with deeper sleep stages, whereas coarse-scale entropy would increase reflecting the spatially distributed communications.
We explored the cross-scale metrics, from connectivity to entropy, to disclose the altered brain functionality in sleeping brain. We evaluated NREM sleep alterations across local and global scales in connectivity (ReHo and FC) and entropy (fine and coarse scales). Because multiscale metrics were first introduced to examine the sleeping human brain, we empirically explored the relationships among four metrics by using a natural sleep data set. Cross-scale comparisons of the human brain were performed for both the Awake and Sleep conditions. We hypothesize that sleep regulates the brain network differently at various spatial scales, resulting in gradients of consciousness loss across NREM stages.
Thus, we conjecture that ReHo increases during the N2 sleep with enhanced local synchronization, and ReHo decreases during N3 sleep, involving regional idling as overall inactivity—a pattern unlike that of FC, which decreases gradually with sleep depth. In addition, we postulated that entropy at the fine scale (local metric) reflects ReHo changes, whereas entropy at the coarse scale (global metric) reflects FC in human sleep. Finally, we evaluated associations among metrics in the Sleep and Awake states to determine the relationships of the metrics with decreased consciousness throughout sleep.
Materials and Methods
Participants and data acquisition
We recruited 44 healthy young (age = 24.9 ± 3.9 years) male participants to sleep naturally in an MRI scanner at the National Yang Ming Chiao Tung University and collected data during NREM sleep (after sleep scoring; see sleep architecture in Supplementary Table S1) from 28 of the 44 participants. All the participants were instructed to sleep for a regular duration of 7–8 h per night with consistent sleep and wake times for at least 4 days. Each participant provided informed consent in accordance with the protocol approved by the Institutional Review Board of Taipei Medical University (TMU-JIRB N201903149).
For each functional scan, we applied simultaneous EEG–fMRI recordings with an MR-compatible EEG system (Brain Products GmbH, Gilching, Germany) and 3T Siemens Tim Trio MRI system (Erlangen, Germany) (the acquisition detail is in Supplementary Data S1). Participants were asked to fall asleep after the scan started. Termination criteria for the sleep session were as follows: (1) a scan time that reached the 125-min limitation for maintaining hardware stability and (2) a participant being unable to fall asleep for an extended period and choosing to terminate the session. The detailed information of the experiment procedure and the data acquisition has been listed in the previous study (Kung et al., 2019). The data sets for this study are available on request to the corresponding author.
Data preprocessing
Analyzer 2.0 (Brain Products, Germany) was used to preprocess the recorded EEG data offline. The preprocessing included downsampling the EEG signal to 250 Hz and removing the gradient-induced artifact (adaptive average subtraction) and the ballistocardiographic artifact (ECG-based estimation of the R–R interval). The EEG signals were rereferenced to the averaged signal of all the EEG electrodes (Lei and Liao, 2017). The sleep stages were determined by the data from C3, C4, O1, and O2.
The resting-stage data acquired before each sleep session were regarded as wakefulness (N0). A licensed sleep technician from Kaohsiung Medical University Hospital visually scored the sleep stages (N1, N2, N3, and REM) from the EEG data for every 30-sec epoch, according to the American Academy of Sleep Medicine criteria (Iber et al., 2007). Based on the sleep scoring, we extracted consecutive fMRI data for each wake–sleep stage in each participant.
All the image data were preprocessed by AFNI (Cox, 1996), FSL (Jenkinson and Beckmann, 2012), and statistical parametric mapping (SPM). The data with excessive motion (translation >3 mm, rotation >3°, and a mean frame displacement [FD] >0.5 mm) were excluded. The functional data sets performed the retrospective image correction for physiological motion effects (Glover et al., 2000) whenever applicable. Then, all functional data sets were subjected to motion correction with the Friston 24-parameter model (Friston et al., 1996), skull-stripping, slice-timing, and despiking. Native fMRI images were registered to the T1-weighted image and segmented into white matter (WM), gray matter, and cerebrospinal fluid (CSF) using SPM. A linear detrend was applied to eliminate any signal drift induced by system instability.
The effects of nuisance regressors, including the Friston 24-parameter model (6 motion parameters, 6 motion deviate parameters, and 12 corresponding squared terms), respiration/cardiac pulsations, WM, and CSF, were removed from the preprocessed data sets using AFNI. The physiological measurement unit data points within each repetition time were averaged for physiological denoising. The preprocessed data were temporally bandpass filtered between 0.01 and 0.1 Hz and smoothed with a Gaussian kernel (FWHM = 6 mm) to improve the signal-to-noise ratio. The fMRI data sets were spatially normalized to a standard template in the standard Montreal Neurological Institute (MNI) space and resampled to an isotropic resolution of 2 × 2 × 2 mm3. In addition, the preprocessing procedure was selective for accurate calculation of functional metrics.
Global and local functional metrics
Functional metrics were obtained using resting-state network (RSN)-based region of interest (ROI) parcellations (Seitzman et al., 2020). The 300-ROI set included cortical, subcortical, and cerebellar structures with 14 predefined RSN parcellations. We excluded 27 ROIs located in the cerebellum and 12 ROIs belonging to an unassigned network. In this study, we focused on four specific RSNs, the DMN, dorsal attention network (DAN), and cingulo-opercular network (CON), which contribute to sleep and consciousness, and the medial temporal lobe (MTL) relates to memory function that contributes to local sleep.
Regional homogeneity
ReHo reflects the similarity of time series within a given voxel and its nearest neighbors based on Kendall's coefficient of concordance (Kendall and Gibbons, 1990; Zang et al., 2004):
ReHo describes intraregional communication and provides information regarding local connectivity. Whole-brain ReHo was calculated in a given voxel within a seven-sided cluster (Taylor and Saad, 2013) from preprocessed fMRI data without smoothing in the individual space (Jiang and Zuo, 2016), and then, the map was normalized to the MNI space. ReHo was Z-transformed and averaged on the ROI level for the subsequent statistical analysis.
Functional connectivity
Regional interaction was measured using the FC of the preprocessed data set in the MNI space. The blood oxygen level dependent (BOLD) time series of all voxels within each ROI were averaged and computed with Pearson's correlation between ROI pairs as FC. The FCS was summed up as the Z-transformed connection (correlation coefficients) for each pairwise ROI (McDonough and Nashiro, 2014; Wang et al., 2018).
Multiscale entropy
MSE describes signal information regarding regional complexity at the fine scale (local metric) and the coarse scale (global metric). Sample entropy (SampEn) was utilized for MSE analysis because of its high consistency and low dependency on signal length (Richman and Moorman, 2000). MSE was measured (Costa et al., 2002, 2005) using a coarse-graining procedure: (1) coarse-grained time series with various scale factors were constructed by averaging signal points, and (2) SampEn was quantified for fine-scale and each coarse-grained time series. Specifically, SampEn was defined as the negative natural logarithm of the conditional probability where a data set of length N within a tolerance of r (similarity factor) for m points (pattern length) repeats itself for m + 1 points without allowing self-matches (Richman and Moorman, 2000).
To calculate MSE by using short data length, the parameters of m = 1, r = 0.35, and a scale factor of up to 3 were used (Yang et al., 2013, 2015, 2018).
Statistical analysis
Since not all participants had intact sleep stages that contained the N1, N2, and N3 stages (Supplementary Table S1), we used linear mixed effects (LME) that modeled the within-subject variance to handle missing data. The fixed effect of the LME model included sleep stages, and the random effect was set as the individual variability. We compared the averaged FCS, ReHo, and MSE of ROIs within each RSN among the sleep stages of the unbalanced longitudinal samples. Post hoc analyses were applied on each functional index to examine the difference between sleep stages.
Statistical comparison with family-wise error (FWE) correction was performed on Fisher's Z-transformed FC using network-based R-statistics (NBR) (Gracia-Tabuenca and Alcauter, 2020), an R-package that extends the network-based statistic (Zalesky et al., 2010) framework by adding LME models. NBR was utilized to analyze the connection of the entire brain network (33,930 connections) with LME, which FWE-corrected for the clusters of connected connections, with p-value below 0.05 with 1000 permutations of original data.
The correlation analysis was performed among these functional indices. Each functional index was averaged within the ROIs of the same RSN. Then, Pearson's correlation coefficient was calculated in a pairwise manner between two functional indices. We further applied the false discovery rate (FDR) correction for the correlations in each RSN for multiple comparisons.
Results
Stage-dependent alterations in FC and ReHo
ReHo significantly differed (p < 0.05, FDR corrected) across sleep stages in all of the RSNs except for the MTL (Table 1 and Fig. 1). ReHo peaked during N2 sleep in the CON, DMN, and DAN and was at its lowest level during N3 sleep in these RSNs (Table 1 and Fig. 1).

Stage comparisons of ReHo in
Resting-State Network-Based Regional Homogeneity in Wake–Sleep Stages
The statistical comparison of ReHo among stages was conducted with LME.
FDR, false discovery rate; LME, linear mixed effects; ReHo, regional homogeneity.
FCS significantly differed among sleep stages in the CON (p = 0.04, FDR corrected), DAN (p = 0.04, FDR corrected), and MTL (p = 0.03, FDR corrected), which reached their minimal FCS during N3 sleep (Supplementary Table S2). Compared with the Awake state, distributed FC decreased and increased in different networks during sleep (Fig. 2 and Supplementary Fig. S2). The number of FC that significantly deviated from Awake state (FCsig) was increased with sleep depth. In each sleep stage, we calculated the FCsig proportion among between- and within-RSNs and found similar percentages (N1: 4.9% and 2.7%, N2: 12.6% and 15.0%, and N3: 24.2% and 24.1%, respectively) of FCS.

Percentage of between- and within-network FC was significantly higher (green/red) and lower (grass green/orange), respectively, during NREM sleep stage than during wakefulness. FC, functional connectivity; NREM, nonrapid-eye-movement.
RSN-based MSE alterations across sleep stages
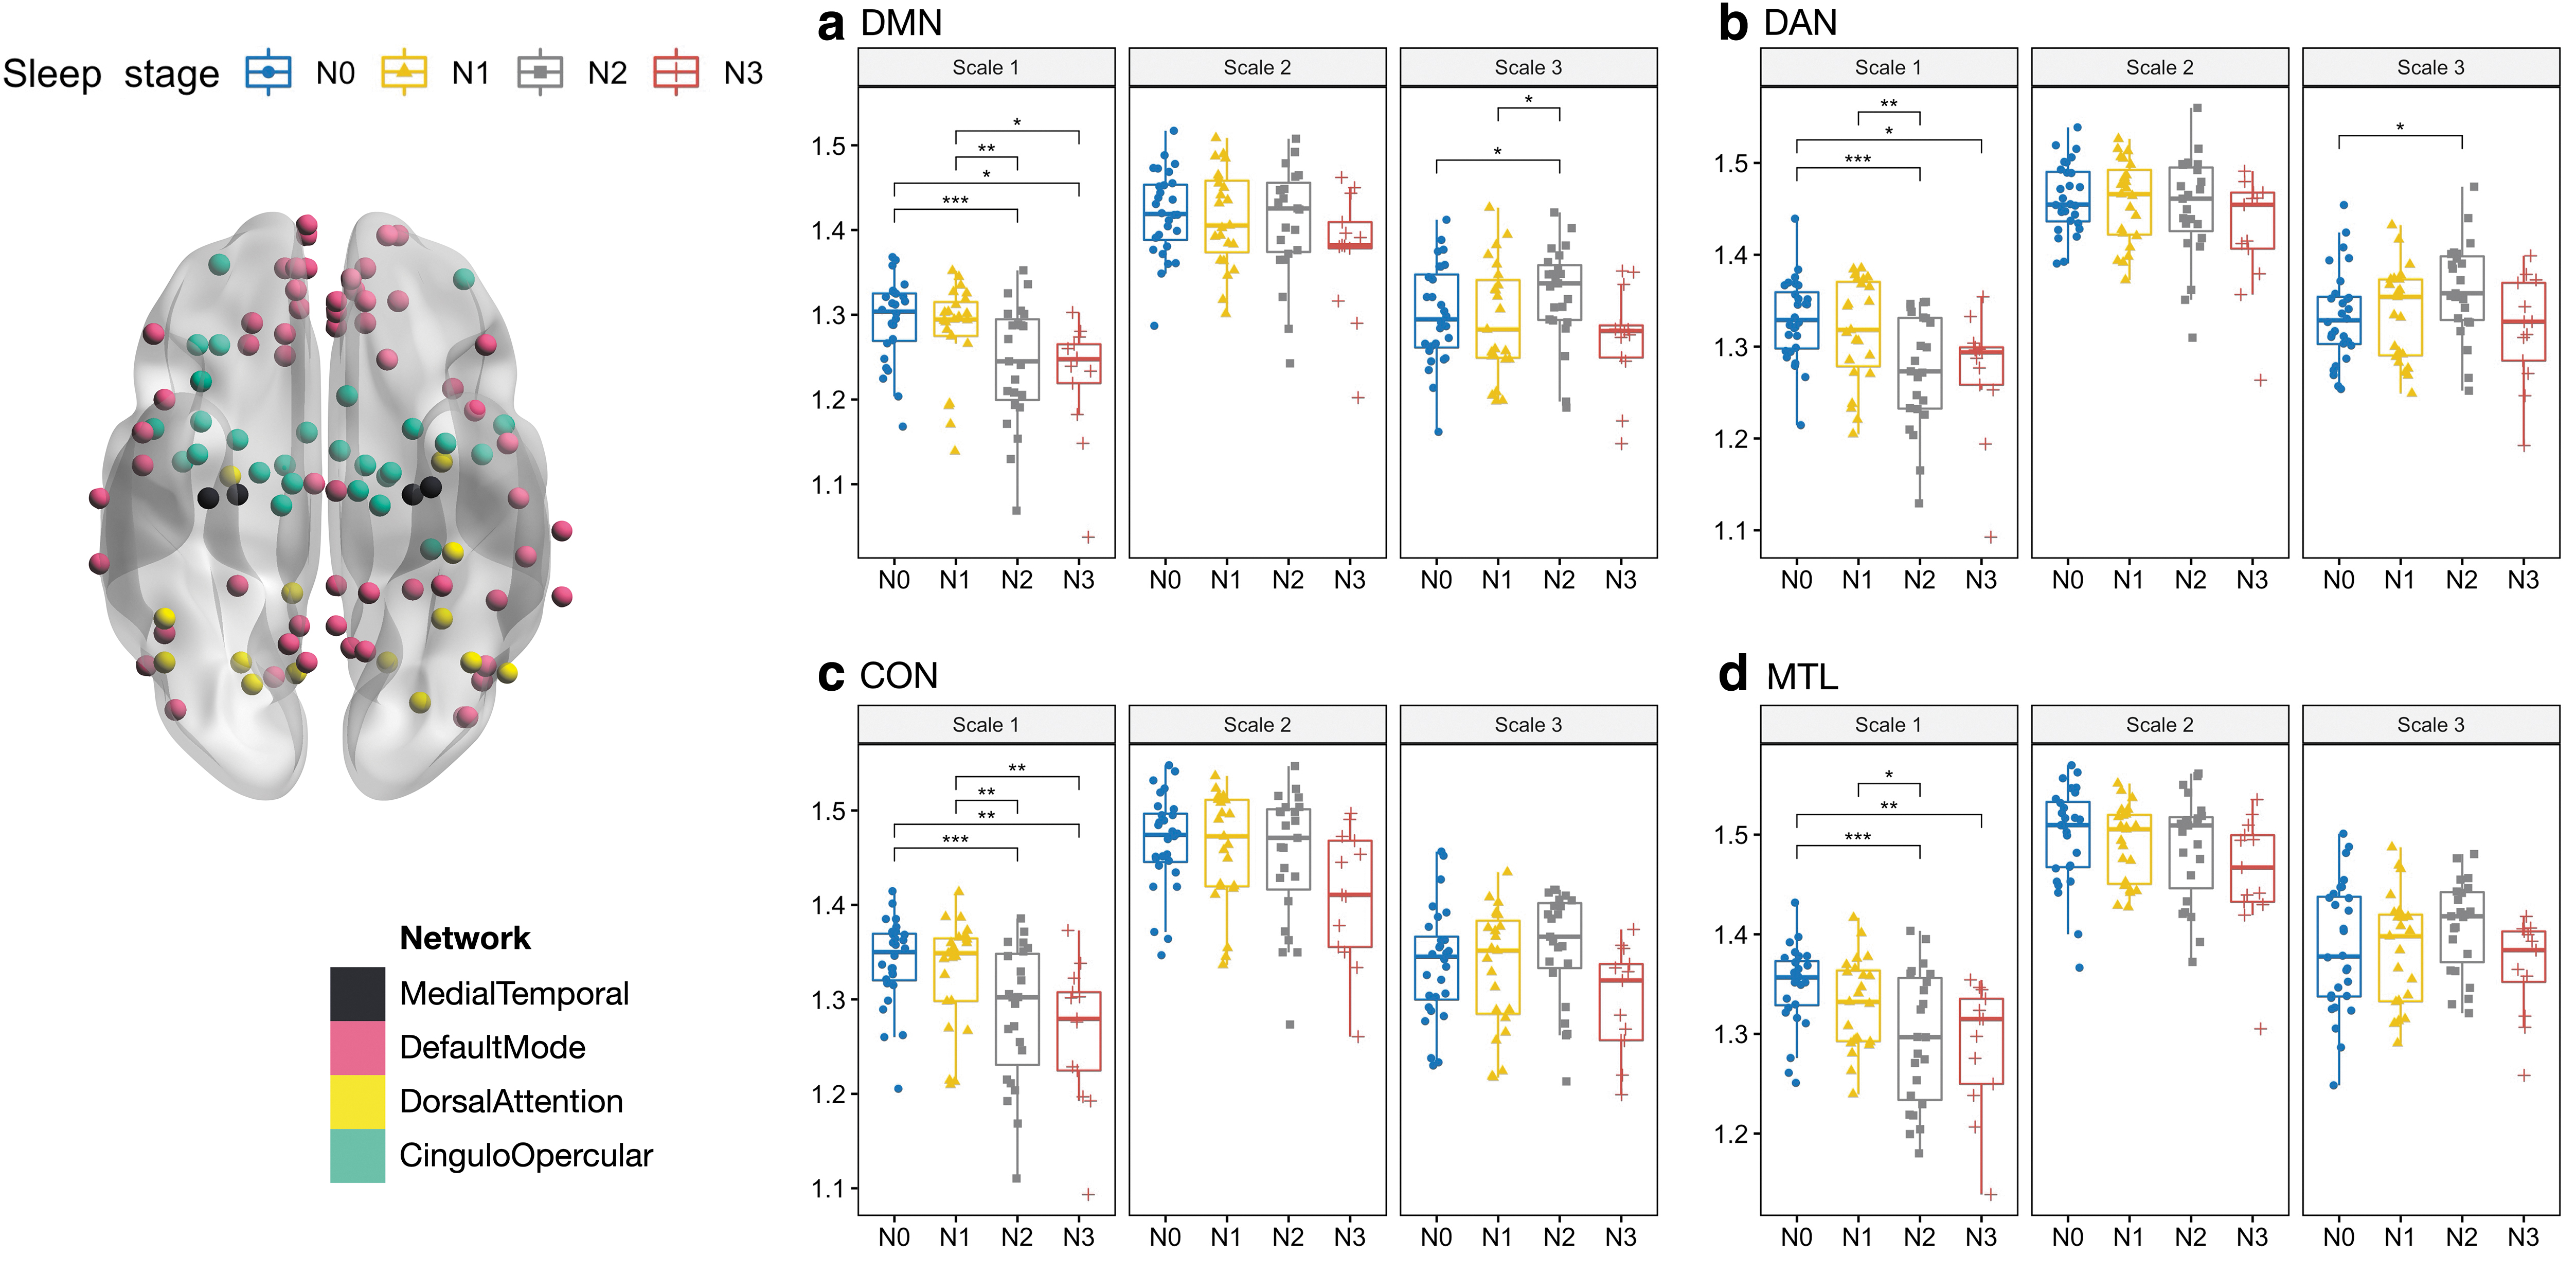
Figure 3 shows distinct MSE across NREM sleep stages at different timescales (Table 2). At Scale 1 (fine scale), entropy during N2 and N3 sleep was significantly lower than that during wakefulness and N1 sleep, presenting a linear decrease with sleep depth in most of the RSNs (Supplementary Fig. S3). Scale-1 entropy declined with sleep depth in the CON (p < 0.001, FDR corrected), DMN (p < 0.001, FDR corrected), MTL and DAN (p < 0.001, FDR corrected). Scale-3 entropy (coarse scale) did not exhibit significant differences across sleep stages in the CON and MTL (Fig. 3), and differed for the DMN (p = 0.02, uncorrected) and DAN (p = 0.03, uncorrected) in Scale-3 entropy (N2 > N0, DMN: p = 0.03, DAN: p = 0.036).
MSE alterations in
Statistical Comparison for the Stage Differences in Entropy at Scale 1 and Scale 3 Among Stages in Whole-Brain Resting-State Networks
A statistical comparison of MSE among stages was conducted with LME.
MSE, multiscale entropy.
Cross-scale relationships among functional metrics
The relationships among FSC, ReHo, and entropy at Scale 1 and 3 in Awake and Sleep were analyzed (Fig. 4). During NREM sleep, whole-brain FCS was positively correlated with ReHo (r = 0.27, p = 0.073, FDR corrected), Scale-1 entropy (r = 0.2, p = 0.15, FDR corrected), and Scale-3 entropy (r = 0.23, p = 0.12, FDR corrected), whereas ReHo was negatively correlated with Scale-1 entropy (r = −0.39, p = 0.006, FDR corrected). FCS exhibited a significant positive correlation with Scale-3 entropy in the CON (r = 0.32, p = 0.03, FDR corrected).

Correlation coefficients between cross-scale metrics, including FCS, ReHo, and MSE at Scale 1 (MSE.1) and at Scale 3 (MSE.3) during Awake (left panel) and Sleep (right panel, involved all the NREM sleep stages) in RSNs. Cool and warm colors represent negative and positive associations, respectively. (*p < 0.05, FDR corrected). FCS, FC strength; RSN, resting-state network.
A significant negative correlation was observed between ReHo and Scale-1 entropy in the CON (r = −0.37, p = 0.01, FDR corrected), DMN (r = −0.31, p = 0.04, FDR corrected), DAN (r = −0.37, p = 0.01, FDR corrected), and MTL (r = −0.49, p < 0.001, FDR corrected). However, these relationships were not observed in the Awake state (Supplementary Fig. S4).
Discussion
The cross-scale functional metrics were used to examine the spatiotemporal dynamics as well as functional alterations across awake and NREM sleep stages. Regional neural activity, disclosed by entropy at the fine timescale corresponded to ReHo during sleep. By contrast, entropy at the coarse timescale (Scale 3) tended to demonstrate long-range interaction and distributed neural coactivation as FCS. The results showed distinct patterns of local and global metrics throughout the NREM stages.
In terms of connectivity, global FCS gradually decreased from the Awake state through the stages of NREM sleep, whereas local ReHo exhibited a nonlinear pattern across sleep stages (the highest in N2 and the lowest in N3). Entropy exhibited a general decline with sleep depth at the local scale (Scale 1), whereas Scale-3 entropy remained unchanged or even increased. The N1 and N3 stages were characterized by a similar local–global balance in the cross-scale metrics; however, the N2 stage exhibited decreased long-range connectivity and high local synchrony (ReHo), which indicate massive local information processing during this period. In addition, the discovery of unbalanced local–global regulation during the N2 stage may reflect synaptic downscaling as described by the synaptic homeostasis hypothesis (Tononi and Cirelli, 2003, 2006).
According to the integrated information theory (IIT), loss of consciousness during sleep could be evaluated in terms of the capacity for information integration (Tononi, 2004, 2012; Tononi et al., 2016), where decreased consciousness during the N2 stage could result from an increase in complexity due to poor long-range integration of brain networks.
Estimation of cross-scale connectivity during NREM sleep
This study investigated alterations in functional brain metrics during NREM sleep at both the global and local scales, with connectivity use as the common metric probing the state of the sleeping brain. FC refers to functional communication between distant regions in space, whereas ReHo better reflects the local configuration. In the sleep–wake cycle, FCS decreased with NREM sleep depth and was the lowest during N3 sleep; this finding is consistent with that of a previous study (Spoormaker et al., 2010; Uehara et al., 2014), especially in between network (Kung et al., 2019; Larson-Prior et al., 2011; Sämann et al., 2011). Between- and within-network FC is considered to reflect global and local communication, respectively.
The number of declined FCsig increased with sleep depth (Supplementary Fig. S2). During NREM sleep, the percentages of FCsig in between (FCsig-btw) and within RSNs (FCsig-within) were similar (Fig. 2). However, the N2 stage was unique among all observed stages because the percentage of FCsig-within within networks was higher than that in between networks. Precisely, the percentage of both the increase (i.e., N2 > N0) and decrease (i.e., N2 < N0) in FCsig-within was higher than FCsig-btw during the N2 stage. The increased FCsig-within implies that the N2 stage tends to regulate brain connectivity or information exchange at a local level.
By contrast, ReHo estimates intraregional synchrony and thus can be used as a more direct metric to examine local communication. Compared with the Awake state, NREM sleep incurred greater ReHo in most RSNs. ReHo peaked during the N2 stage, whereas during SWS, ReHo showed inconsistent wake–sleep relationships across RSNs. The nonlinear changes in local communication are in accordance with the within-network finding in our previous study (Kung et al., 2019). ReHo was more consistent among all the RSNs than FC. In brief, cross-scale connectivity metrics suggest an imbalance of global and local information integration at different sleep–wake stages.
Cross-scale entropy among NREM sleep stages
We evaluated signal entropy in the sleep–wake cycle for the cross-scale feature. In contrast to the quantification of entropy at a single timescale, we adopted MSE for the BOLD signals with coarse temporal graining, and the characteristics of MSE facilitated comprehension of various brain-network processes during NREM sleep. Compared with the Awake state, lower entropy was observed at Scale 1 in most RSNs during NREM sleep, whereas entropy in the N2 stage was the highest at Scale 3. Furthermore, at Scale 1, the entropy decrease observed during SWS is in agreement with the finding of previous studies using fMRI (Deco et al., 2017) and EEG (Acharya et al., 2005; Bruce et al., 2009; Shi et al., 2017).
In our previous study (Kung et al., 2019), we found that the variability of dynamic FC within RSNs (dFCvar-within) peaked in the N2 stage. Thus, we speculated that swift variations in the N2 stage could lead to an increase in entropy. However, the decreased Scale-1 entropy across sleep stages is in contrast to our expectation. The reduced local entropy may result from the possibility that local signals fluctuate in a regular pattern and synchronize in a local scale (reduced Scale-1 entropy with increased ReHo).
In contrast to Scale 1, the N2 stage showed the highest entropy at Scale 3. Entropy at the coarse scale is considered effective for detecting temporal dynamics that reflect long-range connections, whereas entropy at the finer scale reflects interconnectivity among local neural populations (Mizuno et al., 2010). The increase in Scale-3 entropy corresponds well with the high variance in FC observed between RSNs during N2 sleep (Kung et al., 2019; Tarun et al., 2021). In short, the gradual decline in Scale-1 entropy indicates decreased signal complexity among local RSNs, whereas the trend of increased Scale-3 entropy observed in the N2 stage suggests a randomized information transfer in a global configuration.
Relationship among cross-scale functional metrics
For functional alterations in sleep, the regulation of neural synchrony theory indicates that scale-dependent neural complexity is related to the information processes reflecting local and global communication. Information transfer peaked when neurons were desynchronized at fine timescales, but synchronized at coarse timescales (McDonough and Nashiro, 2014; Wang et al., 2018).
In a previous study, as a global property, FCS demonstrated a positive correlation with entropy at the coarse timescale, indicating an interaction between distributed neural populations (McDonough and Nashiro, 2014; Wang et al., 2018). Similarly, ReHo, a local feature of connectivity, can better indicate a strong negative correlation with the fine-scale entropy, identifying the underlying information exchange at the local scale. Thus, we evaluated the relationships among multiple metrics in both the Awake and Sleep states. The Scale-1 entropy gradually decreased as NREM sleep deepened, whereas the ReHo changes were nonlinear. The two metrics exhibited a negative correlation in most of the RSNs during both states (Fig. 4). Decreased complexity of local neuronal synchrony reflected limited information processing.
By contrast, increased complexity may reflect greater information processing (Wang et al., 2018) because FCS exhibited a stronger correlation with entropy at the coarser timescale. Among sleep–wake stages, the N2 stage had the highest Scale-3 entropy for the DMN, somatomotor dorsal network, and parietal medial network (Supplementary Fig. S3); however, FCS in the N2 stage remained low, implying an overall enhanced information transfer that was restricted locally.
The relationships among cross-scale metrics differed between the Awake and Sleep states (Fig. 4). Compared with the Awake state, the Sleep state had a closer association between connectivity and entropy at both the local and global scales. FC tends to occur more between regions sharing a direct anatomical link (Tagliazucchi et al., 2016). The strong relationships among multiple neuroimaging metrics may correspond to an increase in anatomical–functional coupling with sleep depth. In other words, the interconnectivity and interaction of a neural population are guided and constrained by anatomical tracts, leading to more resemblance and straightforward presentation during the Sleep than the Awake state.
To confirm the potential influence of physiological factors, the relationships among the four functional metrics and physiological factors (the standard deviation of respiratory/cardiac pulsation and the mean FD) were estimated in Supplementary Figure S5 (the analysis detail is attached in Supplementary Material). We found that respiratory and cardiac variations did not significantly impact the four functional indices; however, FD still had a significant impact on the FCS index even after the nuisance regression, indicating the high variability of FCS caused by head motion. Therefore, it is suggested to carefully estimate the concerns of physiological factors to study the relationship between functional indices in the future.
RSN-specific alterations in local–global balance during NREM sleep
Local sleep specifically targets the function of use-dependent memory formation in which active consolidation cycles among the neocortical, thalamocortical, and hippocampal systems. We screened network functions in the area surrounding the hippocampus, known as the MTL, and found ReHo exhibited no cross-stage differences (Fig. 1 and Supplementary Fig. S1). High ReHo at the hippocampus during SWS reflects local wakefulness during deep sleep, unlike local inactivation in the other RSNs. ReHo remained constant in the frontoparietal network (FPN), possibly because the frontal regions tend to oscillate locally more than other regions during sleep (Rattenborg et al., 2012).
In contrast to sustained levels of local communication in the MTL and FPN throughout the sleep stages, the local-scale entropy (Scale 1) significantly decreased as NREM sleep deepened. In the MTL and FPN, ReHo and Scale-1 entropy were negatively correlated (MTL: r = −0.49, p < 0.001, FPN: r = −0.46, p < 0.001), indicating the increased relationship between signal regularity and synchronization at the local level. Furthermore, the relationships among local metrics suggested that local communication was consistent across NREM sleep stages in these RSNs.
Regarding the networks associated with awareness (i.e., the DMN) and alertness (i.e., the DAN and CON) regulation in sleep, MSE alterations in the three RSNs exhibited the same trend: complexity decreased during N1 and N3 toward regularity, whereas true complexity was observed in the N2 stage. The decreased Scale-1 entropy indicated that information processing decreased during both N2 and N3 sleep. At Scale 3, entropy was significantly greater during the N2 stage than during the waking stage. The differences suggest more distributed information processing in the N2 stage and less in the N3 stage.
In the DMN, ReHo was slightly increased during light sleep but significantly decreased during N3 sleep (N2∼N1∼N0>N3); Scale-1 entropy declined with sleep depth, whereas Scale-3 entropy peaked in the N2 stage. The decreased FC and increased ReHo at the N2 stage indicated gradual long-distance DMN decoupling (Horovitz et al., 2009; Sämann et al., 2011), but a trend toward local connections (Lunsford-Avery et al., 2020). During SWS, Scale-3 entropy decreased, with weakened distributed interactions, indicating minimal FC. The decreased Scale-1 entropy may reflect enhanced interconnectivity among local neural populations; however, ReHo decreased in the N3 stage, implying an overall inactive state that is different from the N2 stage. The reduction in overall communication reflected the overall inactive state during SWS and suggested that the loss of consciousness resulted from limited information processing.
This result, combined with the entropy differences at the fine and coarse scales (Fig. 1a), suggests that deep sleep may regulate the DMN at both the local and global levels (Horovitz et al., 2009).
As task-positive RSNs, the DAN and CON jointly support awareness of the environment (Vincent et al., 2008) that parallels to the content of consciousness. In the CON, ReHo was the highest in the N2 stage (N2>N1∼N3∼N0), whereas Scale-1 entropy decreased with sleep depth (N0∼N1>N2∼N3), exhibiting a pattern similar to that observed in the DMN. The DAN showed a divergent pattern from those of the DMN and CON. In the DAN, ReHo was the lowest during the N3 stage (N2∼N1∼N0>N3), whereas Scale-1 entropy was the lowest in the N2 stage (N0∼N1>N3∼N2). The finding of the lowest entropy in the N2 stage suggests frequent spindle oscillations in thalamocortical connectivity.
The significant decline in local communication indicates the effect of SWS on the DAN at the local level. The unchanged Scale-3 entropy suggests that sleep regulates task-positive RSNs locally rather than globally. The imbalance of global and local features in the DMN and DAN supports their anticorrelation and further reflects the loss of consciousness during NREM sleep. In summary, the divergent patterns of awareness-associated RSNs indicate that the sleeping human brain exhibits network-specific conditions during NREM sleep, thus supporting the concept of local sleep.
Limitations
We investigated changes during NREM sleep across local to global scales by using multiscale fMRI metrics. However, two confounding factors should be considered for future investigations. First, the length of natural sleep stages varies. Thus, the data obtained for the MSE calculations were inconsistent among the sleep stages. Nevertheless, SampEn provides greater consistency and is less dependent on a given signal length than other entropy measures (Richman and Moorman, 2000). Second, the extent of the scale factor used in the MSE analysis was limited to the length of BOLD time series. All consecutive nonoverlapping sleep stages were analyzed separately, which made each session insufficiently long to examine entropy with a larger scale factor, as given in a previous study (Yang et al., 2018).
However, the MSE value was unaffected even with the shortest signal length (94 data points in N3), since the standard deviation of MSE value did not differ across sleep stages.
Conclusions
In the current study, both connectivity metrics (i.e., FC and ReHo) and MSE were adopted to examine network-specific patterns throughout the sleep–wake cycle and the local–global balance in brain circuits. The relationships of cross-scale metrics revealed the dynamic regulation of neural synchrony during NREM sleep. The distinct patterns of the cross-scale metrics among sleep-related RSNs reflected nonuniform brain activation, supporting the concept of local sleep. In particular, we found an overall decline in cross-scale metrics in the N1 and N3 stages, whereas N2 sleep tended to regulate connectivity at the local level, with unstable long-distance information processing. According to IIT, the distinct patterns of information processing across stages indicate altered states of consciousness associated with various procedures.
Collectively, the imbalanced global–local relationships reflected by multiscale functional metrics suggests changes in regulation across sleep–wake stages.
Footnotes
Authors’ Contributions
Conception generation of the work: Y.-C.K., C.-P.L., and C.W.W. Experimental design and data acquisition: P.-J.T., S.C., M.-K.L., and H.-C.L. Data analysis: Y.-C.K., C.-W.L., and F.-C.H. Interpretation of the finding: Y.-C.K., C.-Y.C., C.-P.L., and C.W.W.
Author Disclosure Statement
No competing financial interests exist.
Funding Information
This research was funded by the Taiwan Ministry of Science and Technology (MOST 104-2218-E-010-007-MY3, MOST 105-2628-B-038-013-MY3, MOST 108-2420-H-010-001, MOST 108-2634-F-010-001) and the Taipei Medical University (110TMU-WFH-17). This work was supported by the Institute for Research Excellence in Learning Sciences, National Taiwan Normal University, from the Higher Education Sprout Project and the Brain Research Center, National Yang Ming University, from The Featured Areas Research Center Program within the framework of the Higher Education Sprout Project (DP2-110-21121-01-N-10), where both projects were funded by the Ministry of Education in Taiwan.
Supplementary Material
Supplementary Data
Supplementary Figure S1
Supplementary Figure S2
Supplementary Figure S3
Supplementary Figure S4
Supplementary Figure S5
Supplementary Table S1
Supplementary Table S2
References
Supplementary Material
Please find the following supplemental material available below.
For Open Access articles published under a Creative Commons License, all supplemental material carries the same license as the article it is associated with.
For non-Open Access articles published, all supplemental material carries a non-exclusive license, and permission requests for re-use of supplemental material or any part of supplemental material shall be sent directly to the copyright owner as specified in the copyright notice associated with the article.