




Abstract
Introduction:
Functional movement disorder (FMD) is a type of functional neurological disorder characterized by abnormal movements that patients do not perceive as self-generated. Prior imaging studies show a complex pattern of altered activity, linking regions of the brain involved in emotional responses, motor control, and agency. This study aimed to better characterize these relationships by building a classifier using a support vector machine to accurately distinguish between 61 FMD patients and 59 healthy controls using features derived from resting-state functional magnetic resonance imaging.
Materials and Methods:
First, we selected 66 seed regions based on prior related studies, then we calculated the full correlation matrix between them before performing recursive feature elimination to winnow the feature set to the most predictive features and building the classifier.
Results:
We identified 29 features of interest that were highly predictive of the FMD condition, classifying patients and controls with 80% accuracy. Several key features included regions in the right sensorimotor cortex, left dorsolateral prefrontal cortex, left cerebellum, and left posterior insula.
Conclusions:
The features selected by the model highlight the importance of the interconnected relationship between areas associated with emotion, reward, and sensorimotor integration, potentially mediating communication between regions associated with motor function, attention, and executive function. Exploratory machine learning was able to identify this distinctive abnormal pattern, suggesting that alterations in functional linkages between these regions may be a consistent feature of the condition in many FMD patients.
Impact statement
Our research presents novel results that further elucidate the pathophysiology of functional movement disorder (FMD) with a machine learning model that classifies FMD and healthy controls correctly 80% of the time. Herein, we demonstrate how known differences in resting-state functional magnetic resonance imaging connectivity in FMD patients can be leveraged to better understand the complex pattern of neural changes in these patients. Knowing that there are measurable predictable differences in brain activity in patients with FMD may help both clinicians and patients conceptualize and better understand the illness at the point of diagnosis and during treatment. Our methods demonstrate how an effective combination of machine learning and qualitative approaches to analyzing functional brain connectivity can enhance our understanding of abnormal patterns of brain activity in FMD patients.
Introduction
Functional neurological disorder (FND) presents with a diverse array of symptoms, including motor, cognitive, and sensory impairments (Gilmour et al., 2020). Functional movement disorder (FMD) is a subtype of FND that is characterized by abnormal movements. FMD patients perceive these movements as involuntary and do not have conscious control over their symptoms (Czarnecki and Hallett, 2012). Clinical guidelines indicate that an FMD diagnosis should be made based on positive symptoms that are not consistent with another neurological disease (American Psychiatric Association, 2013).
Signs that may become apparent under clinical examination include entrainment—synchronization of the abnormal movement with voluntary tapping (Hallett, 2016). Patients are a heterogeneous group and frequently present with comorbid neurological or psychiatric disorders. Although FMD patients seeking care at neurology clinics is common, reaching an appropriate diagnosis can still be difficult and delayed. It can take 2 to 10 years following symptom onset to make the diagnosis (Perez et al., 2021a), and many neurologists continue to order additional testing to make a “diagnosis of exclusion” (LaFaver, 2020; LaFaver et al., 2020).
This long delay in diagnosis is sometimes coupled with lingering stigmatization of FMD patients because of a historical conflation with malingering patients who feign (consciously fake) symptoms (Perez et al., 2021b). Since the patient's perception of their illness is key for a good prognosis (Perez et al., 2021a), reaching the correct diagnosis is important, but not necessarily sufficient.
A poorly worded explanation from a clinician can alienate the patient and hinder recovery (Cock and Edwards, 2018), while the ability of the clinician to indicate positive symptomology can help the patient accept their disorder and embark on treatment (Perez et al., 2021b).
Emerging reports indicate that patients with FMD have abnormal brain function. Neural activity associated with FMD symptomology differs from activity associated with conscious mimicking of similar symptoms (Cojan et al., 2009; Spence et al., 2000; Stone et al., 2007; van Beilen et al., 2011; Voon et al., 2010b), emphasizing the pathological nature of the patient's symptoms.
Despite heterogeneity in the study design and criteria for subject inclusion, altered activity in multiple brain regions has been consistently implicated in FMD (Voon et al., 2016).
Functional imaging studies have characterized this abnormal brain activity in FMD patients, which taken together indicate diffuse changes in functional connections in several key brain regions. When compared with healthy controls, FMD cohorts show reduced activity in premotor, supplementary motor, and primary motor cortices during motor-related tasks (Dogonowski et al., 2019; Marshall et al., 1997; Voon et al., 2011).
Patients show habituation to and stronger arousal in limbic areas, particularly the amygdala, in response to emotional stimuli (Aybek et al., 2015; Hassa et al., 2017; Voon et al., 2010a), along with atypical activity in parts of inferior frontal, temporal, and occipital regions (Espay et al., 2018). Altered connectivity has been detected between areas associated with motor planning, attention, and self-monitoring, such as the temporo–parieto–occipital junction, prefrontal cortices, and motor regions (Diez et al., 2019; Maurer et al., 2016).
These findings are consistent with reported symptoms of FMD. Overactivation in areas associated with emotional processing may suppress and interfere with motor execution (Hassa et al., 2017; Kanaan et al., 2007; Voon et al., 2011), resulting in a discrepancy between motor planning and execution, which impacts the FMD patient's sense of agency, that is, their sense that movements initiated and enacted in the body are under their voluntary control (Roelofs et al., 2019).
Altered connectivity in the right temporoparietal junction (TPJ), an area associated with those feelings of self-agency (Nahab et al., 2011, 2017), has been strongly implicated in functional imaging studies of FMD patients, suggesting that it is an intrinsic feature of the condition (Aybek et al., 2014; Baek et al., 2017; Maurer et al., 2016). Increased connectivity between insular regions and the amygdala and motor-related regions may correspond to altered interoceptive processing and emotional awareness (Diez et al., 2019).
Other areas associated with volitional motor control are impacted, including the pre-supplementary motor area (SMA) and dorsolateral prefrontal cortex (dlPFC) (Spagnolo et al., 2021). This abnormal interplay between these three networks associated with emotion, motor planning and action, and attention, self-monitoring, and agency, indicate that there is a characteristic pattern of functional changes in the brain (Monsa et al., 2018). Successful treatment of FMD is associated with disruption of this pattern (Dogonowski et al., 2019; Faul et al., 2020).
Abnormal functional connectivity between multiple regions suggests that there is a complex, but distinctive, pattern of functional connectivity changes in FMD. Such identifiable and consistent changes in brain activity may help better distinguish FMD, reducing diagnostic uncertainty. Machine learning has been proposed as a technique to aid neurological and psychiatric diagnoses (Richiardi et al., 2012; Zeng et al., 2012; Zito et al., 2021).
Wegrzyk and colleagues proposed that machine learning classification might be helpful in alleviating some barriers to diagnosis by identifying positive biomarkers for FMD. They achieved 68% classification accuracy by training a support vector machine (SVM) classification algorithm with measures derived from resting-state functional magnetic resonance imaging (rs-fMRI), indicating that functional differences are informative for classification. Increased connectivity between the right caudate and left amygdala and postcentral gyri, along with decreased connectivity between the right TPJ and frontal regions, characterized the most predictive features (Wegrzyk et al., 2018).
This type of machine learning application is potentially useful not only in distinguishing patients from nonpatients but also in understanding the pathophysiology of a disorder in diseases with known functional connectivity alterations (Richiardi et al., 2012). One benefit may be that some types of machine learning applications are more able than linear modeling to detect complex and subtle relationships between features (Nielsen et al., 2020).
We sought to build on this previous work by deploying a machine learning approach in a relatively large dataset of 120 samples consisting of FMD patients and healthy controls (HCs). By leveraging previously reported alterations in functional connectivity in FMD, we hoped to simultaneously improve classification accuracy and try to detect a unique neural signature or pattern of functional brain connectivity inherent to FMD patients.
The goals of this study were twofold. First, we aimed to build an accurate classifier based on rs-fMRI data to distinguish between FMD patients and HCs. Second, by investigating the features that were most important to the model, we explored the patterns of activity that are more relevant and consistently predictive in a broad range of FMD patients.
As such, the initial feature list was highly inclusive and derived from prior known differences in certain brain regions of FMD patients. Then, we engaged with a feature selection process to produce a more limited set of features that maximized the predictive value of the classifier.
Materials and Methods
Participants
Sixty-one patients with clinically definite FMD, recruited from the NIH Human Motor Control (HMC) clinic, and 59 age- and gender-matched HCs, recruited from the NIH Clinical Research Volunteer Program database, participated in an ongoing broader study investigating clinical and neurological features of FMD at the National Institute of Neurological Disorders and Stroke (NINDS) in Bethesda, Maryland, between 2011 and 2019.
The inclusion criteria for the FMD cohort required clinically definite FMD diagnostic consensus after evaluation by at least two movement disorder specialists from the HMC clinic (including M.H.). Exclusion criteria for all subjects included comorbid neurological disease, current substance abuse, history of traumatic brain injury, active autoimmune disorder, current suicidal ideation, pregnancy, contraindications for MRI, use of antiepileptic medication, and antidepressant use within the past six months.
All participants provided written informed consent before participating. The NIH Institutional Review Board approved the study protocol. A subset of these subjects was previously reported (Maurer et al., 2016; Spagnolo et al., 2020).
Clinical assessment
Participants were evaluated with the Clinical Global Impressions (CGI) scale, a stand-alone assessment of global patient functioning by an expert clinician (Busner et al., 2009). To assess depression and anxiety, all participants completed the Beck Depression Inventory (BDI) and the State–Trait Anxiety Inventory (STAI-S), respectively.
MRI acquisition
Imaging was acquired with a 3T Siemens Skyra scanner using a 32-channel head coil. Structural images were collected using T1-weighted anatomical MRI (multiecho magnetization-prepared rapid gradient echo [MEMPRAGE], voxel size 1 × 1 × 1 mm). An rs-fMRI scan was acquired using a T2-weighted multiechoplanar imaging sequence (voxel size 3 × 3 × 3 mm; repetition time 2000 ms; repetitions: 180; and acquisition time: 6 min).
During resting-state scans, participants were instructed to close their eyes, remain awake, and not think of anything in particular. Full parameters are included in Supplementary Methods.
Image preprocessing
Image preprocessing was completed using AFNI software (Cox, 1996). The MEMPRAGE images were averaged across echoes, then skull stripped, and nonlinearly registered to the Montreal Neurological Institute (MNI) ICBM 152 2009 template using the @SSwarper function. Each rs-fMRI sequence was preprocessed using afni_proc.py, where spatial transformations are concatenated and applied in a single step.
The command used to create our preprocessing script is included in Supplementary Methods. In brief, preprocessing steps were as follows: despiking, slice-time correction, alignment to the processed MEMPRAGE, registration to the MNI template space using the warps computed by @SSwarper, coregistration of each functional volume, multiecho independent component analysis denoising through
Volumes with excess motion (framewise displacement >0.3 mm) and/or with blood oxygen level dependent signal outliers in many voxels (proportion of voxels >0.1) were censored. Censored time points were omitted in the correlations. Maximum displacement and number of censored volumes were extracted and inspected for differences between FMD and control groups.
Statistical analysis
Continuous variables were evaluated with a two-sample t-test. Categorical variables were evaluated with a chi-square test. Significance was set at p = 0.05 (type I error).
Feature generation
Sixty-six seed locations were determined based on MNI coordinates derived from prior fMRI studies of FMD/FND patients (refer to Supplementary Methods and Supplementary Table S1). We calculated the pairwise Pearson's correlation coefficient (r) between each seed and every other seed, creating a symmetrical correlation matrix using AFNI software.
Data were inspected and reshaped using a custom Python pipeline (Python Software Foundation; Python Language Reference, version 3.7). We trimmed the full symmetrical matrix to the upper triangle, then reshaped the remaining values into a single feature vector for each subject.
We inspected intrasubject feature variability (standard deviation [SD] of the feature vector). We also calculated the group mean and SD of the intrasubject feature SD to evaluate differences in feature variability between subjects.
Model pipeline
We reduced the number of features in the model and trained a classifier to predict subject categories in one integrated pipeline. Figure 1 shows a schematic outline of this process. We performed a three-way 80:10:10 stratified split of the dataset, which maintained group category (HC vs. FMD), age, and gender in proportion to the overall set of subjects.

Schematic workflow shows the data handling steps that occurred to select a restricted feature set and train the model.
Eighty percent of the subjects were used for feature reduction and model training, 10% for parameter and hyperparameter testing, and 10% as a hold out dataset for validating the results. In the 80:10:10 scheme, the training set is used to run different parameter combinations, which are then evaluated in the testing set, without penalty for evaluation of the final classifier, as the hold out set is only used in the evaluation of the final SVM kernel.
The feature reduction step was performed using recursive feature elimination (RFE). RFE uses a wrapper approach (Kohavi and John, 1997) to reduce the number of features by ranking them in order of importance (Guyon et al., 2002) and is supported by Python's scikit-learn package. Supplementary Methods include further details of the feature selection process.
The training set and testing set were trimmed to include only those features that were provisionally identified in the RFE step. We created 10 subsets of the training set with 80% of the subjects included in each subset. Training in subsamples has been shown to reduce model instability in cases where the inclusion or exclusion of a small number of samples in the training set leads to differences in model learning (Dietterich, 2000).
We trained an SVM classifier on each subset and then tested prediction accuracy in the test set. The test dataset was not used in the feature selection process to avoid circular analysis, which can artificially inflate accuracy rates when the same samples are used for feature selection and model testing (Pulini et al., 2019). Performance was calculated by averaging the classification accuracy on the test set across the 10 subsets.
We determined the best performing set of parameters and hyperparameters based on highest average accuracy in the test set (more information on the hyperparameter optimization technique can be found in Supplementary Methods). This produced a finalized feature set and a finalized model specification. Subsequently, we trimmed the 10% hold out dataset to only those features included in this final feature set and tested the performance of the specified model in classifying the hold out set.
These data were kept independent throughout the pipeline, including the selection of features and classifier training to account for the possibility of overfitting to the test set. This independence is necessary to prevent data leakage, in which information from the test set finds its way into model formation in a way that overfits the model (Chakraborty and Elzarka, 2019).
Model statistical testing
We tested the significance of our model classification results. To establish a null distribution, we trained and tested the finalized model while randomly shuffling the subject categorization labels of the hold out set 100 times. The mean and SD of the null distribution were calculated. A z-test was performed.
We performed a post hoc analysis to compare the performance of our radial basis function (RBF)-SVM classifier with logistic regression models. Details are described in the Supplementary Methods.
Feature exploration
To aid in understanding the qualitative organization of the restricted feature set, we performed an additional exploratory analysis.
We used NeuroSynth, an automated meta-analysis software platform that performs text mining to match study characteristics to individual MNI coordinates (Yarkoni et al., 2011), as a source for information about each seed. In a few cases, it was necessary to adjust the coordinate location by one voxel to generate this information.
For each central coordinate, we extracted the top three functional descriptors (if available), excluding those that described the physical structure or brain region (such as “parietal” or “hippocampus”) or described a particular methodology (such as EEG). We consolidated descriptors with highly similar meanings (such as “motion” and “movement” or “vision” and “visual”).
To organize the results, we checked if seeds within the feature set had shared characteristics by performing unsupervised K-means clustering with Python's scikit-learn package (Pedregosa et al., 2011). See details in Supplementary Methods. Once the reduced feature set was finalized, we used the identified cluster groupings as an aid in understanding which functional types were selected and whether these functional groupings were connected.
Results
Cohort characteristics
There were no significant differences in age or gender between the two groups. FMD patients had significantly higher CGI, BDI, and STAI-S scores than HCs (Table 1). All FMD patients were considered to have a low likelihood of factitious symptoms and had at least one type of hyperkinetic movement. Forty-five patients reported tremors, 36 jerking movements, 25 dystonia, 40 abnormal walking and balance, 28 abnormal speech, and 21 paresis. Ten subjects reported other symptoms not present in the listed categories.
Demography and Clinical Scores of Study Participants
p Value represents the results of statistical testing between the healthy control and FMD patient groups with tests described in the clinical assessment section. Where the test was not significant, ns is indicated.
BDI, Beck Depression Inventory; CGI, Clinical Global Impressions; FMD, functional movement disorder; STAI-S, State–Trait Anxiety Inventory.
We removed one FMD subject from the analysis whose feature variability exceeded the intergroup mean variance by more than eight group SDs (Supplementary Fig. S1). There were no significant differences between the FMD and control groups in the number of censored volumes, maximum displacement, or average motion.
Feature selection
We removed three seeds because more than 5% of the subjects were missing data there, so the final number of seeds was 63. After removing the lower triangle of the symmetrical matrix (duplicate of upper triangle), the total number of possible features was 1953, each representing a connectivity score between two seed regions.
Twenty-nine seed-to-seed connectivity features were identified by the RFE step (Fig. 1) and included in the restricted feature set (see Supplementary Table S2 for the complete list). Of the 29 identified connections, 35 seed regions were represented. The majority of regions (31 of 35) had more than one region-to-region connection, while 4 regions were isolated binary connections (one region to one region).
Figure 2 shows the connectivity diagram for all seed regions. Seven seed regions were highly connected, that is, connected to at least three other regions. These included regions in the left occipital lobe, posterior insula, dlPFC, and cerebellum and right SMA and postcentral gyrus.

Network diagram shows the relationship between the features selected during the RFE step. Of 1953 possible features, these 29 region-to-region connections (with 35 seed regions overall) are the best predictors of FMD patient status. For visualization purposes, regions are organized thematically according to associated functions described in NeuroSynth and their projections. Nodes are shaded according to the groupings derived from the unsupervised clustering. Node size corresponds to the number of connections attached to that node. FMD, functional movement disorder; RFE, recursive feature elimination.
Of these regions, direct connections were present between the right SMA and left posterior insula, right SMA and left cerebellum, and right postcentral and left occipital regions. Several regions appeared to serve as intermediate connectors between motor, sensorimotor, and executive areas. SMA/pre-SMA and the right TPJ were connected through the left cerebellum and left amygdala regions. The left insula and left putamen connected seeds in SMA and the postcentral gyrus to premotor/primary motor areas.
Classification results
The best performing classifier was the SVM with a radial basis function kernel. Average accuracy in predicting the condition of each sample in the test dataset was 84%. When the trained model was tested on the hold out set, which had been completely held out from any model fitting or parameter/hyperparameter tuning, the classifier model distinguished FMD subjects from HCs with an 80% accuracy rate (Table 2).
Accuracy Rates and Sensitivity and Specificity Percentages for the Test and Hold Out Sets
While accuracy was well matched between the test set and hold out set, there was an imbalanced sensitivity:specificity ratio.
The null distribution for model performance had a mean of 0.499 and SD of 0.047. Classifier performance was significant, with Z = −6.3, p < 0.001. The critical value above which accuracy was significant at p < 0.05 was at an accuracy rate of ∼59.1%.
While all the tested models performed above chance, our RBF-SVM model outperformed the logistic regression and other SVM models (Supplementary Table S4).
Feature exploration
We obtained 173 descriptors from the NeuroSynth database (some regions did not have at least three descriptors). Based on the descriptors, we identified 19 qualitative characteristics represented within the feature set. For example, the descriptors “motor,” “movement,” and “motion” were all included under the motion/movement characteristic. One hundred sixty-eight of the descriptors fit within these 19 characteristic associations; 5 were excluded because the meaning was ambiguous.
Unsupervised clustering of the feature set produced the highest silhouette score (0.117) with three clusters (Supplementary Table S3). Figure 3 shows the average Pearson's r correlation scores between each region, sorted by cluster. Visual inspection of the clusters indicates that clusters 1 and 3 were more coherent than cluster 2. Figure 4 shows the complete list of 19 qualitative characteristics and the frequency with which a characteristic appeared in describing the seed regions included in each group. Executive function and memory, emotion and speech, and movement were the three characteristics that were most different between groups for clusters 1, 2, and 3, respectively. Based on these differences, we termed the cluster groupings as “Executive,” “Limbic,” and “Motor” groups.
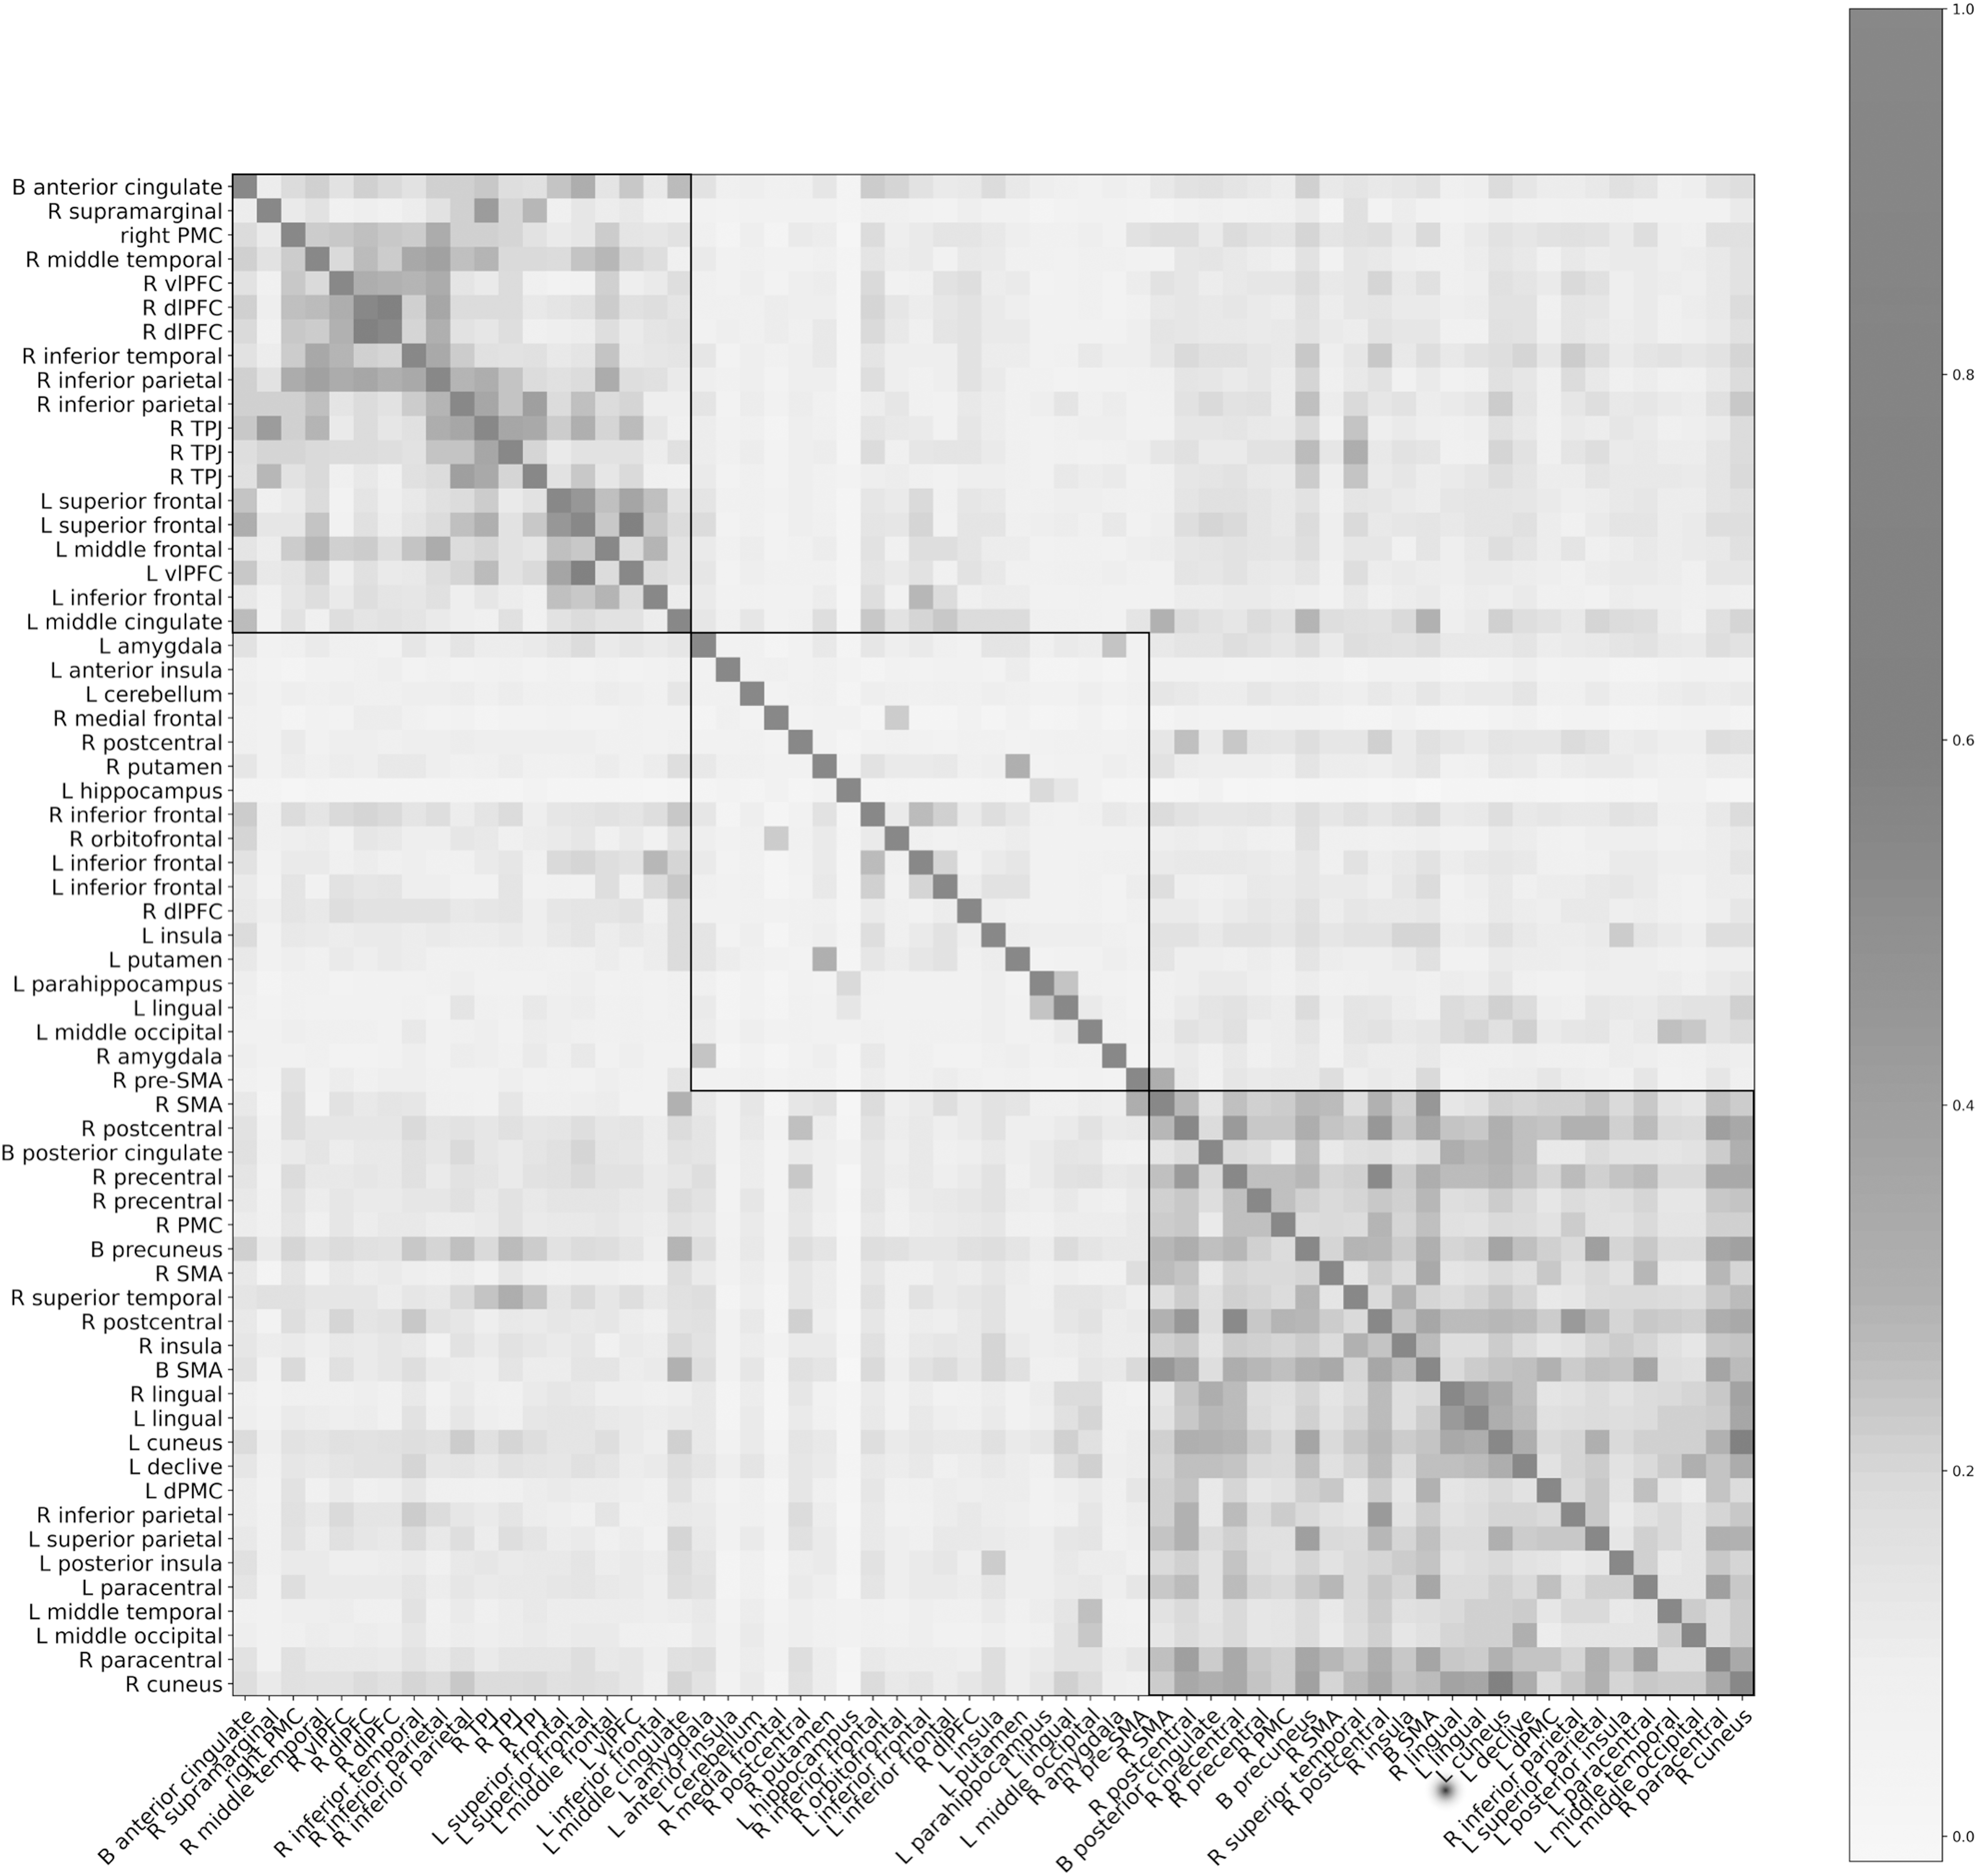
Reordered symmetric matrix of average correlations between 63 seed regions across the full 120-sample dataset. Region order is determined by similarity to neighbors according to the unsupervised clustering algorithm. The algorithm divided the regions into three groups, which are delineated by a black border. The lowest average r value by feature was −0.0137. All but four of the regions had positive average correlations. The maximum average r value was 0.608.
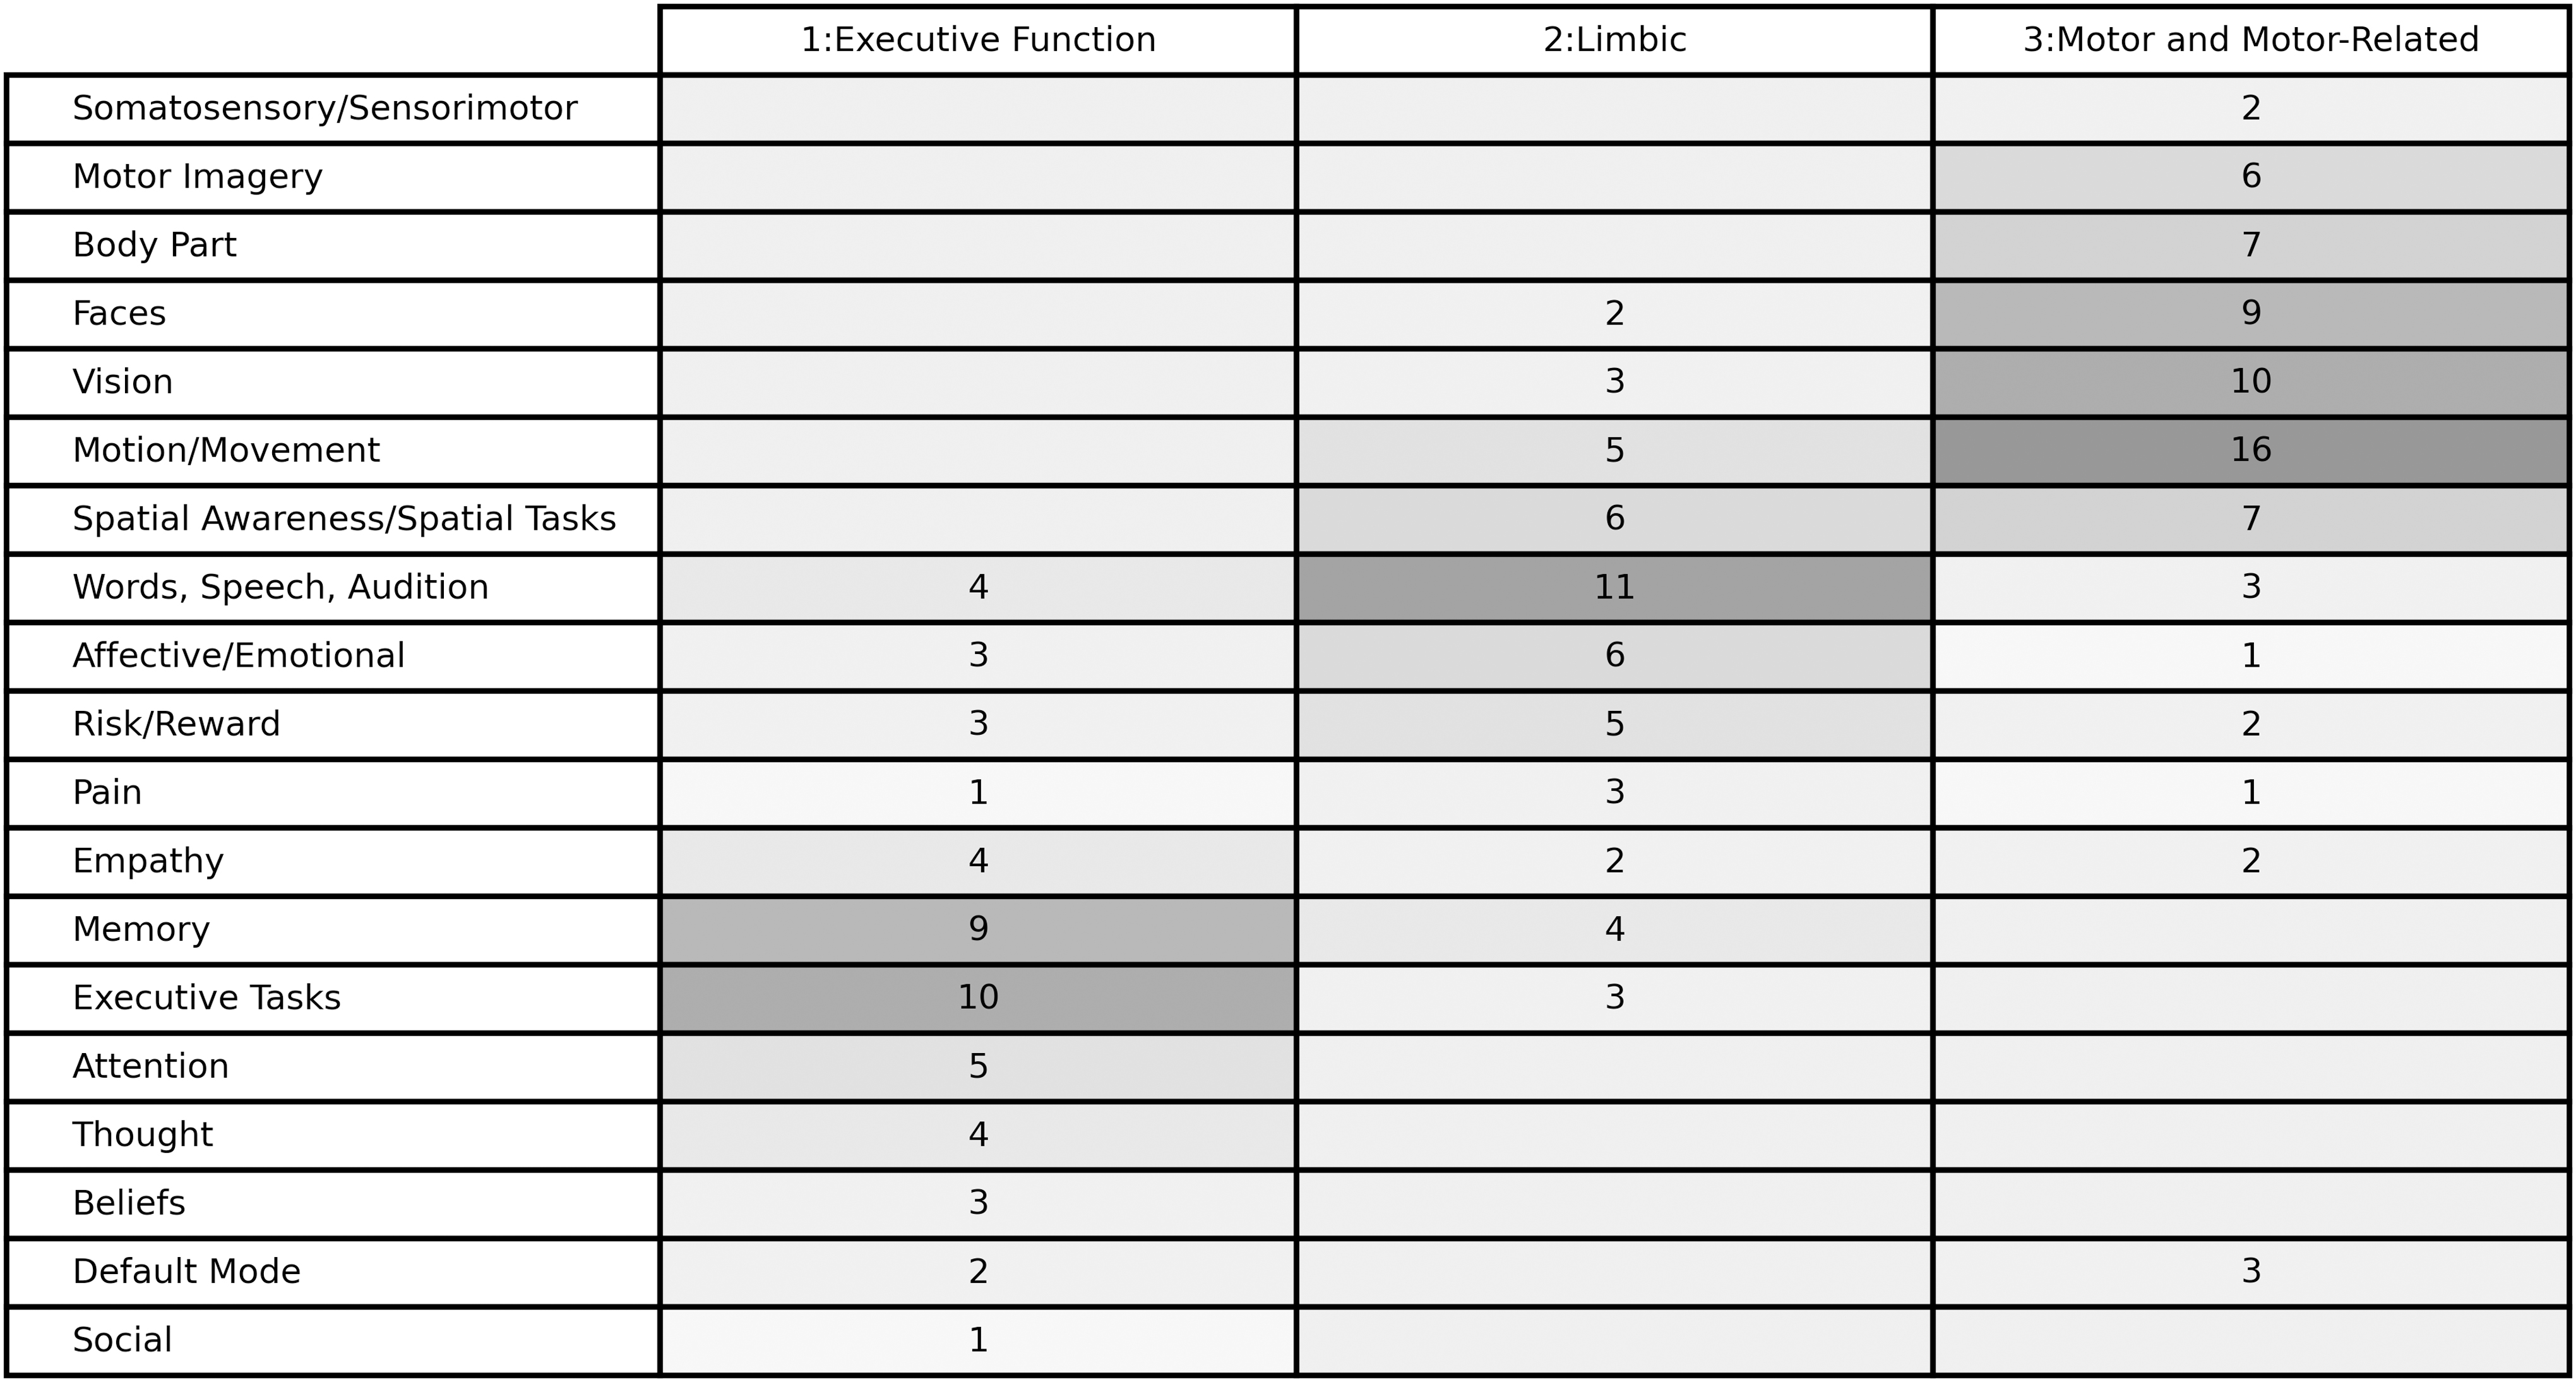
Each row represents a defined characteristic summarizing a similar grouping of descriptors, with 19 distinct characteristics. For visualization purposes, we ordered the descriptors and used a gradations in shading to show the ways in which the three groups differ. Numbers are the frequency with which the descriptor was present within the characteristic for each group.
In the final feature set, the number of regions and their connections were not evenly distributed between the clusters. Fifteen of 35 represented seeds were in the motor cluster, 12/35 in the limbic cluster, and 8/35 in the executive cluster. Seed regions categorized in the motor cluster were most likely to connect either to the limbic cluster or to other motor cluster seeds (9 and 8 connections, respectively).
There was only one direct connection between the motor and executive cluster. Limbic regions connected to other limbic cluster regions or executive regions four and four times, respectively. Executive cluster regions were interconnected with other executive cluster regions three times (Table 3).
Frequency of Apportionment in the Restricted Feature Set and Between the Three Clusters Identified in the Full Dataset
The motor and limbic clusters had more regions represented in the restricted feature solution than the executive cluster. Motor regions were most likely to connect either to other motor regions or limbic regions. Limbic regions were most likely to connect to motor regions, but were equally likely to connect to other limbic and executive cluster regions. Executive cluster regions were most likely to connect to limbic regions, followed by other executive regions, with only a single direct connection to a motor region.
Discussion
The two-step SVM classifier was able to accurately distinguish FMD patients from HCs with an accuracy rate of 80% solely using features derived from rs-fMRI data. To our knowledge, this is the highest predicted accuracy produced in a machine learning FMD classifier. We believe our feature selection approach helped improve classification accuracy.
This limited subset of 29 region-to-region connections together compose a distinctive, if complex, pattern for predicting FMD in a broad range of patients. FMD brain connectivity appears to have a sufficiently atypical connectivity pattern to serve as a reliable predictor of the disorder.
By comparing the seeds and connections that were included in the feature set and those that were discarded, a clear pattern becomes a potential characteristic marker for differential functional activity in FMD patients. Motor seeds mostly connected to other motor seeds or seeds associated with limbic function, with only one direct connection between a motor-related region in the right SMA and a region categorized as part of the executive cluster in the right inferior temporal gyrus.
In contrast, seed regions in the limbic cluster connected frequently both to motor and executive regions. From this, we conclude that differences in executive motor connectivity associated with FMD are mediated by limbic regions, a finding that is supported by prior research suggesting that motor functions are “hijacked” by the limbic system and disconnected from top-down regulation in FMD (Voon et al., 2011).
The left insula may be an important connector region between motor and sensorimotor areas, suggesting altered interoception in FMD (Diez et al., 2019). The feature selection process picked connections between the right SMA and areas in the left amygdala, right putamen, and left posterior insula, which were associated with emotion and fear, emotional decision making, and pain, respectively, according to the aggregated qualitative descriptors we collected from the NeuroSynth report (Yarkoni et al., 2011).
In contrast, only an indirect connection through the left posterior insula remained between executive function or sensorimotor seed regions and premotor or primary motor regions.
The selected pattern mostly connected each seed to more than one other seed, rather than binary seed-to-seed connections. This may indicate that FMD patterns are complex, multiregional, and potentially nonlinear rather than binary region-to-region enhancements or decreases in connectivity.
Additionally, more connected seed regions may be particularly important in FMD and these include the right sensorimotor area, postcentral gyrus, and dlPFC and the left cerebellum, middle occipital gyrus, and posterior insula. From this, we posit that single seed-based connectivity analyses may not be able to accurately capture the full picture of functional differences in people with FMD.
The seed locations were based on prior published research findings, an approach we chose deliberately because it leverages known information about relevant brain regions in FMD rather than relying on features derived from whole brain parcellation, an alternative method that has previously been reported in FMD with a classification accuracy of 66% (Wegrzyk et al., 2018).
Our feature selection process proved to be beneficial for classification, as all the tested classifiers performed above chance, and improved from prior work. However, the RBF-SVM produced the best results. Our final model used only 29 features of a possible 1953 region-to-region connections (a subset consisting of only ∼1.5% of all possible features).
The two-step integrated feature reduction and classifier training pipeline required the model to search over a large number of possible feature combinations before winnowing down to this limited subset. This may be another reason the model had improved classification accuracy. The result is a novel finding that can help elucidate the pathophysiology of FMD and aid in interpreting the classifier by examining the connections that were selected versus those that were discarded. This novel method might be beneficial for understanding and diagnosing other diseases.
Exploratory unsupervised clustering improved the qualitative analysis of features that were included versus discarded following feature reduction. The executive and motor groups had more within-group cohesion than the limbic group, which contained regions connected to the limbic system, such as the amygdala, and those associated with speech and language, which may be why the silhouette scores were low, as a less cohesive cluster can reduce the overall value.
Nevertheless, the resulting set of three clusters is similar in concept to other researchers' characterizations of the disorder; for example, “the sensorimotor domain, the cognitive domain, and the negative affect domain” (Spagnolo et al., 2021).
A limitation of the study was in selection of the two groups. There is variability between FMD patients in type and severity of symptoms. In addition, comorbid psychiatric problems are not uncommon (Hallett, 2016), and our FMD cohort had significantly higher rates of both anxiety and depression when compared with the HC group.
Depression can reduce the functional connectivity between certain limbic and frontal regions (Carballedo et al., 2011; Cheng et al., 2018), while changes in amygdala connectivity were associated with increased interoception in people with anxiety (Grossi et al., 2017). As such, disentangling the relative impact of depression, anxiety, and FMD in this cohort might have been better achieved with a control group matched for these conditions. However, not all FMD patients have anxiety or depression, and some controls did.
One problem in model development was the sample size. Clinical data collection practices often collect fewer data samples than what many machine learning techniques were optimized for (Arbabshirani et al., 2017). Another challenge was to avoid overfitting, information leakage, or excessive bias from individual samples while winnowing from a large number of features.
Separate test and hold out datasets aided in verifying the reliability of the model. However, the sensitivity/specificity ratio clearly indicates that overfitting still occurred. A more robust model might require a larger sample size, along with multiscanner and multisite samples, to account for other factors that impact classifier performance. However, consolidating data from different scanners presents new problems.
Additionally, it may be that rs-fMRI data are simply too noisy for better predictive accuracy in FMD. It would be interesting to try a similar method with task-based fMRI findings in a similar cohort. However, the identified connection patterns are a helpful starting point toward future advancements and provide new insight into the altered connectivity patterns in these patients.
Conclusions
With a moderate sample size, we were able to classify FMD patients and controls with ∼80% accuracy. The reduced group of regions defined by our feature selection and the analysis of the relevant connections support the concept of abnormal movement in FMD patients resulting from an imbalance of the limbic and motor areas.
Footnotes
Acknowledgments
The authors thank Drs. Carine Maurer and Kathrin LaFaver for participation in data acquisition and patient evaluation and Dr. Francisco Pereira for advice and methodological guidance.
Authors' Contributions
R.E.W. was involved in formal analysis; methodology; visualization; and writing—original draft. J.A.P. was involved in investigation and writing—review and editing. M.H.: was involved in resources; supervision; and writing—review and editing. S.G.H. was involved in conceptualization; investigation; methodology; supervision; and writing—review and editing.
Author Disclosure Statement
No competing financial interests exist.
Funding Information
This work was supported by the National Institute of Neurological Disorders and Stroke Intramural Research Program. This work utilized the computational resources of the National Institutes of Health High Performance Computing Biowulf cluster (
Supplementary Material
Supplementary Data
Supplementary Figure S1
Supplementary Table S1
Supplementary Table S2
Supplementary Table S3
Supplementary Table S4
References
Supplementary Material
Please find the following supplemental material available below.
For Open Access articles published under a Creative Commons License, all supplemental material carries the same license as the article it is associated with.
For non-Open Access articles published, all supplemental material carries a non-exclusive license, and permission requests for re-use of supplemental material or any part of supplemental material shall be sent directly to the copyright owner as specified in the copyright notice associated with the article.
