
Abstract
Background/Purpose:
Brain function changes with Alzheimer's disease (AD) progression. Evaluating those changes longitudinally is important to understand the complex relationships between brain pathologies and cognition. We aimed (1) to identify longitudinal changes in functional connectivity in patients with mild cognitive impairment (MCI) characterized for amyloid-β (Aβ) status and (2) to relate these functional changes to clinical progression.
Methods:
Forty-four patients with MCI were followed using serial functional magnetic resonance imaging (fMRI) over 1.2 years (three sessions) and cognitive testing over 3.1 years (five sessions). Intra and inter-network connectivities were computed to assess changes in brain connectivity using a network atlas adapted for late adulthood. Sixteen low-Aβ clinically normal older adults underwent a single fMRI session for group comparisons at baseline. Linear mixed-effects models with random intercept and slope were used to predict changes in connectivity based on Aβ status and progression to dementia.
Results:
At baseline, intra and inter-network resting-state fMRI connectivities did not differ by baseline clinical diagnosis, Aβ status, or clinical progression to dementia. At the final imaging session, progressive MCI had significantly higher connectivity compared with stable MCI, specifically within the default-mode network (DMN). Longitudinally, progressive MCI had increasing intra-DMN connectivity over time compared with stable MCI, and the rate of changes in connectivity was significantly associated with the rate of cognitive decline.
Conclusions:
Intra-DMN connectivity increases in MCI patients progressing toward dementia, suggesting aberrant synchronization in the symptomatic stages of AD.
Impact statement
Changes in functional connectivity occur in the course of Alzheimer's disease. We observed a progressive increase over time in resting-state functional connectivity within the default-mode network in patients with mild cognitive impairment who progressed to dementia. The rate of connectivity increase was significantly associated with the rate of cognitive decline. The observation of increased functional connectivity during the progression to dementia, and not only in the pre-clinical stage, is interpreted as an aberrant synchronization rather than a compensation mechanism.
Introduction
Alzheimer's disease (AD) is a progressive neurodegenerative disorder leading to dementia. AD pathology is characterized by senile plaques including amyloid-β (Aβ) fibrils that can be visualized in vivo using positron emission tomography (PET) (Klunk et al, 2004). It is now widely acknowledged that the first symptoms of AD pathology appear before the dementia stage, defining a prodromal stage with mild cognitive impairment (MCI) (Albert et al, 2011). Studying biomarker changes in this population is important as outcomes in therapeutic trials and for better understanding disease mechanisms. During the progression from MCI to AD dementia, structural and functional changes occur in the brain, which can be disclosed with either magnetic resonance imaging (MRI) or PET. Previous studies have demonstrated that clinical progression to dementia is associated with progressive atrophy (Edmonds et al, 2020) and glucose hypometabolism (Landau et al, 2011).
Resting-state connectivity, measuring brain activity at rest using functional MRI (rs-fMRI), has been proposed as another functional biomarker than PET (Greicius et al, 2004), but cross-sectional studies have reported conflicting results: some demonstrating decreasing (Wang et al, 2013; Zhou et al, 2008; Zhu et al, 2013) and other increasing (Esposito et al, 2013; Gardini et al, 2015; Zhang et al, 2012) functional connectivity within the default-mode network (DMN) over the course of the disease.
These discrepancies may originate in nonlinear changes over time with various levels of connectivity depending on the disease stage; for instance, connectivity might be increased in the pre-clinical stage of AD, and then decrease with cognitive decline (Schultz et al, 2017). Longitudinal studies are needed to appropriately test these hypotheses; but so far, very few longitudinal rs-fMRI studies have been carried out in the AD continuum (Jovicich et al, 2019; Schultz et al, 2020). Specifically, studying progression to dementia is important to understand the functional changes associated with clinical decline but no longitudinal resting-state studies were carried out in patients followed from the MCI to the dementia stage.
We therefore investigated longitudinal changes in rs-fMRI connectivity in MCI patients, characterized for both Aβ status and clinical progression to dementia after an average 3-year follow-up. Our aim was to disentangle the effect of Aβ status and clinical progression on changes in rs-fMRI connectivity, considering volume effects owing to aging and AD pathology.
Methods
Participants
Sixty older nondemented participants (age 57–83) were enrolled in a monocentric longitudinal rs-fMRI study (see Table 1 for demographic and cognitive data). Sixteen participants were clinically normal (CN) low-Aβ controls, recruited by advertisement, and 44 were patients with MCI who first attended our clinic between January 2012 and December 2018.
Characteristics of the Participants
Significant difference (p < 0.05) versus low-Aβ CN.
Significant difference (p < 0.05) versus stable MCI (matched for Aβ status).
Aβ, amyloid-β; CN, clinically normal; fMRI, functional magnetic resonance imaging; MCI, mild cognitive impairment; MMSE, Mini-Mental State Exam; PET, positron emission tomography; SD, standard deviation.
Inclusion criteria for MCI patients were cognitive complaints, confirmed by a relative and a neurologist, a Mini-Mental State Exam (MMSE) score ≥24/30, and a performance below the 10th percentile (composite z-score less than −1.3) of an independent age-matched control group in any of the following cognitive domains: memory (Free and Cued Selective Reminding Test, French version) (Van der Linden et al, 2004), language (Lexis Naming Test, the Category Fluency Test for animals, and the Letter Fluency Test for the letter “P”) (de Partz et al, 2001), executive functions (Trail Making Test, Luria's Graphic Sequences (adaptations in French, unpublished), and the visuospatial functions (Clock Drawing Test and the Praxis part of the Consortium to Establish a Registry for Alzheimer's Disease battery) (Morris et al, 1988; Rouleau et al, 1992).
Exclusion criteria were dementia (DSM-IV criteria), focal brain lesions, major depression or psychiatric diseases, alcohol or drug abuse, and autosomal-dominant mutations (PS1, PS2, and APP), which were systematically searched for in patients younger than 65 years. Participants had annual clinical follow-up including MMSE and performed neuropsychological evaluation every other year after baseline. Two neurologists (B.H./A.I.), blinded to the fMRI results, with >10 years of experience of Memory Clinics made consensus dementia diagnoses using all the clinical and cognitive data available. MMSE <24/30 and abnormal testing in two cognitive domains was required for the patient to be considered demented. Written informed consent was obtained from each participant. The study was approved by the local ethics committee (Eudra-CT number: 2011-001756-12).
Brain MRI
Three-dimensional (3D) T1-weighted images were recorded at 3T (Achieva; Philips Healthcare) with a 32-channel phased-array head coil. A total of 150 sagittal slices were acquired using the following parameters: repetition time (TR)/echo time (TE)/flip angle (FA) 9.1 msec/4.6 msec/8°; slice thickness 1 mm; resolution 0.81 × 0.95 mm2 (acquisition) reconstructed in 0.75 × 0.75 mm2; field of view 220 × 197 mm2; acquisition matrix 296 × 247; sensitivity encoding factor 1.5 (parallel imaging). The patients and the control group were scanned using resting-state (eyes closed) MRI using repeated single-shot echo-planar imaging. Scanner noise was attenuated using foam earplugs. The following parameters were used: TE = 30 msec, FA = 90°, in plane resolution = 3.438 × 3.438 mm2, 35 slices acquired in an ascending order, slice thickness = 3.44 mm, TR = 2000 msec, and number of TR = 200 (6 min 40 sec).
The MRI data were analyzed using BrainVoyager (Version 21.4; Brain Innovation, Maastricht, The Netherlands). Preprocessing of the resting-state data consisted of a linear trend removal to exclude scanner-related signal drift, temporal high-pass filter to remove frequencies <0.005 Hz and correction for head movements using a rigid body algorithm for rotating and translating each functional volume in 3D space. Data were also corrected for time differences in the acquisition of the different slices. Data were co-registered with their 3D T1-weighted scans and normalized in the MNI space. All co-registrations were verified manually and movement corrections were optimized, using a sinc interpolation. Because spontaneous low-frequency fluctuations are not exclusively blood-oxygen-level dependant-related fluctuations, but are also contaminated by non-neural signals (i.e., artifacts), several additional preprocessing steps were added to remove these undesirable sources of variance.
Regression analyses were performed to remove artifacts owing to residual motion (the six movement regressors were obtained via rigid body correction of head motion as implemented in BrainVoyager) and changes in ventricles (the signal from a ventricular region of interest defined in each participant). The final data were smoothed in the spatial domain (Gaussian filter: full width at half maximum = 5 mm) and corrected for volume effects. We used BrainVoyager and a customized MATLAB code (R2016b v9.1; MathWorks) to calculate cross-correlations between the average time-course signals. Functional time-courses were measured in 50 brain regions; and regional time-courses were averaged in meta-regions (or network subdivisions) that were shown to have similar time-courses in a data-driven analysis of CN older adults (Doucet et al, 2021).
The functional brain networks defined in late adulthood by Doucet et al, (2021) included: The DMN (four subdivisions); the Executive Control Network (ECN, four subdivisions); the sensorimotor network (SMN, four subdivisions); the visual network (VIS, two subdivisions); and the salience network (SAL, one subdivision). Inter-network connectivities were computed by correlating the time-course signal between any pair of two networks. Intra-network connectivities were obtained for the first four networks by correlating the signal between pairs of subdivisions within each network (one pair for VIS; six pairs averaged for DMN, ECN, and SMN). The intra-salience connectivity could not be evaluated because it only included one subdivision. In addition, we evaluated anterior and posterior intra-DMN connectivity by restricting the analyses to the regions anterior or posterior to the y = 0 axis (corresponding to the central sulcus, separating the frontal from the parietal lobe).
Structural MRI data were segmented by completing the FreeSurfer (v6.0) image analysis pipeline (Fischl, 2012). We normalized hippocampal volume (HV) to the intracranial volume (ICV), using a residual correction approach (equation: normalized HV = raw HV − b × (ICV − mean ICV), where b is the regression coefficient between HV and ICV in the CN group; ICV, the actual ICV value of each participant; and mean ICV, the average ICV in the CN group) (Hanseeuw et al, 2016; Ivanoiu et al, 2015). An average of 3.3 MRI sessions per MCI patient (min: 2, max: 4) was acquired.
[18F] Flutemetamol PET imaging
At study start, [18F] flutemetamol (now marketed as Vizamyl™; GE Healthcare) was proposed as an investigational medicinal radiopharmaceutical drug, being studied clinically as an Aβ-imaging agent. Ninety minutes after intravenous injection of [18F] flutemetamol (target activity 185 ± 5 MBq), a 30-min list-mode PET/computed tomography acquisition was performed on a Philips Gemini TF (Philips Healthcare) and reconstructed as a dynamic scan of 6 × 5 min with 2-mm isometric voxels including attenuation, scatter, decay corrections, and time-of-flight information using the manufacturer's standard reconstruction algorithm. No partial volume correction was applied to the data.
PET semiquantitative data were computed using the Centiloid pipeline provided in the PNEURO software (v3.9; PMOD LLC Technologies) using the ratio of the Centiloid cortical volume-of-interest and whole cerebellum to obtain SUVrCentiloid that were subsequently converted on the Centiloid Scale using the equation: Centiloid = 116.0 × SUVrCentiloid −113.9 (Hanseeuw et al, 2021; Klunk et al, 2015). A threshold of Centiloid >26 was used to define high Aβ among patients; patients below that threshold were considered as Low-Aβ. This CL cutoff was based on previous work predicting progression to dementia 5 years after PET (Hanseeuw et al, 2021). We only included CN with low Aβ PET results and used their fMRI results as an age-matched control group.
Statistics
We first compared baseline intra- and inter-network connectivity measures between Low-Aβ CN, Low-Aβ MCI, and High-Aβ MCI using multiple linear regressions. We then compared baseline connectivity measures between MCI patients who progressed to dementia and the ones who remained clinically stables during the follow-up. Finally, we used linear mixed-effects models with random intercept and random slope to predict changes in connectivity based on baseline Aβ status and progression to dementia. All analyses were adjusted for baseline age, sex, education, and apolipoprotein E4 genotype status. When comparing Low-Aβ and High-Aβ participants, models were conducted with and without E4 status as covariate, to evaluate the contribution of genotype to the results. All statistical analyses were computed in MATLAB.
Results
Characteristics of the participants
The 60 participants were grouped according to baseline Aβ status and progression to dementia. The 16 CN were all Low-Aβ and clinically stable after an average 2.8 years of cognitive follow-up. Among the 44 MCI patients, 21 had negative scans (Centiloid ≤26), including five (24%) who progressed to dementia after an average of 3.7 years. Twenty-three MCI had positive scans (Centiloid ≥27), including 10 (43%) who progressed to dementia after 3.3 years (Table 1). As expected, a higher proportion of E4 carriers was observed in the High-Aβ patients, but the proportion of E4 carriage was similar between stable and progressive MCI having the same Aβ status (p > 0.10). Progressive High-Aβ patients had significantly lower MMSE and hippocampal volume at baseline than stable patients. Progressive Low-Aβ patients were significantly older than the control participants and the stable Low-Aβ patients. The delay between cognitive assessment and imaging, and the duration of imaging follow-up were similar between patients' groups (p > 0.10).
Cross-sectional imaging analyses
At baseline (Table 2, left), intra-network rs-fMRI connectivities did not depend on clinical diagnosis, nor Aβ status (p > 0.10). No differences were observed in inter-network rs-fMRI either (p > 0.10). Similarly, hippocampal volumes were not different between clinical groups and hippocampal volumes were not significantly correlated with resting-state connectivity (p > 0.10). Intra- and inter-network rs-fMRI connectivities at baseline were not different between patients who would subsequently progress to dementia and patients who would remain clinically stable. In conclusion, no-between groups differences were observed at baseline.
Cross-Sectional Results
Values are β-estimates ± standard errors in linear regression models predicting resting-state connectivity. Covariates: age, sex, education, APOE status. CN only had baseline imaging session; therefore the MCI versus CN comparison was only conducted on the baseline MRI data.
p < 0.01; b p < 0.05.
DMN, default-mode network; ECN, executive control network; MRI, magnetic resonance imaging; SMN, sensorimotor network; VIS, visual network.
At the final imaging session (Table 2, right), progressive MCI (connectivity = 0.67) had significantly higher intra-DMN rs-fMRI connectivity compared with stable MCI (0.58, p = 0.007), indicating increased connectivity at the dementia stage. We next inquired whether this result was observed in the spectrum of AD, that is, by focusing only on High-Aβ MCI, and observed that progressive High-Aβ patients had marginally higher intra-DMN rs-fMRI compared with stable High-Aβ MCI at the final imaging session (β = 0.05 ± 0.03, p = 0.08); thus, approximately when they reached the mild AD dementia stage.
In contrast with progression status, the Aβ status was not associated with differences in DMN rs-fMRI connectivity at the final follow-up session, but with higher rs-fMRI connectivity within the VIS in the Aβ-positive MCI (p = 0.02, Table 2). No differences were observed in inter-network connectivity between Aβ groups or between progression groups. In conclusion, we observed no differences in connectivity at baseline, when patients had MCI; but we observed increased connectivity within the DMN at the final follow-up in the patients who progressed to dementia, suggesting an increase in intra-DMN connectivity during clinical progression from the MCI to the dementia stage.
Longitudinal imaging analyses
We next aimed to confirm this hypothesis of increased connectivity during clinical progression, by investigating longitudinal changes in rs-fMRI connectivity. We observed that progressive MCI had increasing intra-DMN connectivity over time compared with stable MCI in linear mixed-effect models (p = 0.006; Fig. 1 top left plot), but no significant changes were observed in other networks (Fig. 1, top right and middle row plots and see Table 3 for statistics). Furthermore, we analyzed the anterior and the posterior DMN separately and observed that the increase in connectivity over time in progressive MCI patients was mainly driven by its anterior part (p = 0.008), whereas the increase in the posterior part was not significant.
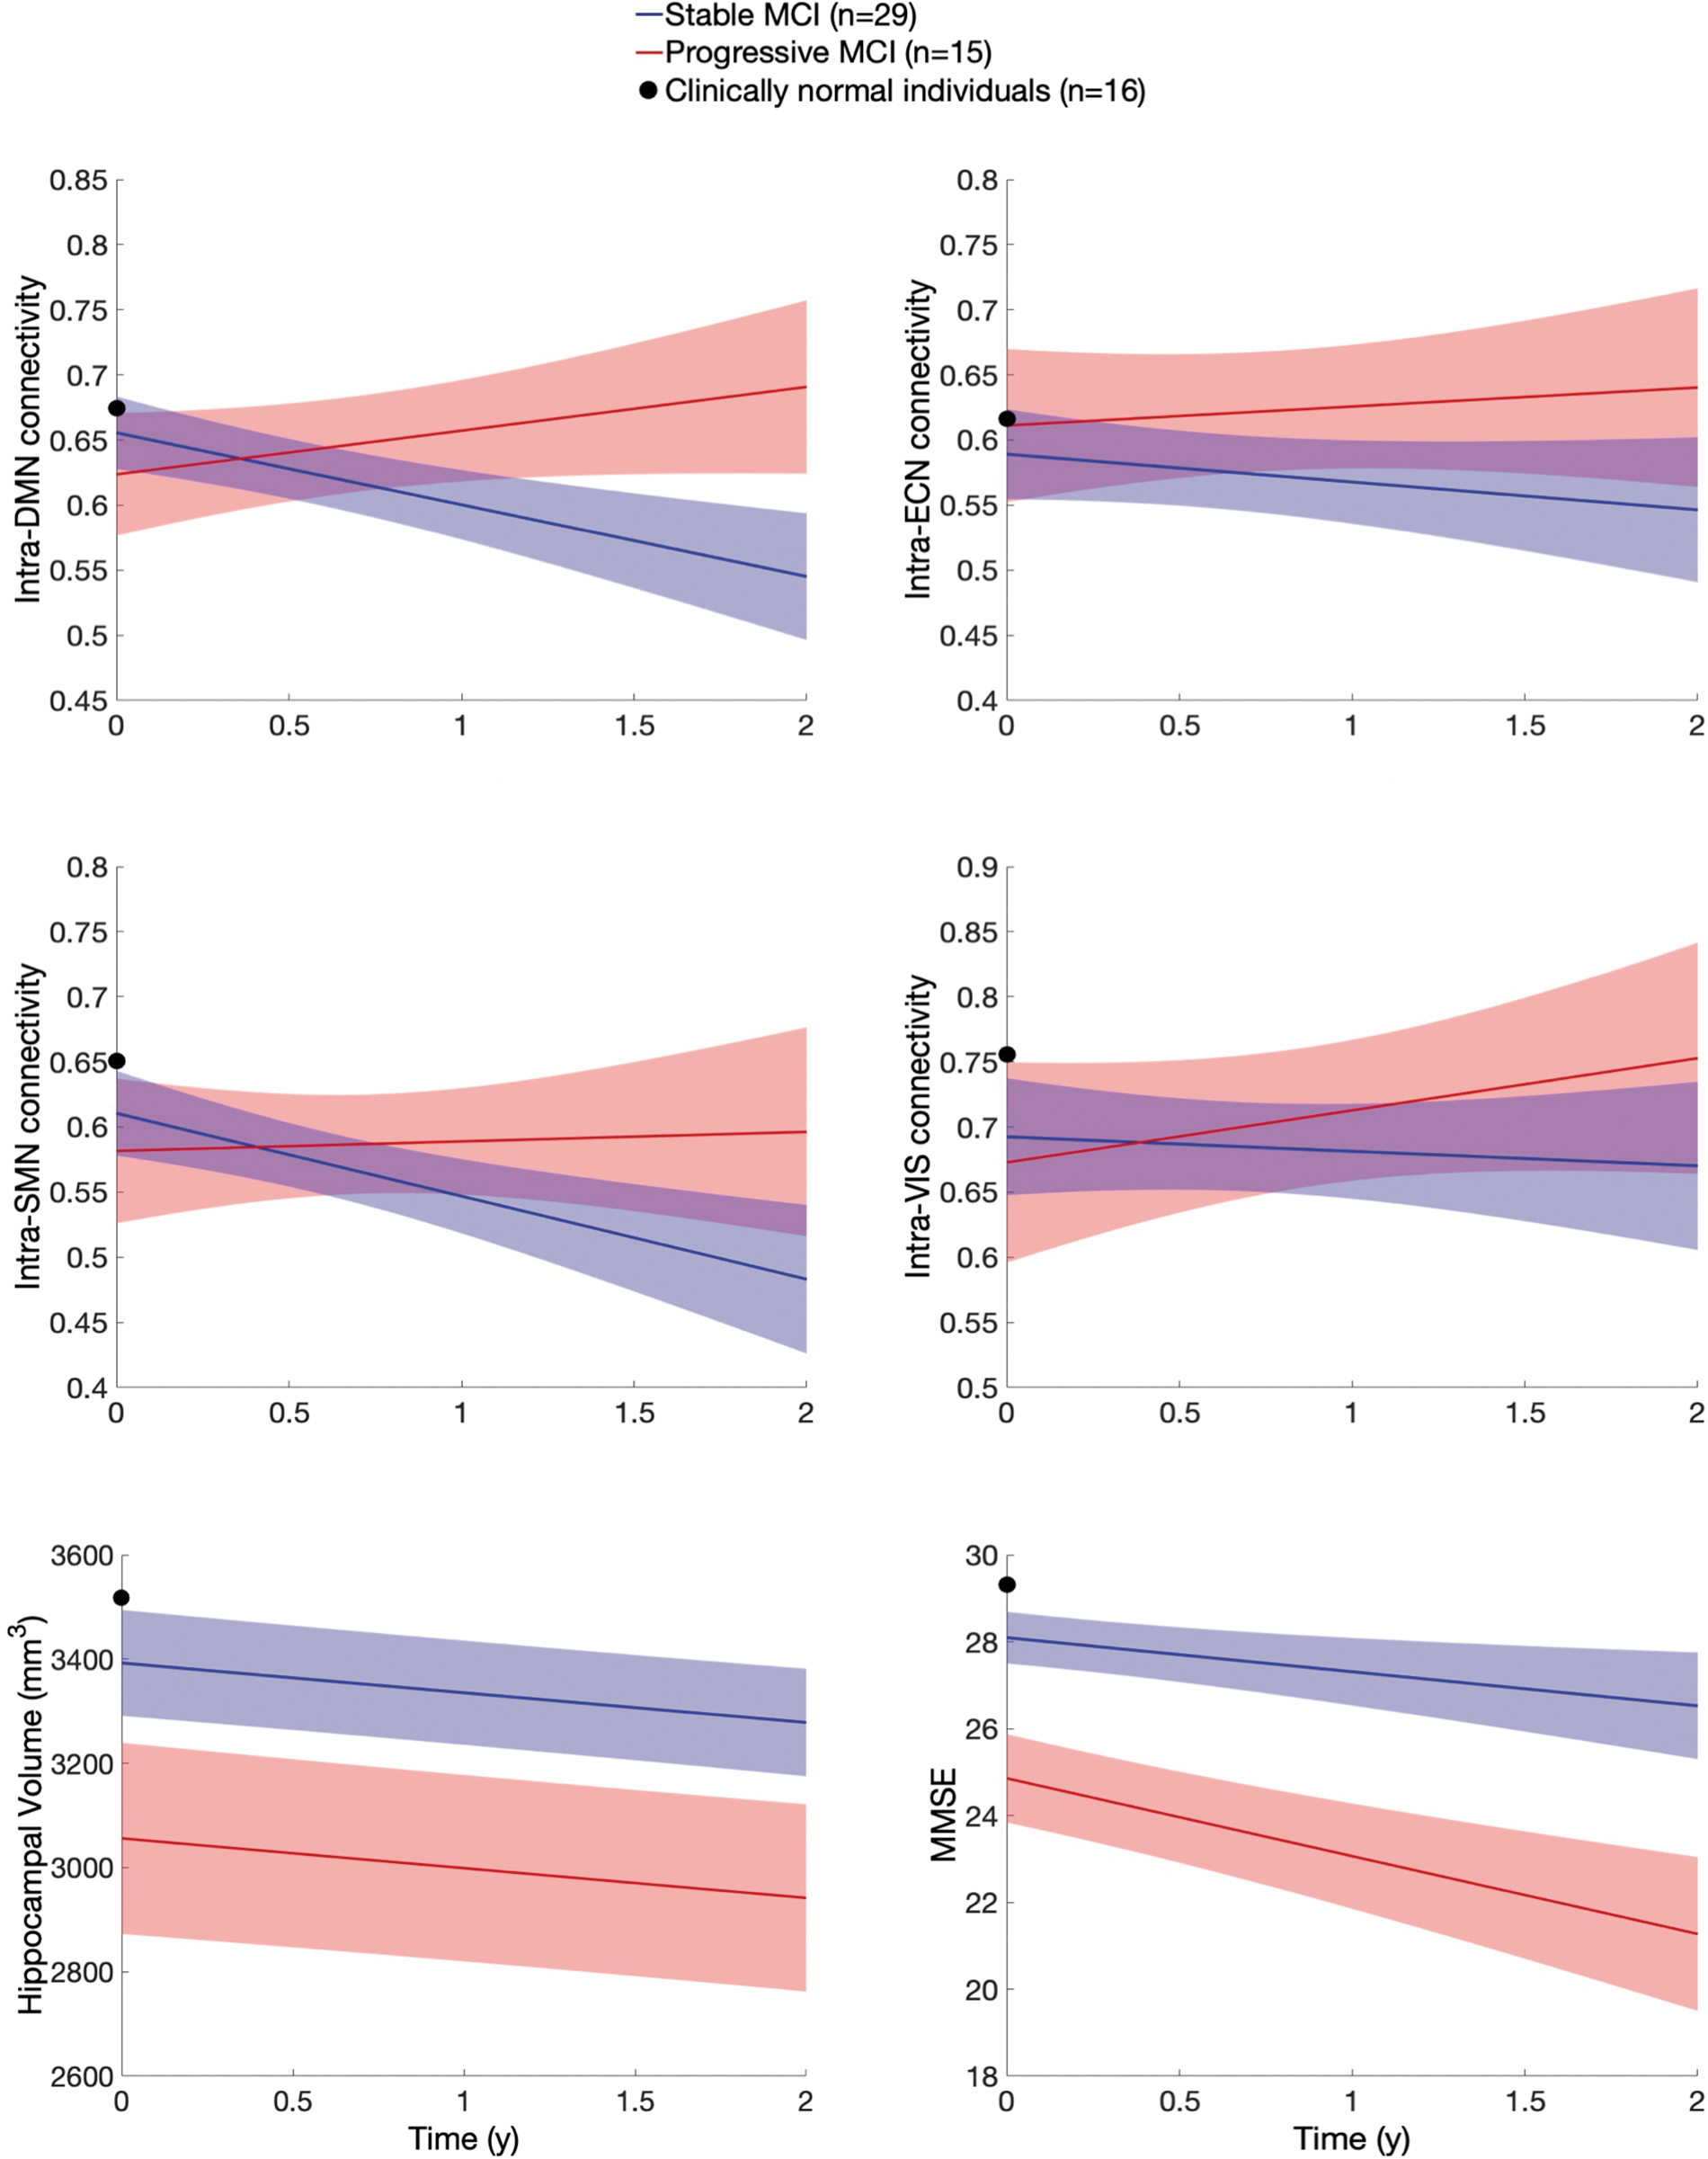
The data of MCI patients progressing to dementia (red) or remaining clinically stable (blue) is plotted over time using linear mixed-effect models. To provide a reference from a normal, control group, we have plotted the baseline data of Low-Aβ clinically normal older volunteers (black point at time = 0). These volunteers have not been followed over time with imaging. Aβ, amyloid-β; MCI, mild cognitive impairment.
Longitudinal Results
Values are β-estimates ± standard errors in linear mixed-effect models predicting resting-state connectivity over time with random intercepts and slopes. Covariates: age, sex, education, APOE status, all interacting with time. β-estimates and p-values are reported for the interactive term Time × Aβ status (left column) or Time × Progression status (right column).
p < 0.01; b p < 0.05.
Of note, hippocampal volumes and MMSE decreased significantly over time in both stable and progressive MCI, MMSE decreasing faster in progressive than in stable MCI (Fig. 1, bottom row). In contrast with progressive status, the Aβ status was not associated with changes in DMN rs-fMRI connectivity, but with a progressive increase in rs-fMRI connectivity within the SMN network in the Aβ-positive MCI (p = 0.03; Table 3), driven by a marginal difference at baseline (p = 0.09; Table 2). Using continuous Centiloid values instead of Aβ grouping provide similar results, with no changes in DMN but an increase in SMN rs-fMRI connectivity observed at higher Centiloid values.
We finally aimed to correlate changes in intra-DMN connectivity with cognition and atrophy, and evaluate the possibility that a few outliers could account for the increased connectivity observed in progressive MCI. We first observed that lower baseline MMSE predicted a future increase in intra-DMN functional connectivity (Fig. 2, top left plot), and a progressive decrease in MMSE was significantly associated with a concurrent increase in intra-DMN connectivity (Fig. 2, top right plot). We did not identify specific outliers driving this negative association. However, baseline and change in hippocampal volume were not significantly associated with functional connectivity changes (Fig. 2, bottom plots). In conclusion, increasing connectivity within the DMN in patients with MCI was associated with progressive cognitive decline and dementia diagnosis, but not with hippocampal atrophy.
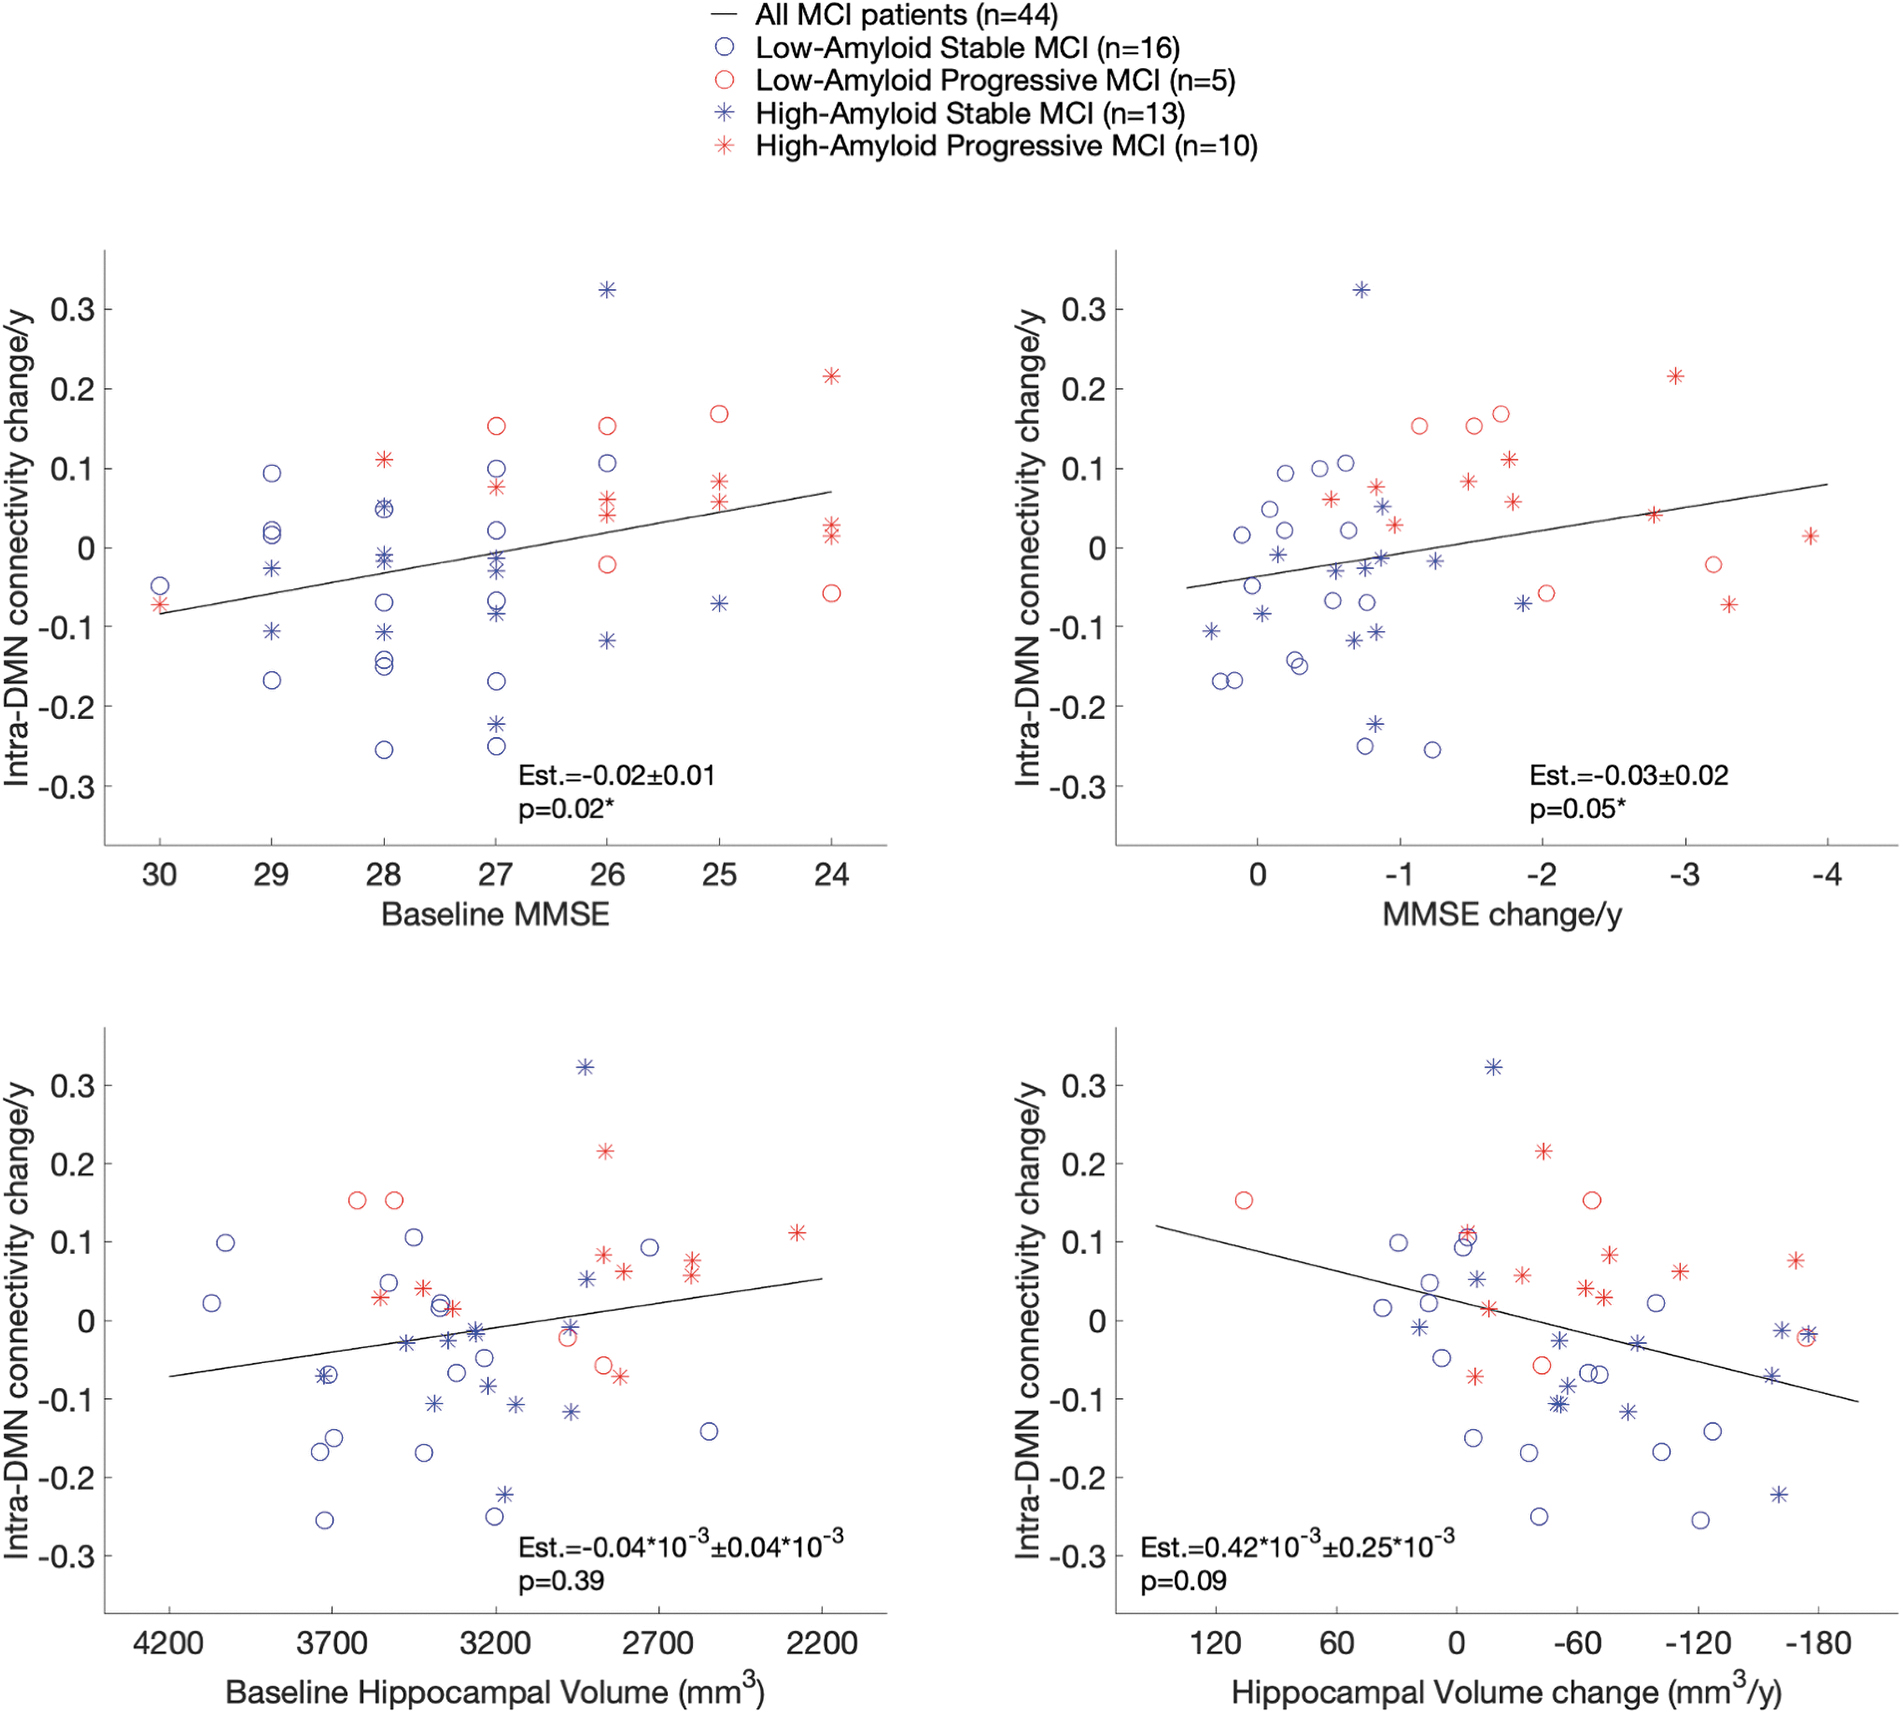
β-Estimates and p-values are computed adjusting for the dependent variable's baseline measure (e.g., baseline MMSE when predicting MMSE change). Hippocampal volume estimates are provided in mm3, using a × 10−3 factor for easy conversion in cm3. MMSE, Mini-Mental State Exam.
Discussion
In this article, we analyzed changes over time in functional connectivity in patients with MCI who either progressed to dementia or remained clinically stable. Surprisingly, we observed a progressive increase in connectivity within the DMN in the patients progressing to dementia, a result that was confirmed when repeating the analysis only in the 10 High-Aβ patients who progressed to AD dementia. In contrast, the patients who remained clinically stable 2 years after the last MRI session, including 13 High-Aβ patients, did not demonstrate such an increase in intra-DMN connectivity. The rate of changes in connectivity was also significantly associated with cross-sectional and longitudinal measures of cognitive decline, but not hippocampal atrophy. Consistent with the longitudinal observations, we observed higher DMN connectivity in the demented patients than in the stable MCI patients at the last MRI session. Besides changes within DMN connectivity, we did not observe changes within or between networks leading to significant differences between stable and progressive MCI patients.
Most of the current literature is based on cross-sectional functional connectivity studies. Initial reports observed decreased functional connectivity from the pre-clinical AD stage (Hedden et al, 2009; Sheline et al, 2010), that is, in High-Aβ CN versus Low-Aβ CN individuals. Since then, many studies have reported either decreased (Hahn et al, 2013; Li et al, 2016; Wang et al, 2013; Zhu et al, 2013) or increased brain connectivity (Esposito et al, 2013; Gardini et al, 2015; Zhang et al, 2012). Overall, the discrepancies between studies have been interpreted as a staging effect, with an increased connectivity stage occurring early in the disease course, followed by a decrease in connectivity at the dementia stage.
A compelling argument in favor of this hypothesis is the observation of increased connectivity in the DMN and SALs among High-Aβ CN individuals with low neocortical tau levels, whereas High-Aβ CN individuals with high Tau-PET signal had decreased connectivity in these networks (Schultz et al, 2017). Consistently, decreased inter-network connectivity of the DMN in pre-clinical AD was shown predictive of subsequent cognitive decline in the next few years (Buckley et al, 2017; Van Hooren et al, 2018).
In MCI patients, initial reports also indicated decreased DMN connectivity compared with CN (Agosta et al, 2012; Zhu et al, 2013) and further decrease in demented patients (Wang et al, 2015). However, other studies observed increased intra-network DMN connectivity in AD patients compared with CN (Gardini et al, 2015), suggesting that increased connectivity could appear or remain in symptomatic AD. A recent meta-analysis stated that the pattern of altered resting-state DMN function or connectivity in MCI is complex and variable across studies, concluding that no index of DMN connectivity qualifies as a useful biomarker of MCI or risk factor for AD (Eyler et al, 2019). To summarize, cross-sectional studies are not conclusive as hyper- and hypoconnectivity patterns have been observed at different stages of the disease, stressing the importance of conducting longitudinal fMRI studies to further address the issue.
To the best of our knowledge, before the present study, only two longitudinal fMRI studies were conducted in MCI patients. First, a 2-year follow-up study compared High-Aβ with Low-Aβ MCI and observed in the High-Aβ group a progressive increase in functional connectivity in the left parietal cortex, and a progressive decrease in the posterior cingulate cortex, both within the DMN network (Jovicich et al, 2019). A second 3-year follow-up study found a progressive decrease in DMN-salience connectivity in High-Aβ compared with Low-Aβ MCI (Schultz et al, 2020). Both studies classified participants by Aβ status, but the first one focused analyses on the connectivity within the DMN, whereas the second one reported results between the DMN and the SAL.
It is possible that over the course of the disease, connectivity changes differently within and between networks. Specifically, if brain activity decreases concurrently in the same set of regions (within a network), we may observe correlated activity between regions, and thus increased within network connectivity, a phenomenon that we defined as aberrant synchronization. We therefore analyzed both between- and within-network connectivity and did not observe significant changes according to Aβ status. Of note, at the final imaging session, the High-Aβ MCI patients had higher connectivity in the VIS than the Low-Aβ MCI patients, but this result was not replicated in our longitudinal analyses.
Schultz et al (2020) observed decreased connectivity between the DMN and the SAL in High-Aβ MCI, but this connectivity change was not associated with cognition or hippocampal volume. In contrast, we observed no difference in the DMN-SAL connectivity between Low and High-Aβ MCI patients, but we observed an association between increase in intra-DMN connectivity and progressive cognitive decline, suggesting that clinical progression was associated with an aberrant synchronization within the DMN. Of importance, none of these previous longitudinal studies specifically addressed the transition from MCI to AD dementia, possibly because of lower rates of clinical progression (Schultz et al, 2020) than in our sample.
Of note, Jovicich et al (2019) recruited 22 patients who progressed to dementia, all with pathological tau/Aβ ratio. Their data, just as ours, demonstrated decreasing intra-DMN connectivity in the stable, biomarkers-negative, patients (vs. the positive cases who had increased connectivity in the left parietal cortex). The different atlas used and fMRI methodology make a direct comparison of the results difficult for individual brain regions, but both their study and ours are consistent in finding increased within DMN connectivity in High-Aβ MCI progressing to AD dementia.
Different hypotheses could explain the discrepant observations in resting-state connectivity along the AD continuum. A first hypothesis stated that hyperconnectivity could result from compensatory mechanisms in response to the accumulation of Aβ plaques and/or result from a direct toxicity of Aβ (Buckner et al, 2005; Busche and Konnerth, 2015). Our results, however, argue against such interpretation as we observed increased DMN connectivity in patients who had progressed to AD dementia, and faster cognitive decline in the patients with faster connectivity increase. Therefore, increased connectivity does not seem to be restricted to early AD stages, and is also observed in the dementia stage, where tau pathology is supposedly more associated with the acceleration of cognitive impairment (Hanseeuw et al, 2019; Nelson et al, 2012).
Another hypothesis would be that an aberrant synchronization is responsible for increased connectivity over time. Indeed, a synchronous decline in brain activity in several brain regions could lead to higher brain connectivity between those regions. Because of individual variations in the brain regions affected by AD pathology, and of different methods used for delineating brain regions and networks, the correlation between time-courses in these regions could either increase or decrease, depending on the concurrent presence of brain lesions in these regions or not. Consistent with this hypothesis, brain metabolism declines in several DMN regions in MCI patients progressing to AD dementia (Landau et al, 2011). To further disentangle this issue, additional longitudinal fMRI studies, including longitudinal fluorodeoxyglucose (FDG)-positron emission tomography (PET) or tau-PET studies, would be required. Longer fMRI studies would also be helpful to track functional changes from the pre-clinical to the AD dementia stage.
Limitations of our study
We did not investigate the intra-salience connectivity network because the atlas we used only included one region-of-interest for this network preventing us to correlate the activity within the network. We did not collect longitudinal Aβ-PET or FDG-PET data to study whether a network-level increase of connectivity could be linked to changes in Aβ or in cerebral glucose metabolism. Tau-PET data are not available in this cohort for studying the impact that tau pathology has on the connectivity within and between brain networks. The relatively small sample size prevented us to fully disentangle the effects of Aβ pathology and clinical progression on connectivity changes. When replicating some analyses in High-Aβ participants only, we only had power to observe marginal, nonsignificant, results. Although our study design aimed to collect four imaging sessions in each participant, we only acquired an average of three sessions per participant.
Conclusions
We observed a progressive increase in the intra-DMN connectivity in patients progressing to dementia. This brain connectivity change was associated with cognitive decline, highlighting the potential of tracking connectivity over time to better understand the impact of AD pathology on brain function and clinical symptoms. Further longitudinal research with imaging biomarkers is needed to determine the role fMRI can play in therapeutic trials.
Footnotes
Acknowledgment
The authors thank the firm GE Healthcare Ltd. for having supplied with [18F]flutemetamol for the PET scan imaging according to a convention with our Clinic.
Authors' Contributions
Study conception and design: all. Acquisition, analysis, and interpretation of data: all. Article drafting: V.M. and B.H. Critical revision of the article for important intellectual content: all.
Author Disclosure Statement
The firm GE Healthcare supplied the [18F] Flutemetamol tracer for acquiring the PET images analyzed in this article. B.H., A.I., and R.L. disclose receiving consultant fees from GE Healthcare during the course of the project. All other authors report no conflicts of interest.
Funding Information
The Belgian Fund for Scientific Research (FNRS) provided grants for the personnel conducting this research (V.M.: No. ASP029789, B.H.: No. SPD4000041). This work was also supported by the Fonds de la Recherche Scientifique—FNRS for the FRFS-WELBIO under Grant No. 40010035, the Queen Elizabeth Medical Foundation and the Belgian Alzheimer Research Foundation.