
Abstract
Objective:
Accumulation of cerebral amyloid-β (Aβ) is a risk factor for cognitive decline and defining feature of Alzheimer's disease (AD). Aβ is implicated in brain network disruption, but the extent to which these changes correspond with observable cognitive deficits in pre-clinical AD has not been tested. This study utilized individual-specific functional parcellations to sensitively evaluate the relationship between network connectivity and cognition in adults with and without Aβ deposition.
Participants and Methods:
Cognitively unimpaired adults ages 45–85 completed amyloid positron emission tomography, resting-state-functional magnetic resonance imaging (fMRI), and neuropsychological tests of episodic memory and executive function (EF). Participants in the upper tertile of mean standard uptake value ratio were considered Aβ+ (n = 50) while others were Aβ− (n = 99). Individualized functional network parcellations were generated from resting-state fMRI data. We examined the effects of group, network, and group-by-network interactions on memory and EF.
Results:
We observed several interactions such that within the Aβ+ group, preserved network integrity (i.e., greater connectivity within specific networks) was associated with better cognition, whereas network desegregation (i.e., greater connectivity between relative to within networks) was associated with worse cognition. This dissociation was most apparent for cognitive networks (frontoparietal, dorsal and ventral attention, limbic, and default mode), with connectivity relating to EF in the Aβ+ group specifically.
Conclusions:
Using an innovative approach to constructing individual-specified resting-state functional connectomes, we were able to detect differences in brain-cognition associations in pre-clinical AD. Our findings provide novel insight into specific functional network alterations occurring in the presence of Aβ that relate to cognitive function in asymptomatic individuals.
Impact statement
Elevated cerebral amyloid-β is a biomarker of pre-clinical Alzheimer's disease (AD). Associations between amyloidosis, functional network disruption, and cognitive impairment are evident in the later stages of AD, but these effects have not been substantiated in pre-clinical AD. Using individual-specific parcellations that maximally localize functional networks, we identify network alterations that relate to cognition in pre-clinical AD that have not been previously reported. We demonstrate that these effects localize to networks implicated in cognition. Our findings suggest that there may be subtle, amyloid-related alterations in the functional connectome that are detectable in pre-clinical AD, with potential implications for cognition in asymptomatic individuals.
Introduction
Among cognitively unimpaired older adults, roughly 30% harbor elevated cerebral β-amyloid (Aβ) by age 70 years (Jack et al, 2019). The presence of abnormal Aβ levels is considered a biomarker of Alzheimer's disease (AD; Jack et al, 2018) that increases the risk of future cognitive decline and development of AD dementia (Baker et al, 2017; Jagust, 2016). One mechanism by which accumulation of Aβ might negatively impact cognition is through disruption of neural communication, which has been observed at both the structural and functional levels in cognitively unimpaired adults (Elman et al, 2016; Pereira et al, 2018). However, the extent to which Aβ-related brain network disruption is associated with subtle cognitive changes in the asymptomatic phase (i.e., pre-clinical AD) is not well understood.
The deposition of Aβ occurs preferentially in highly active, metabolically demanding, neocortical brain areas that participate in multiple functional brain networks (Buckner et al, 2005, 2009; Drzezga et al, 2011; Jagust and Mormino, 2011; Mormino et al, 2011). Therefore, there is spatial correspondence between Aβ accumulation and cortical hub regions of intrinsic functional networks that are implicated in cognition. The default mode network (DMN), which is involved in internal mentation and episodic memory (Buckner et al, 2008; Sestieri et al, 2011), shows early and targeted Aβ accumulation (Buckner et al, 2005; Jagust and Mormino, 2011; Palmqvist et al, 2017) and disrupted connectivity across the AD continuum (Badhwar et al, 2017; Eyler et al, 2019; Hedden et al, 2009; Jones et al, 2016; Mormino et al, 2011; Sheline et al, 2010; Xue et al, 2019).
However, Aβ-related network dysfunction is not limited to the DMN and instead impacts multiple networks, particularly those exhibiting high connectivity (Myers et al, 2014). In cognitively unimpaired adults, higher Aβ is associated with decreased connectivity both within and between the DMN, frontoparietal (Palmqvist et al, 2017), and salience networks (Chhatwal et al, 2018). Interestingly, emerging evidence suggests preferential degradation of networks implicated in cognition (i.e., the DMN, salience, dorsal attention, and control networks), with Aβ+ individuals exhibiting lower connectivity in these networks (Chhatwal et al, 2018). Although one study reports that cognitive network changes in Aβ+ individuals predict cognitive decline several years later (Buckley et al, 2017), the extent to which Aβ-related network alterations correspond directly to observable cognitive deficits during the pre-clinical stage has not been reported.
One obstacle to studying these effects is that alterations in functional connectivity very early in the disease course are likely to be quite subtle and thus difficult to detect. We address this challenge in the current study by using a method that maps functional regions in individual subjects, accounting for interindividual variability in network connectivity (Wang et al, 2015). This is in contrast to typical studies of connectivity where each subject's functional data are projected to a population-based atlas, requiring the base assumption that the spatial topology of functional networks is invariant across individuals. Rather than doing this, the approach used in this study maps subject-specific functional regions through an iterative reweighting process that is initially guided by a population-level network atlas and then gradually adjusts the network boundaries, allowing the individual-specific information to replace the group information.
This procedure can be conceptualized as identifying homologous brain regions in individual subjects. These subject-specific functional parcellations have been shown to be highly reliable and have been validated by invasive cortical stimulation (Li et al, 2019; Wang et al, 2015). By more accurately localizing functional regions at the individual level, we better account for the anatomical and functional heterogeneity observed in aging brains (Eavani et al, 2018; Geerligs et al, 2017), ultimately strengthening our ability to characterize early Aβ-related functional alterations. We hypothesize that using parcellations that are maximally representative of individuals' actual functional networks will increase the likelihood of detecting associations with observable behavior.
Thus, the primary aim of this study was to examine whether resting-state functional connectivity, measured in this highly individualized way, differentially relates to cognition in cognitively unimpaired adults with pre-clinical AD as defined by high brain Aβ deposition. We assessed these relationships with neuropsychological measures of episodic memory and speed/executive function (EF) as these two domains decline early in the disease course (Mortamais et al, 2017). Assuming that Aβ deposition preferentially impacts functional networks related to cognition, we expected that network connectivity would be associated with neuropsychological test performance to a greater extent in the Aβ+ than Aβ− group. Specifically, we expected that among Aβ+ individuals, altered DMN and limbic network connectivity would be most strongly associated with memory performance whereas frontoparietal, dorsal attention, and ventral attention connectivity would be associated with speed/EF.
Materials and Methods
Participants
Data were drawn from baseline assessments of community-dwelling adults aged between 45 and 85 years who were enrolled in a 2-year observational study of pre-clinical AD, which was approved by the Medical University of South Carolina institutional review board. We recently reported white matter changes in aging and pre-clinical AD in a sample of 153 participants (Benitez et al, 2022). The current sample is slightly smaller (N = 149) due to those who were missing data that were needed specifically for this study and that were excluded due to head motion during functional magnetic resonance imaging (fMRI).
As previously reported, participants had no MRI or positron emission tomography (PET) contraindications, spoke English as a first/primary language, had no history of severe/unstable conditions that affect cognition (e.g., stroke, brain cancer, seizures, serious mental illness, current alcohol or substance abuse), had no incidental findings per MRI or incomplete PET, resting-state fMRI, or neuropsychological test data, and no evidence of cognitive impairment on the Montreal Cognitive Assessment (i.e., age- and education-corrected z-score <−1 using norms from Rossetti et al, 2011).
The final sample (N = 149) were older adults (M age = 67.40, SD = 9.66) who were majority white (n = 136, 91.3%) and female (n = 104, 69.8%) with college education on average (M edu = 16.12; range: 8–25 years). Participants were categorized into an Aβ-positive pre-clinical AD group (Aβ+, n = 50, 66% female) and Aβ-negative group (Aβ−, n = 99, 72% female); this process is described in the PET Acquisition and Analysis section below. As in the previous article, the groups did not differ significantly on demographic factors, apart from age (Table 1), or medical history (Supplementary Table S1).
Sample Characteristics by Amyloid Group Status and Tests of Group Differences
Significant effects are indicated by p-values in bold.
Age was covaried in tests of group differences in network connectivity. Connectivity metrics are averages of r-to-z transformed connectivity values.
Aβ, amyloid-β; AD, Alzheimer's disease; DAT, dorsal attention; DMN, default mode network; FPN, frontoparietal network; LIM. limbic; MOT, somatomotor network; mSUVr, mean standard uptake value ratio; VAT, ventral attention network; VIS, visual network.
Neuropsychological measures
Participants completed the neuropsychological battery from the National Alzheimer's Coordinating Center Uniform Data Set Version 3.0 (Besser et al, 2018). We applied published normative equations to compute domain-specific factor Z-scores that were adjusted for age, sex, and years of education (Kiselica et al, 2020). The episodic memory factor score was computed using scores on immediate and delayed story recall and the speed/EF (speed/EF) factor was derived from scores on Trail Making Test parts A and B and phonemic fluency. Using demographically adjusted normative factor scores allows us to more accurately estimate true cognitive performance by minimizing the effects of confounding variables such as age and education level.
PET acquisition and analysis
Detailed information about PET scan (F-18 florbetapir; Amyvid™) parameters and analysis was reported previously (Benitez et al, 2022). In brief, brain cortical amyloid burden for each participant was quantified as the mean standard uptake value ratio (mSUVr). This was calculated as the nonweighted mean SUV in six cortical regions sensitive to florbetapir uptake (anterior cingulate, posterior cingulate, parietal lobe, medial orbito-frontal lobe, middle temporal lobe, and precuneus) normalized to the mean SUV of the whole cerebellum reference region (Clark et al, 2011; Dong et al, 2020; Jack et al, 2013; Jelescu et al, 2018). Participants were categorized into two groups such that those in the upper mSUVr tertile were considered to be amyloid positive and in the pre-clinical stage of AD (Aβ+; n = 50 with mSUVr ≥1.21), while all other subjects were deemed amyloid negative (Aβ−; n = 99).
This dichotomous approach is consistent with the current National Institute on Aging and Alzheimer's Association research framework (Jack et al, 2018), in which AD is categorically defined by biomarkers, with elevated amyloid indicating Alzheimer's pathologic change and thus falling on the AD continuum. The use of the upper tertile to delineate amyloid positivity is based on previously published work by both our group (Benitez et al, 2022) and others (Lowe et al, 2018; Vasilevskaya et al, 2020) that used an upper tertile to identify individuals with elevated AD biomarkers. The resulting threshold (mSUVr ≥1.21) appears to reflect significant amyloidosis as it is consistent with values observed in samples with a clinical diagnosis of mild cognitive impairment as opposed to healthy controls (Johnson et al, 2013).
fMRI acquisition, processing, and analysis
Acquisition
MRI scans were collected on a 3T Prisma MRI system using a 32-channel head coil (Siemens Medical Solutions, Erlangen, Germany). The following sequences were acquired: (1) T1-weighted 3D imaging using an MPRAGE sequence with these parameters: TR/TI/TE =2300/900/2.26 ms, FOV = 256 × 256 mm2, a generalized autocalibrating partially parallel acquisition (GRAPPA) factor of 2, voxel size 1.0 × 1.0 × 1.0 mm3; (2) two resting-state sequences were acquired (374 volumes each, 748 volumes total) using echo-planar imaging sequences with these parameters: TR/TE = 1110/30.0 ms, FOV = 192 × 192 mm2, flip angle = 65°, acceleration factor of 3, 51 interleaved axial slices, slice thickness = 3.0 mm, voxel size 3.0 × 3.0 × 3.0 mm3. In total, we collected 13.84 min of resting-state data.
Processing
Structural MRI and fMRI data were processed according to previously published pipelines (Thomas Yeo et al., 2011; Wang et al., 2015) that use a combination of FreeSurfer, FSL (Jenkinson et al, 2002; Smith et al, 2004), and SPM. For the resting-state data, this included (1) discarding the first four volumes, (2) slice timing correction using SPM2, (3) rigid-body head motion correction using FSL, (4) normalization for global mean signal intensity, (5) bandpass temporal filtering (0.01–0.08 Hz), and (6) regression of spurious variance and their derivatives, including head motion parameters, mean signal from whole-brain, white matter, and ventricular cerebrospinal fluid. Volumes were not censored based on head motion.
Data included in this analysis did not demonstrate high levels of head motion, defined as mean framewise displacement (FD) >0.30 and >20% of volumes with FD >0.50. In the remaining sample, mean FD across runs was 0.14 (SD = 0.08). For the T1-weighted structural images, processing included (1) intensity normalization and (2) reconstruction of surface mesh representations of the cortex that were registered to a common spherical coordinate system.
Analysis
The method for generating individual-level functional parcellations has been described in detail previously (Wang et al, 2015) and is depicted in Figure 1. First, structural and functional images were aligned using boundary-based registration via the FsFast software package; the preprocessed resting-state fMRI data were aligned to the common spherical coordinate system and smoothed with a 6-mm full-width half-maximum smoothing kernel in the surface space; and the preprocessed data were then down-sampled to the FreeSurfer fsaverage6 surface space with 40,962 vertices in each hemisphere (Fig. 1A).
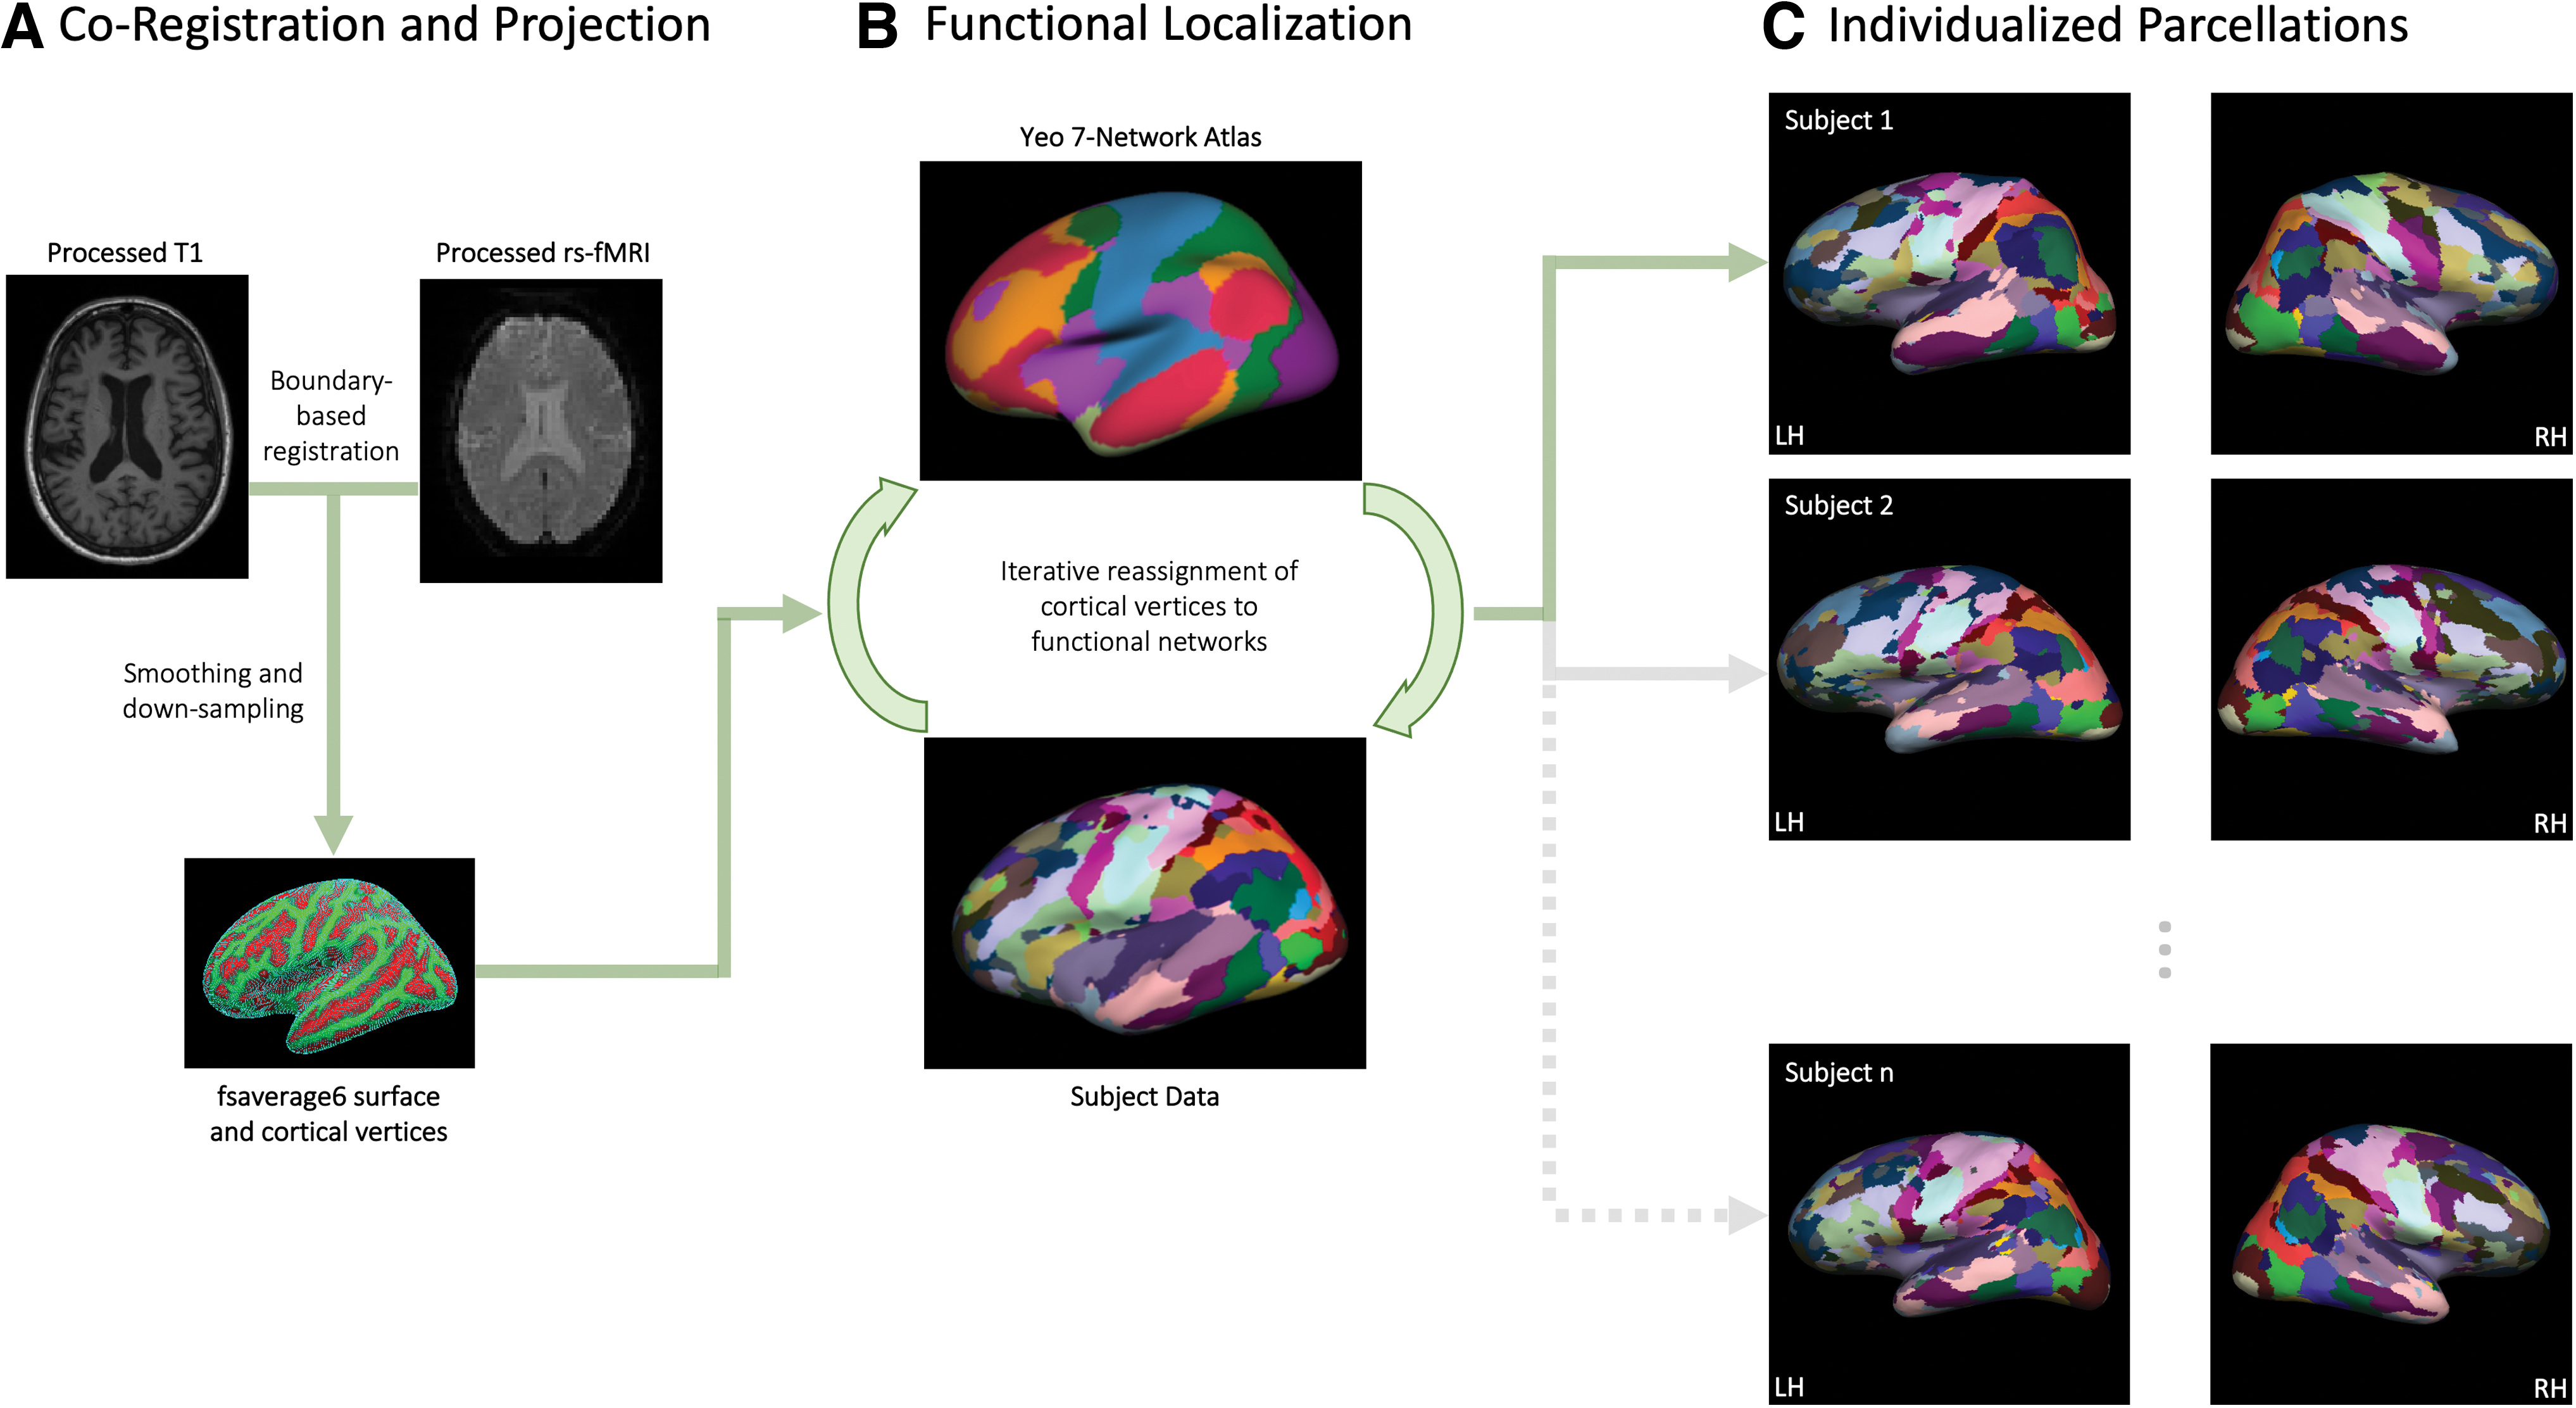
Analysis pipeline for generating individualized functional parcellations. This process is described in detail in the Materials and Methods section and involves
Next, an iterative process was used to optimize functional localization (Fig. 1B), which involves (1) registering a population-based functional brain atlas (Thomas Yeo et al, 2011) to each participant's fsaverage6 cortical surface space, (2) averaging blood-oxygen-level-dependent (BOLD) signal across vertices falling within each of the seven networks from the Yeo atlas, which then serve as reference signals, (3) reassigning each vertex to one of the seven networks based on the maximum correlation between its BOLD signal and the reference (network) signal, (4) generating a core signal for each network by averaging the BOLD signal across only vertices with high confidence values, based on the ratio between its largest and second largest correlation with reference networks, and (5) calculating an updated reference signal by taking a weighted average of the reference and core signals as well as estimates of intersubject variability, signal to noise ratio, and number of iterations.
This process of iteratively reassigning vertices to the seven networks is repeated until a stopping criterion is met that indicates stability of network membership. This resulted in individualized functional parcellations (Fig. 1C) containing 92 regions of interest belonging to seven networks: visual (VIS), somatomotor (MOT), dorsal attention (DAT), ventral attention (VAT), limbic (LIM), default mode (DMN), and frontoparietal (FPN).
Computing functional connectivity metrics
Functional connectivity was calculated as the Pearson correlation (r) between the time courses of each individually localized node pair identified in the previous step, resulting in a 92-node × 92-node fully connected matrix for each participant. Correlation coefficients were then normalized within-participant using Fisher's r-to-z transformation. Within-network connectivity of each of the seven networks was calculated by averaging the connectivity values of constituent nodes. Between-network connectivity was calculated in the same way but for nodes belonging to each network pair (21 pairs). In addition, we included a metric of network desegregation given that previous work has found network dedifferentiation to be characteristic of aging (Koen et al 2020), exacerbated in AD, and related to worse cognition (Maass et al, 2019; Meeker et al, 2020).
Network desegregation takes into account both within- and between-network connectivity, offering a more comprehensive measure of internetwork relationships. It was calculated from the system segregation metric (SyS; Chan et al, 2014) as: SyS = (mean within-network connectivity − mean between-network connectivity)/mean within-network connectivity. In this study, desegregation is defined as the SyS value multiplied by −1. These calculations were also done for cognitive networks specifically (i.e., DMN, FPN, LIM, DAT, and VAT), to quantify average connectivity within and between cognitive networks as well as desegregation among cognitive networks.
Statistical analyses
Each variable was assessed for normality using Shapiro–Wilk tests. Two participants had speed/EF factor scores that were statistical outliers (>−3 SD); these were winsorized to the value associated with −3 SD and were checked to ensure that they did not exert undue influence on the regression analyses using Cook's Distance. Independent samples t-tests, or Mann–Whitney U tests for non-normally distributed variables, were used to examine group differences in demographic and medical variables, cognitive factor scores, and connectivity metrics (Table 1 and Supplementary Table S1). Since the Aβ+ group was significantly older than the Aβ− group, age was included as a covariate in all subsequent analyses. Analysis of covariance was used to test for group differences in connectivity metrics, controlling for age.
General linear models were used to assess the main effects of network connectivity and group-by-network interaction effects on memory and speed/EF factor scores separately, each controlling for age. For this, we used Z-standardized variables to produce standardized beta estimates with comparable units across models. Significant interaction effects were probed using simple slopes analyses to determine the direction and significance of association between connectivity and cognition in each group. False discovery rate (FDR) correction was used to adjust for multiple comparisons for the linear models, and adjusted p-values were considered significant at alpha ≤0.05. This was done separately for each outcome variable (i.e., 34 p-values for memory and 34 p-values for speed/EF), first for interaction effects and then for main effects in any models without significant interactions.
Given the preliminary nature of this study and the modest sample size, we focused our interpretations on effect sizes as these will be most informative for guiding future studies.
Results
No group differences in cognition and connectivity
Sample characteristics and tests of group differences are presented in Table 1. The Aβ+ group was older on average (M age = 72.50 years, SD = 7.25) than the Aβ− group (M age = 64.82 years, SD = 9.70, p < 0.001). The two groups did not differ on other demographic variables (i.e., years of education, sex, or race) or average in-scanner head motion. There were no significant differences in average memory or speed/EF performance between groups, and scores were within roughly 1 SD of the normative mean, consistent with the criterion that participants be cognitively unimpaired at enrollment. Nonetheless, there was a wide range of individual differences in memory and speed/EF performance in both groups, which is to be expected when sampling cognitive performance from the general population, with some individuals performing considerably lower than expected compared to demographically matched normative samples. Despite the lack of significant group differences, median memory and speed/EF scores for the Aβ− group were within 1 SD of the normative mean whereas median scores for the Aβ+ group were lower, falling <−1 SD in both domains. There were also no significant group differences in functional connectivity metrics (i.e., within-network, between-network, or desegregation) or medical history variables (Supplementary Table S1).
Differential associations between network connectivity and speed/EF
Results for the significant general linear model effects and simple slopes analyses for the speed/EF outcome are presented in Table 2. The majority of effects were for speed/EF, with small to medium effect sizes (η 2 p = 0.03–0.05). Notably, these were mostly group-by-network interactions that involved cognitive networks either alone (VAT, LIM, DMN) or in composite form (aggregate of DMN, FPN, LIM, DAT, and VAT connectivity). Simple slopes analyses (“B” in Table 2) showed that these interaction effects were driven by the Aβ+ group. Generally, higher within-network connectivity was associated with better speed/EF (Fig. 2A), whereas greater between-network connectivity and network desegregation (i.e., greater between- relative to within-network connectivity) was related to worse speed/EF performance (Fig. 2B).
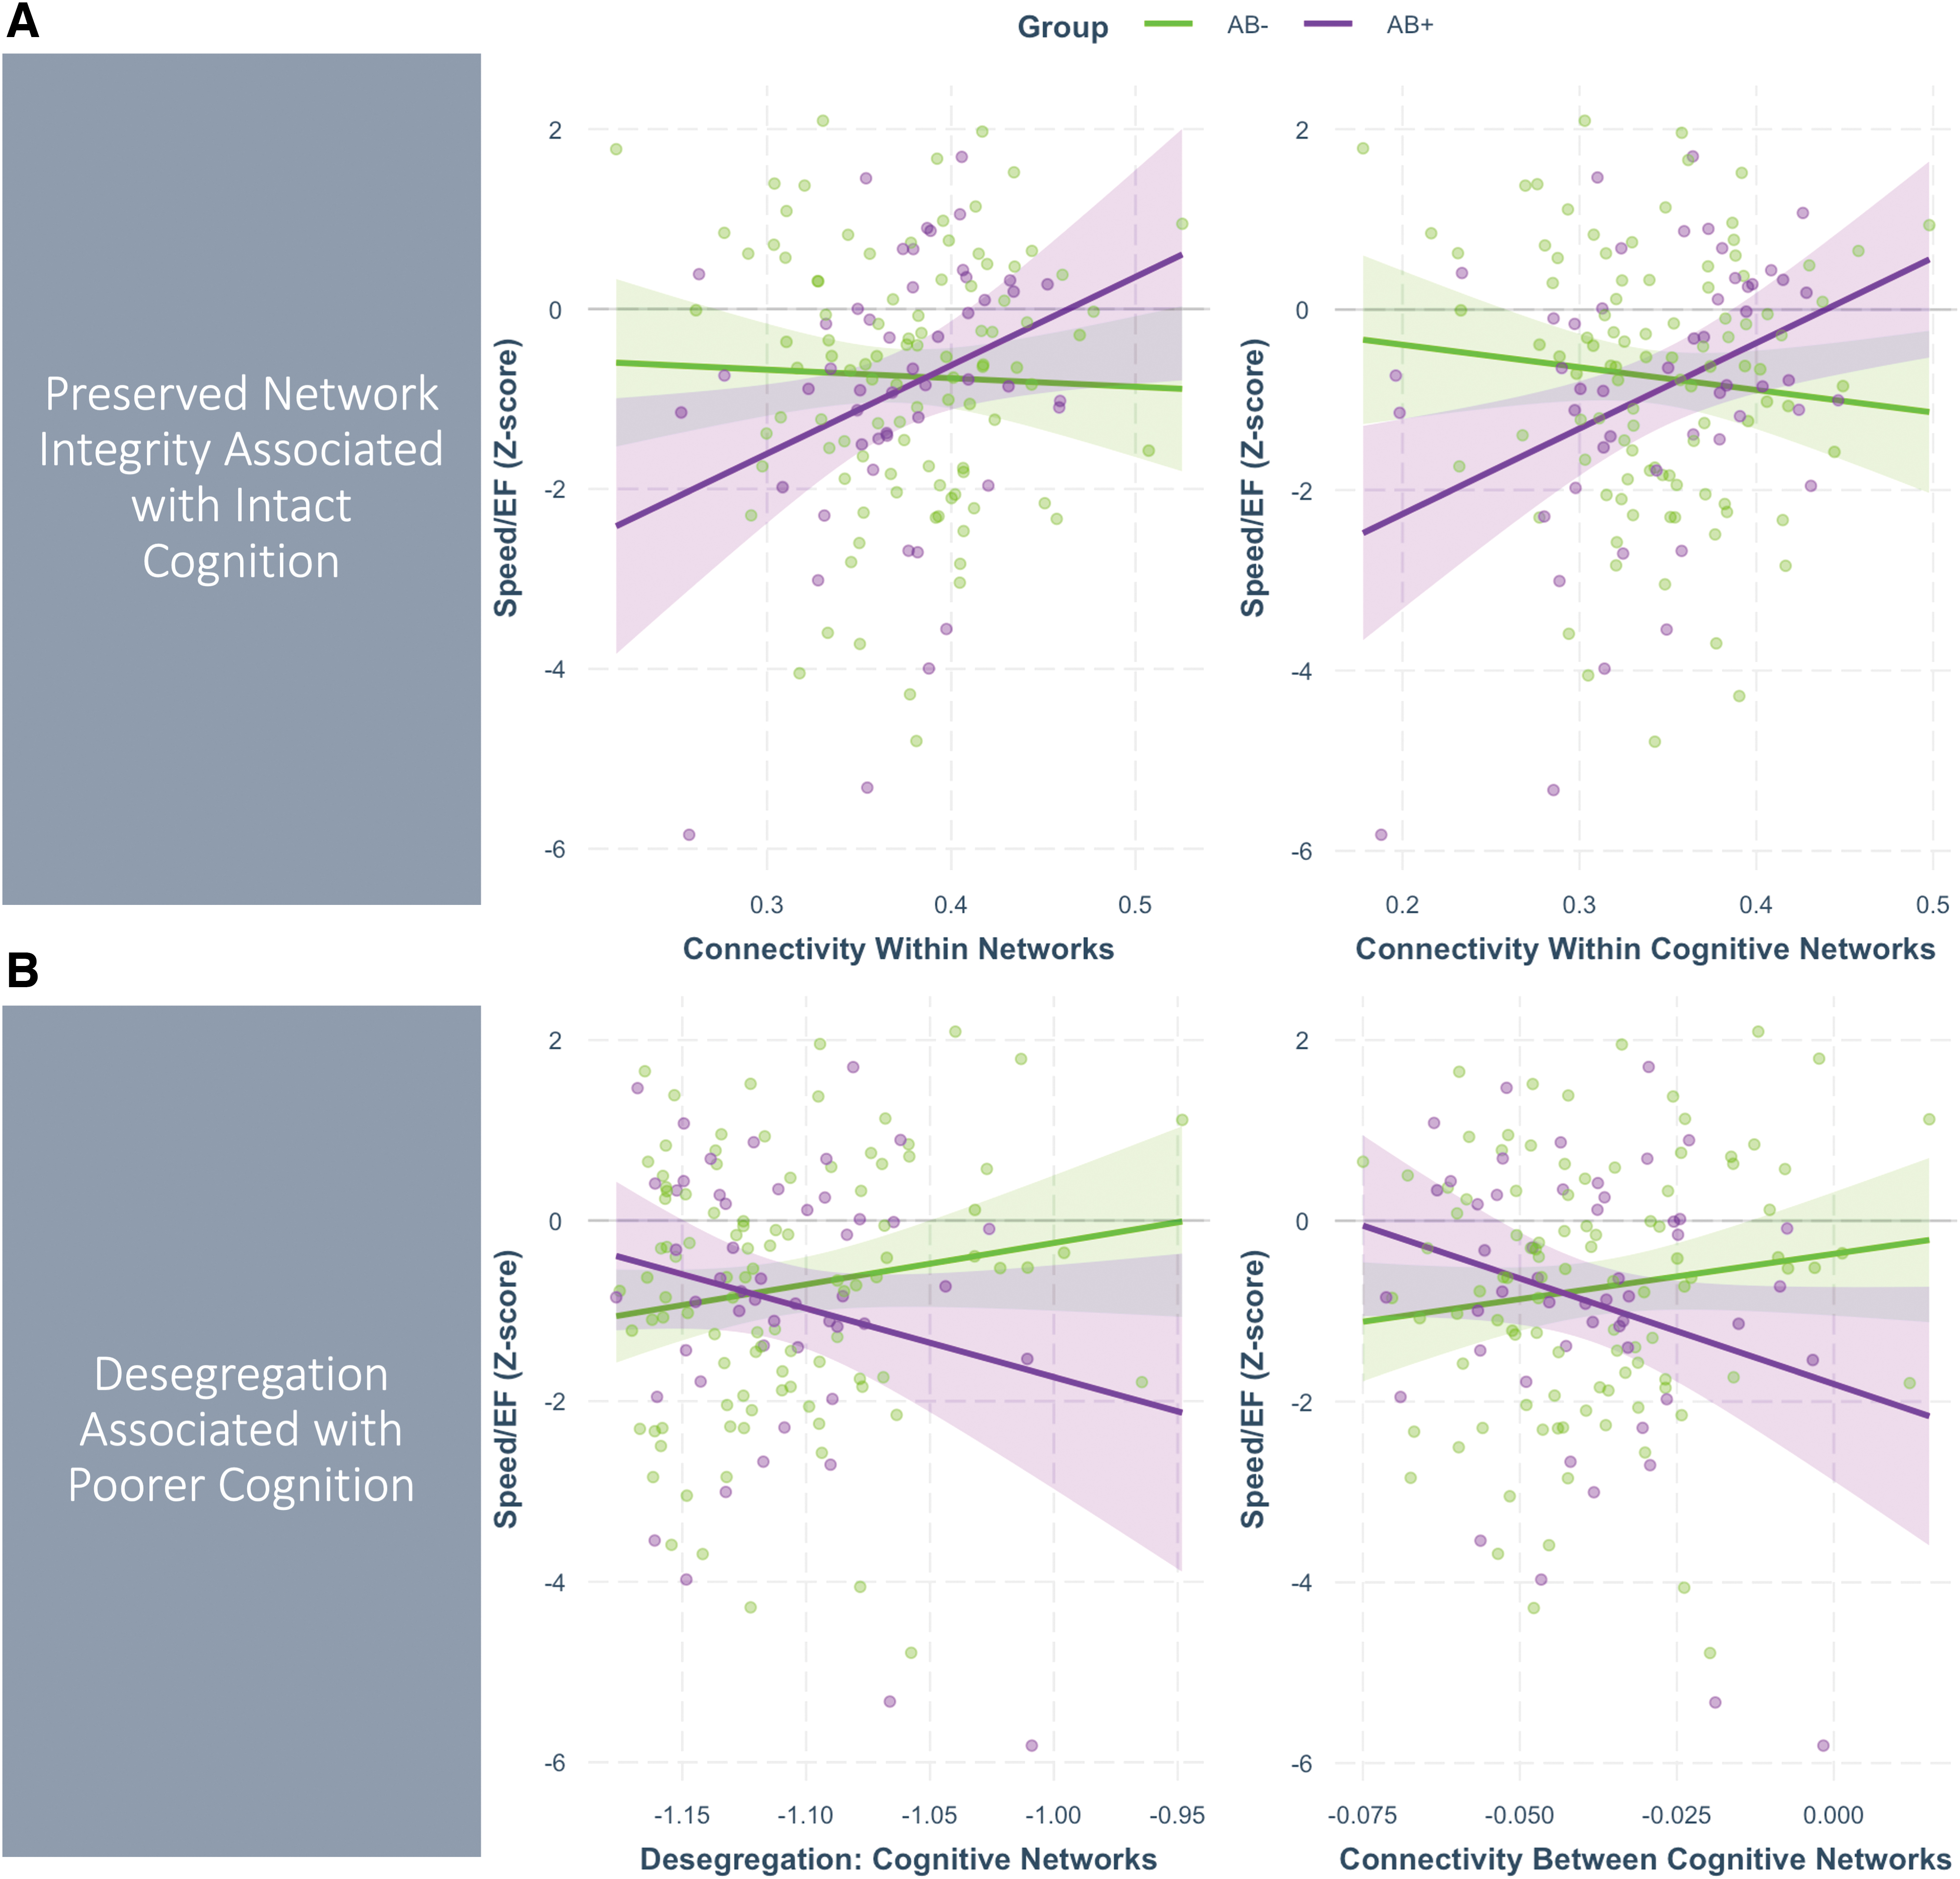
Group-by-network interaction effects on speed/executive function. Plots show regression lines for the effect of network connectivity (Z-standardized, x-axis) on Speed/EF factor scores (y-axis) for the Aβ− group (green) and Aβ+ group (purple). Points represent the partial residuals (i.e., covarying age), and the 95% confidence intervals around the regression lines are represented by shaded areas.
Significant Effects of Network Connectivity and Group × Connectivity Interactions on Cognition
Beta values are standardized. Reported p-values are not adjusted for multiple comparisons. Results are ordered from strongest to weakest effect size per network metric category. “Cognitive Networks” refers to composite connectivity within cognitive networks (i.e., default mode, frontoparietal, limbic, dorsal attention, and ventral attention networks).
p ≤ 0.10, * p ≤ 0.05, ** p ≤ 0.01.
EF, executive function.
We observed several group-by-network interactions that indicated differential associations between within-cognitive-network connectivity and speed/EF across groups. Specifically, greater connectivity within cognitive networks was related to better speed/EF in the Aβ+ group, but was not significantly related to performance in the Aβ− group (medium effect size: η 2 p = 0.05, p = 0.006). This pattern was also true for average connectivity within all networks (p = 0.041) and connectivity within the VAT (p = 0.025), DMN (p = 0.026), and LIM (p = 0.035) networks individually, with small-medium effect sizes (η 2 p 's = 0.03). All of these effects marginally survived correction for multiple comparisons (FDR adjusted p's = 0.14–0.15).
Conversely, greater connectivity between cognitive networks (p = 0.029) and desegregation of cognitive networks (i.e., higher connectivity between relative to within cognitive networks; p = 0.052) was related to worse speed/EF in the Aβ+ group. Both effects were small-medium (η 2 p 's = 0.03) and marginally survived correction for multiple comparisons (FDR p's = 0.14–0.15). Similar effects were observed for connectivity between a few specific cognitive networks, with worse speed/EF in the AB+ group related to greater VAT-LIM (p = 0.010) and VAT-DMN (p = 0.015) connectivity, with medium effect sizes and marginal FDR-adjusted p-values (FDR p's = 0.14).
These effects suggest that a breakdown in the typical structure of communication among cognitive networks, reflected in greater between-network connectivity and between- relative to within-network connectivity, appears to be specifically related to worse performance on cognitive tests in AB+ individuals. There were only two main effects of network connectivity on speed/EF, but these were considerably weaker (β’s = 0.17) than all other interaction effects (β's >0.35) and did not survive correction for multiple comparisons (FDR p's > 0.52).
Fewer and more modest effects of network connectivity on memory
Results for the significant general linear model effects and simple slopes analyses for the memory outcome are presented in Table 2. The strongest effect was a group-by-network interaction for connectivity between VAT and LIM networks, with a medium effect size (η 2 p = 0.06) and marginally surviving correction for multiple comparisons (p = 0.002, FDR p = 0.08). Simple slopes analyses revealed that greater connectivity between these cognitive networks was associated with worse memory for the Aβ+ group (p = 0.016), but not the Aβ− group (p = 0.066). Although we did not observe a significant effect for the desegregation metric itself for memory, this is consistent with the pattern reported above supporting a link between network desegregation (in this case just elevated between-network connectivity) and worse performance on cognitive tests for Aβ+ participants.
There were several additional effects for memory that were significant but did not survive correction for multiple comparisons, including a main effect for VIS-MOT (p = 0.017, FDR p = 0.56) and two group-by-network interactions (VIS-FPN: p = 0.012, FDR p = 0.13; MOT-DAT: p = 0.010, FDR p = 0.13).
Effects remain in age-matched sensitivity analyses
In addition to statistically controlling for age in the results presented above, we conducted sensitivity analyses on age-matched Aβ+ and Aβ− groups. To do so, we used a 1:1 nearest neighbor-matching approach, in which each participant in the target group (from the Aβ+ group) is paired with a control participant (from the Aβ− group) with the closest age value. This resulted in retaining all 50 Aβ+ participants and creating a matched subgroup of 50 Aβ− participants. Using these samples, we replicated the above analyses without including age as a covariate and found that all reported effects remained statistically significant.
Discussion
This study evaluated the relationship between functional connectivity, measured using individualized functional connectomes, and cognition in cognitively unimpaired adults with and without Aβ deposition. Use of this innovative parcellation method, which more sensitively and precisely captures functional architecture at the subject-specific level, allowed us to detect several group-by-network interactions with moderate effect sizes. This revealed a pattern of effects wherein for Aβ+ individuals, preserved network integrity was associated with better cognition and greater network desegregation was associated with worse cognition, primarily on measures of speed/EF. Thus, we provide novel evidence of associations between network alterations and cognition specifically within asymptomatic adults harboring Aβ (i.e., pre-clinical AD).
We found evidence that connectivity is differentially associated with cognition in Aβ+ versus Aβ− individuals despite there being no significant group differences in connectivity metrics or performance on tests of episodic memory or speed/EF. The largest and most consistent effects were interactions indicating that connectivity involving cognitive networks (i.e., DMN, FPN, LIM, DAT, and VAT) was related to speed/EF performance in the Aβ+ group.
Two patterns were observed. First, greater connectivity within cognitive networks was associated with better performance in Aβ+ individuals, whereas there were no significant associations in the Aβ− group. This suggests that stronger connectivity within each of these cognitive networks individually and in the aggregate (reflecting greater network integrity; Dennis and Thompson, 2014) is related to better speed/EF abilities for individuals harboring Aβ. Second, connectivity between cognitive networks and desegregation of cognitive networks were differentially associated with cognitive test performance across groups. The interactions were such that both between-cognitive-network connectivity and desegregation among cognitive networks were related to worse cognitive test performance for Aβ+ individuals, but not those who were Aβ−. This suggests that stronger connectivity between different cognitive networks and greater connectivity between relative to within them, indicating loss of network specialization (Chan et al, 2014), was associated with lower speed/EF scores in the presence of Aβ.
These results are a snapshot of what is likely a complex progression of functional reorganization in AD. Previous work has suggested that there are stages of early hyperconnectivity in the presence of initial Aβ accumulation, potentially reflecting compensatory functional reorganization, followed by hypoconnectivity at higher levels of AD pathology (Mormino et al, 2011; Schultz et al, 2017). The cascading network failure model of AD, proposed by Jones et al (2016, 2017), may be particularly helpful for interpreting our results. Within this framework, brain regions that are highly active and that experience high processing demands may be first to become susceptible to AD-related pathology, which initiates a shifting of processing load to downstream functionally connected hubs. Amyloidosis and tau-associated neurodegeneration are thought to be accelerated in the context of an increased processing load that exceeds compensatory reserves, posing high metabolic demands. Importantly, the metric of network failure used in this model is quantified as greater connectivity between than within regions (Jones et al, 2017; Wiepert et al, 2017), which maps onto the desegregation metric used in the current analyses.
Although our cross-sectional study cannot speak to causal relationships, it appears that our finding of an association between network desegregation and cognitive deficits in Aβ+ individuals may reflect evidence of these cascading network failures in the presence of elevated amyloid. Conversely, our observation of a positive association between higher within-network connectivity and better cognitive performance in the Aβ+ group could reflect either the preservation of healthy network structure (i.e., normal coherence among regions within a network) or signs of compensatory increases in connectivity (i.e., hyperconnectivity) in networks that have not yet failed.
Interestingly, we did not observe significant differences in network connectivity metrics across groups. The lack of such differences likely reflects the fact that the Aβ+ group is in the very earliest stages of AD, in which disease burden is low and thus network disruption is expected to be quite subtle. Thus, there may not be discernable group differences in these metrics in this disease stage or we might be underpowered to detect them with the current sample sizes. Nonetheless, we were able to demonstrate moderately sized brain-behavior associations and our results indicate that connectivity appears to only be associated with cognition for those in a disease state. This suggests that certain patterns of connectivity (e.g., desegregation) are a potentially important indicator of cognitive dysfunction in the presence of disease.
The majority of our results localized to cognitive networks in the Aβ+ group, which is consistent with prior evidence of preferential degradation of cognitive networks in AD. Specifically, Chhatwal et al (2018) evaluated connectivity changes across stages of the AD continuum, finding a pattern of cognitive-network-specific decreased connectivity in those with symptomatic AD and pre-clinical AD (i.e., cognitively unimpaired with positive AD biomarkers) but a much more diffuse pattern of network degradation in normal aging. Similarly, Buckley et al (2017) found that baseline connectivity in cognitive networks, but not noncognitive networks (i.e., VIS or MOT networks), predicted longitudinal decline in global cognition over 3 years. Further, they observed that lower DMN, FPN, and salience network connectivity interacted with Aβ to predict the steepest decline in cognition. Thus, our findings add to accumulating evidence that early Aβ-related network disruption is most apparent in networks implicated in higher order cognition.
When evaluating cognitive networks in the present study, we found that effects were slightly stronger for the aggregate measure of cognitive networks than individual networks alone. However, the association between better speed/EF in Aβ+ individuals and preserved within-network connectivity appeared to be driven by the VAT, LIM, and DMN networks. The finding involving the DMN, specifically, is consistent with the extensive literature documenting overlap between the DMN and patterns of AD pathology (Buckner et al, 2005; Jagust and Mormino, 2011), early signs of amyloid accumulation in the DMN (Palmqvist et al, 2017), and disrupted DMN connectivity across the AD continuum (Badhwar et al, 2017; Eyler et al, 2019; Jones et al, 2016; Xue et al, 2019).
Several previous studies have demonstrated altered DMN connectivity in cognitively unimpaired adults with high amyloid (Hedden et al, 2009; Mormino et al, 2011; Sheline et al, 2010) and associations between DMN connectivity and memory in aging, pre-clinical AD, amnestic mild cognitive impairment, and AD (Ji et al, 2019; Jones et al, 2016). Our results expand upon this to suggest that poorer integrity not only of the DMN, but other cognitive networks as well, may be implicated in worse cognitive performance in pre-clinical AD.
Further, while many previous studies focused solely on single networks, by using a broader approach that considered all functional networks, our results suggest that subtle differences in connectivity-cognition relationships in Aβ+ versus Aβ− individuals might be best captured by aggregate measures of connectivity in multiple networks. This is consistent with evidence that AD is a multinetwork disease characterized by a loss of connectivity both within and between multiple networks (Brier et al, 2012).
One unique aspect of this study is that we go beyond the previously reported evidence of network alterations in the presence of Aβ by revealing specific associations between network connectivity and cognitive test performance in clinically normal Aβ+ adults which, to our knowledge, has not yet been reported. Although individuals with pre-clinical AD are, by definition, cognitively unimpaired, certain aspects of cognition begin to diverge from normal even in this asymptomatic stage. We focus on episodic memory and EF since these two domains show the earliest changes in the course of AD (Mortamais et al, 2017) and greatest declines in cognitively unimpaired adults with elevated Aβ (Lim et al, 2014; Lim et al, 2013; Petersen et al, 2016), thus increasing our chances of observing connectivity-cognition associations in pre-clinical AD if they exist.
We did not observe any significant group differences in memory or speed/EF, but connectivity was differentially associated with performance in both cognitive domains, with most group-by-network interactions localizing to speed/EF in the Aβ+ group rather than memory. This suggests that, although processing speed is known to decrease with age, this cognitive domain may also be particularly susceptible to early Aβ-related functional network disruption and a sensitive indicator of the inflection point between typical aging and pre-clinical AD. Thus, efforts toward developing neuropsychological tools to detect cognitive changes associated with pre-clinical AD should include measures of speed/EF in addition to memory.
The effects observed in this study were all small-to-medium in size, which is to be expected given the subtlety of early AD-related changes in both brain networks and cognition in this otherwise healthy, cognitively unimpaired sample. These modest effects are inherently difficult to detect, which may be the reason that no previous studies have reported on the associations between network disruption and cognition in pre-clinical AD. However, the use of more refined methods, namely individual-specific functional parcellations (Wang et al, 2015), revealed several group-by-network interactions on cognition. Our ability to detect these effects was likely bolstered by the highly accurate localization of functional regions on the individual level while accounting for the inherent variability in network connectivity observed across individuals and minimizing the influence of anatomical and functional heterogeneity observed with aging and neurodegenerative disease.
This method has been used with similar success in several other clinical populations, including depression (Zhao et al, 2022), obsessive-compulsive disorder (Brennan et al, 2019), schizophrenia, and psychosis (Fan et al, 2021a; Fan et al, 2021b; Wang et al, 2020), and to predict fluid intelligence (Li et al, 2019). However, the subtlety of the effects observed in this study suggests that resting-state functional connectivity may not be a powerful diagnostic biomarker of pre-clinical AD. Given the preliminary nature of this study, and the fact that more conservative multiple comparisons correction rendered the effects nonsignificant, future studies are needed to replicate these findings. Nonetheless, the observed effect sizes are nontrivial and bode well for future attempts at replication.
In addition to the limitations of this study discussed so far, an important direction for future work is to consider AD biomarkers not included in this study, such as measures of neurodegeneration and tau (Jack et al, 2018). Tau may be of particular importance for future studies attempting to elucidate the nature of early disease-related functional alterations as it differs from Aβ in spatial distribution, coinciding largely with cognitive networks (Hansson et al, 2017), and has unique associations with cognition (Pereira et al, 2019). Further, emerging evidence has revealed that AD pathogenesis involves interactions between brain network dynamics, the deposition and propagation of tau, and accumulation of Aβ (Franzmeier et al, 2019; Jones et al, 2017; Wu et al, 2016).
Given the cross-sectional design of this study, these findings cannot be used to infer a causal link between Aβ deposition, altered connectivity, and cognitive decrements. We cannot rule out selection bias and other unknown third variables in this convenience sample that could be contributing to the observed effects. Future studies that concurrently measure changes in cognition, connectivity, and biomarker accumulation/disease progression are needed to provide causal evidence. Relatedly, while this study treated amyloid status dichotomously as is very common in this literature, future work could explore different ways to parameterize amyloid continuously that overcome the challenges of its heteroscedastic distribution.
These results should also be considered with the caveat that our sample was majority white, highly educated, and female, which limits the generalizability of our findings to other groups that are more heterogeneous in terms of sex/gender, race/ethnicity, and educational history. This may have also placed an upper limit on our ability to detect effects given that this sample likely had high cognitive reserve, which has been associated with preserved cognition (Vemuri et al, 2011) and brain features such as connectivity (Franzmeier et al, 2017).
Conclusions
In summary, this study assessed the relationships between resting-state functional connectivity and cognition in cognitively unimpaired Aβ+ and Aβ− adults. We utilized an innovative approach to defining individual-specific network parcellations that accounts for interindividual differences in functional topology, which allowed us to maximize the sensitivity of our analysis to the subtle effects that are present in the pre-clinical AD stage. We found that disruption of connectivity among cognitive networks in adults harboring elevated Aβ is associated with worse performance on tests of speed/EF. These results suggest that there may be AD-related alterations in the functional connectome present in this early, pre-clinical phase that may have implications for cognition even in clinically normal, asymptomatic individuals. Future work can determine the prognostic utility of these functional network changes when predicting cognitive decline and progression along the AD continuum.
Footnotes
Acknowledgments
We acknowledge Dr. Emmi Scott, Dr. Jacobo Mintzer, Ms. Mallory Gillen, Ms. Jennifer Sessions, Ms. Katrina Madden, Ms. Holly Fleischmann, Mr. Ian Cromwell, Ms. Laura Lohnes, Ms. Ericah Kerley, Ms. Olivia Horn, and Ms. Darby Watford for their help with participant recruitment, data collection, and data entry in support of this project. Importantly, we offer our utmost appreciation to all our participants whose enthusiasm for research has carried them and us through this study despite the many challenges of the pandemic.
Authors' Contributions
S.F.-Z.: Conceptualization, Formal Analysis, Data Curation, Writing—Original Draft, and Visualization. H.L.: Methodology, Formal Analysis, Funding Acquisition, and Writing—Review and Editing. A.B.: Conceptualization, Project Administration, Supervision, Funding Acquisition, and Writing—Review and Editing.
Disclaimer
The content is solely the responsibility of the authors and does not necessarily represent the official views of the National Institutes of Health. We also acknowledge the Litwin Foundation for their support of our research.
Author Disclosure Statement
No competing financial interests exist.
Funding Information
Research reported in this publication was supported by the National Institute On Aging of the National Institutes of Health under Award Number R01AG054159 and by the South Carolina Clinical & Translational Research Institute with an academic home at the Medical University of South Carolina CTSA NIH/NCATS grant number UL1 TR001450. This work was also supported by an Alzheimer's Association Grant (AARF-21-850073) to S.F-Z.
Supplementary Material
Supplementary Table S1
References
Supplementary Material
Please find the following supplemental material available below.
For Open Access articles published under a Creative Commons License, all supplemental material carries the same license as the article it is associated with.
For non-Open Access articles published, all supplemental material carries a non-exclusive license, and permission requests for re-use of supplemental material or any part of supplemental material shall be sent directly to the copyright owner as specified in the copyright notice associated with the article.