
Abstract
Introduction:
Cortical thickness (CT) and surface area (SA) are established biomarkers of brain pathology in posttraumatic stress disorder (PTSD). Structural covariance networks (SCNs) are represented as graphs with brain regions as nodes and correlations between nodes as edges.
Methods:
We built SCNs for PTSD and control groups using 148 CT and SA measures that were harmonized for site in n = 3439 subjects from Enhancing Neuroimaging Genetics through Meta-Analysis (ENIGMA)–Psychiatric Genomics Consortium (PGC) PTSD. We compared centrality between PTSD and controls as well as interactions of diagnostic group with age, sex, and comorbid major depressive disorder (MDD) status. We investigated associations between network modularity and diagnostic grouping.
Results:
Nodes with higher CT-based centrality in PTSD compared with controls included the left inferior frontal sulcus, left fusiform gyrus, left superior temporal gyrus, and right inferior temporal gyrus. Children (<10 years) and adolescents (10–21) with PTSD showed greater centrality in frontotemporal areas compared with young (22–39) and middle-aged adults (40–59) with PTSD, who showed higher centrality in occipital areas. The PTSD diagnostic group interactions with sex and comorbid MDD showed altered centrality in occipital regions, along with greater visual network (VN) modularity in PTSD subjects compared with controls.
Conclusion:
Structural covariance in PTSD is associated with centrality differences in occipital areas and VN modularity differences in a large well-powered sample. In the context of extensive structural covariance remodeling taking place before and during adolescence, the present findings suggest a process of cortical remodeling that commences with trauma and/or the onset of PTSD but may also predate these events.
Impact statement
Centrality is a graph theory measure that offers insights into a node's relationship with all other nodes in the brain. Centrality pinpoints the drivers of brain communication within networks and nodes and may be a promising target for treatments such as neuromodulation. Modularity can pinpoint modules that exist within larger networks and quantify the connections between these modules. Centrality and modularity complement functional and structural connectivity measurements within specific brain networks.
Introduction
Posttraumatic stress disorder (PTSD) has a lifetime prevalence of 9.4% among adults in the United States (Kessler et al, 2005) and 4% globally (Liu et al, 2017). Cross-sectional and longitudinal studies show differential structural and functional connectivity effects of PTSD on specific brain regions and between regions (Akiki et al, 2017; Hughes and Shin, 2011; Mueller et al, 2015; Philip et al, 2014; Tursich et al, 2015). Regional measures of cortical thickness (CT), surface area (SA), and cortical volume are reliable biomarkers across psychiatric illnesses, including PTSD (Wang et al, 2021).
Centrality is a concept in the graph theory that measures the importance of a particular region within a network based on its connectedness. In the application of graph theory to neuroscience, a network is made up of connections (edges) between brain regions (nodes; Rubinov and Sporns, 2010). CT and SA have been used to construct structural covariance networks (SCNs), wherein pairwise correlations exceeding a specified threshold form edges between nodes in a sample of subjects (Sun et al, 2019).
Centrality characterizes the number of CT-based or SA-based connections of a region sample and may represent underlying functional associations (Gong et al, 2012; He et al, 2007). Positive interregional correlations based on CT are consistent with diffusion imaging-derived structural connections (Gong et al, 2012) and with gene co-expression networks (Romero-Garcia et al, 2018). SCNs show marked homology with intrinsic functional connectivity networks, particularly sensorimotor, salience, and executive control networks.
Further, early adolescent maturation reveals a process of remodeling structural covariance to reflect the architecture of intrinsic functional connectivity, which emerges in pre-adolescence for sensory and motor networks, followed in early adolescence for language-related, salience, and executive control networks (Alexander-Bloch et al, 2013; Vijayakumar et al, 2021). Further modification of SCNs occurs in early adulthood followed by a decline in network integrity throughout adulthood (DuPre and Spreng, 2017). Thus, structural covariance metrics demonstrate converging organization with that of other neuroimaging and biological variables.
Modularity is another graph theory measure that quantifies how well a network is organized into subnetworks (modules). High modularity networks have dense connections between the nodes within modules but sparse connections between nodes from different modules (Sporns, 2013). Baseline modularity of the default mode network (DMN) was found to be associated with PTSD symptoms in a cohort of 71 veterans (Akiki et al, 2018). Modularity increases are linked to cognitive gains resulting from cognitive training (Arnemann et al, 2015). Thus, modularity may be used to monitor treatment in response to interventions that are designed to correct disruptions in network structure.
PTSD is associated with differences in cortical measures (Bromis et al, 2018; Wang et al, 2021), task-based functional connectivity (Hughes and Shin, 2011), and resting-state functional connectivity (rsFC) (Koch et al, 2016). Thus far, meta-analyses of structural neuroimaging in PTSD have applied voxel-based morphometry and volumes estimated from cortical parcellation to reveal gray matter volume differences in anterior cingulate cortex (ACC), insula, medial and ventromedial prefrontal cortex (vmPFC), orbitofrontal cortex (OFC), left temporal pole, rostral middle frontal gyrus, and superior frontal gyrus (SFG) (Kuhn and Gallinat, 2013; Meng et al, 2016).
Brain regions most impacted in PTSD include amygdala, hippocampus, and medial prefrontal cortex (Akiki et al, 2017; Pitman et al, 2012). However, there has been sparse literature on the centrality in PTSD from two studies in adults (Mueller et al, 2015; Sun et al, 2018a), two studies in children/youth (Sun et al, 2018b; Sun et al, 2019), one diffusion tensor imaging study (Long et al, 2013), and one longitudinal study to predict acute symptom onset after exposure to trauma (Harnett et al, 2022).
However, the findings were not consistent across studies. The sample sizes of the aforementioned studies were relatively small (∼300) in relation to the 148 regions under consideration, which involves 10,878 inter-regional connections. All published studies focused on specific types of trauma and/or populations such as military (Mueller et al, 2015), motor vehicle crash (Harnett et al, 2022), childhood maltreatment (Sun et al, 2018b; Sun et al, 2019), but SCN studies that capture a broad range of trauma types are lacking. Finally, none of the adult studies examined centrality derived from cortical SA.
Studies examining network dysfunction in PTSD point to hyperactive salience network (SN), hypoactive DMN, and central executive network (CEN) (Akiki et al, 2017). In PTSD, the SN is unable to effectively switch between DMN and CEN. SN resting-state connectivity shows sex-based difference in PTSD, with males having higher connectivity than females (Helpman et al, 2017). Multiple studies have shown the visual network (VN) to be affected in PTSD (Harnett et al, 2022; Morey et al, 2020, Morey et al, 2015, Morey et al, 2009). No published studies have investigated the effects of age, sex, or comorbid major depressive disorder (MDD) on centrality in patients with PTSD, and no published studies have examined SA-based centrality in PTSD.
In the present study, we compared CT-based centrality and modularity and SA-based centrality in 3439 PTSD and control subjects from the Enhancing Neuroimaging Genetics through Meta-Analysis (ENIGMA)–Psychiatric Genomics Consortium (PGC) for PTSD. We also compared CT-based centrality interactions of diagnostic grouping (PTSD vs. controls) with age, sex, and presence of MDD.
We compared CT-based modularity differences associated with PTSD but did not examine CT-based modularity interaction effects, as we had no hypotheses related to interaction effects. Modularity was tested separately in five cortical subnetworks made up of anatomical regions that fall into canonical rsFC networks. This partitioning into canonical resting works was based on the premise that SCN and canonical resting-state network architectures are concordant (Doucet et al, 2019).
We tested the following hypotheses: (1) areas previously implicated in the pathophysiology of PTSD such as ACC, insula, vmPFC, and occipital regions will show differences in CT-based centrality between PTSD and controls; (2) sex-based disruptions in the CT-based centrality of regions that fall within the SN will impact dorsal ACC and insula; (3) CT-based centrality differences in occipital regions, hippocampus, and parahippocampal regions between PTSD with comorbid MDD and PTSD without comorbid MDD; (4) CT-based centrality in frontotemporal and occipital regions will be correlated with age; and (5) higher CT-based modularity will be observed in PTSD compared with controls for modules contained within the DMN, CEN, SN, and VN.
Subjects and Methods
Subjects
The ENIGMA-PGC PTSD Working Group aggregated data from PTSD patients and controls with varying levels of trauma exposure from 29 sites originating from seven countries (Table 1). We analyzed CT data from 3439 subjects and SA data from 3436 subjects. The majority (92% with PTSD, 85% non-PTSD) of participants were adults. The remaining sample was a combination of children and adolescents (Table 1). The sample comprised 1348 PTSD subjects (39%) and 2082 controls (61%). Mean age and standard deviation of male PTSD subjects was 38 ± 15 years, 37 ± 17.1 years for male control subjects, 34.5 ± 12.7 years for female PTSD subjects, and 32 ± 14.3 years for female control subjects (Table 1).
Demographics Across Sites
ADNI-DOD, Alzheimer's Disease Neuroimaging Initiative–Department of Defense; INTRuST, Injury and Traumatic Stress Consortium; MDD, major depressive disorder; N, no; ND, not done; PTSD, posttraumatic stress disorder; SD, standard deviation; Y, yes.
Sixteen out of 29 sites had control subjects with trauma exposure (Table 1); the remaining sites had controls who were unexposed to trauma. The percentage of subjects with MDD at each site is reported in Table 1. Supplementary Table S1 shows age by diagnoses and sex at each site.
Rating scales
Rating scales used for the diagnosis of PTSD and MDD are listed in Table 2 and described in Section 1 of the Supplementary Data.
Rating Scales by Site
ADIS, Anxiety Disorder Interview Schedule; BDI-II, Beck Depression Inventory-II; CAPS-4, Clinician Administered PTSD Scale for DSM IV; CAPS-5, Clinician Administered PTSD Scale for DSM-V; CDI, Children's Depression Inventory; CES-D, Center for Epidemiologic Studies Depression Scale; DASS, Depression, Anxiety, Stress Scale-21 item short form; DISC, Diagnostic Interview Schedule for Children; DTS Davidson Trauma Scale; GDS, Geriatric Depression Scale; HADS-D, Hospital Anxiety and Depression Scale-Depression; HAMD, Hamilton Depression Scale; MINI, Mini-International Neuropsychiatric Interview; PCL-M, PTSD Checklist-Military; PDS, Posttraumatic Diagnostic Scale; PHQ9, Patient Health Questionnaire 9; PSS, Posttraumatic Stress Scale; SADS-PL Schedule for Affective Disorders and Schizophrenia for School-Age Children—Present and Lifetime Version; SCID, Structured Clinical Interview for DSM IV; UCLA PTSD Index, University of California, Los Angeles PTSD Index.
Scanner make, model, and detailed acquisition parameters are provided in Supplementary Table S2. Inclusion and exclusion criteria for each site are provided in Supplementary Table S3. All participating sites obtained approval from local institutional review boards or ethics committees. All participants provided written informed consent for Institutional Review Board approved study procedures.
Imaging
Structural magnetic resonance imaging (MRI; T1) data obtained from cross-sectional case-control studies were analyzed at Duke University with a standardized neuroimaging and quality control pipeline developed by the ENIGMA Consortium (Logue et al, 2018). Cortical parcellation and labeling based on the Destrieux atlas was performed with FreeSurfer 5.3 on 148 regions (74 per hemisphere; Destrieux et al, 2010).
Network analyses
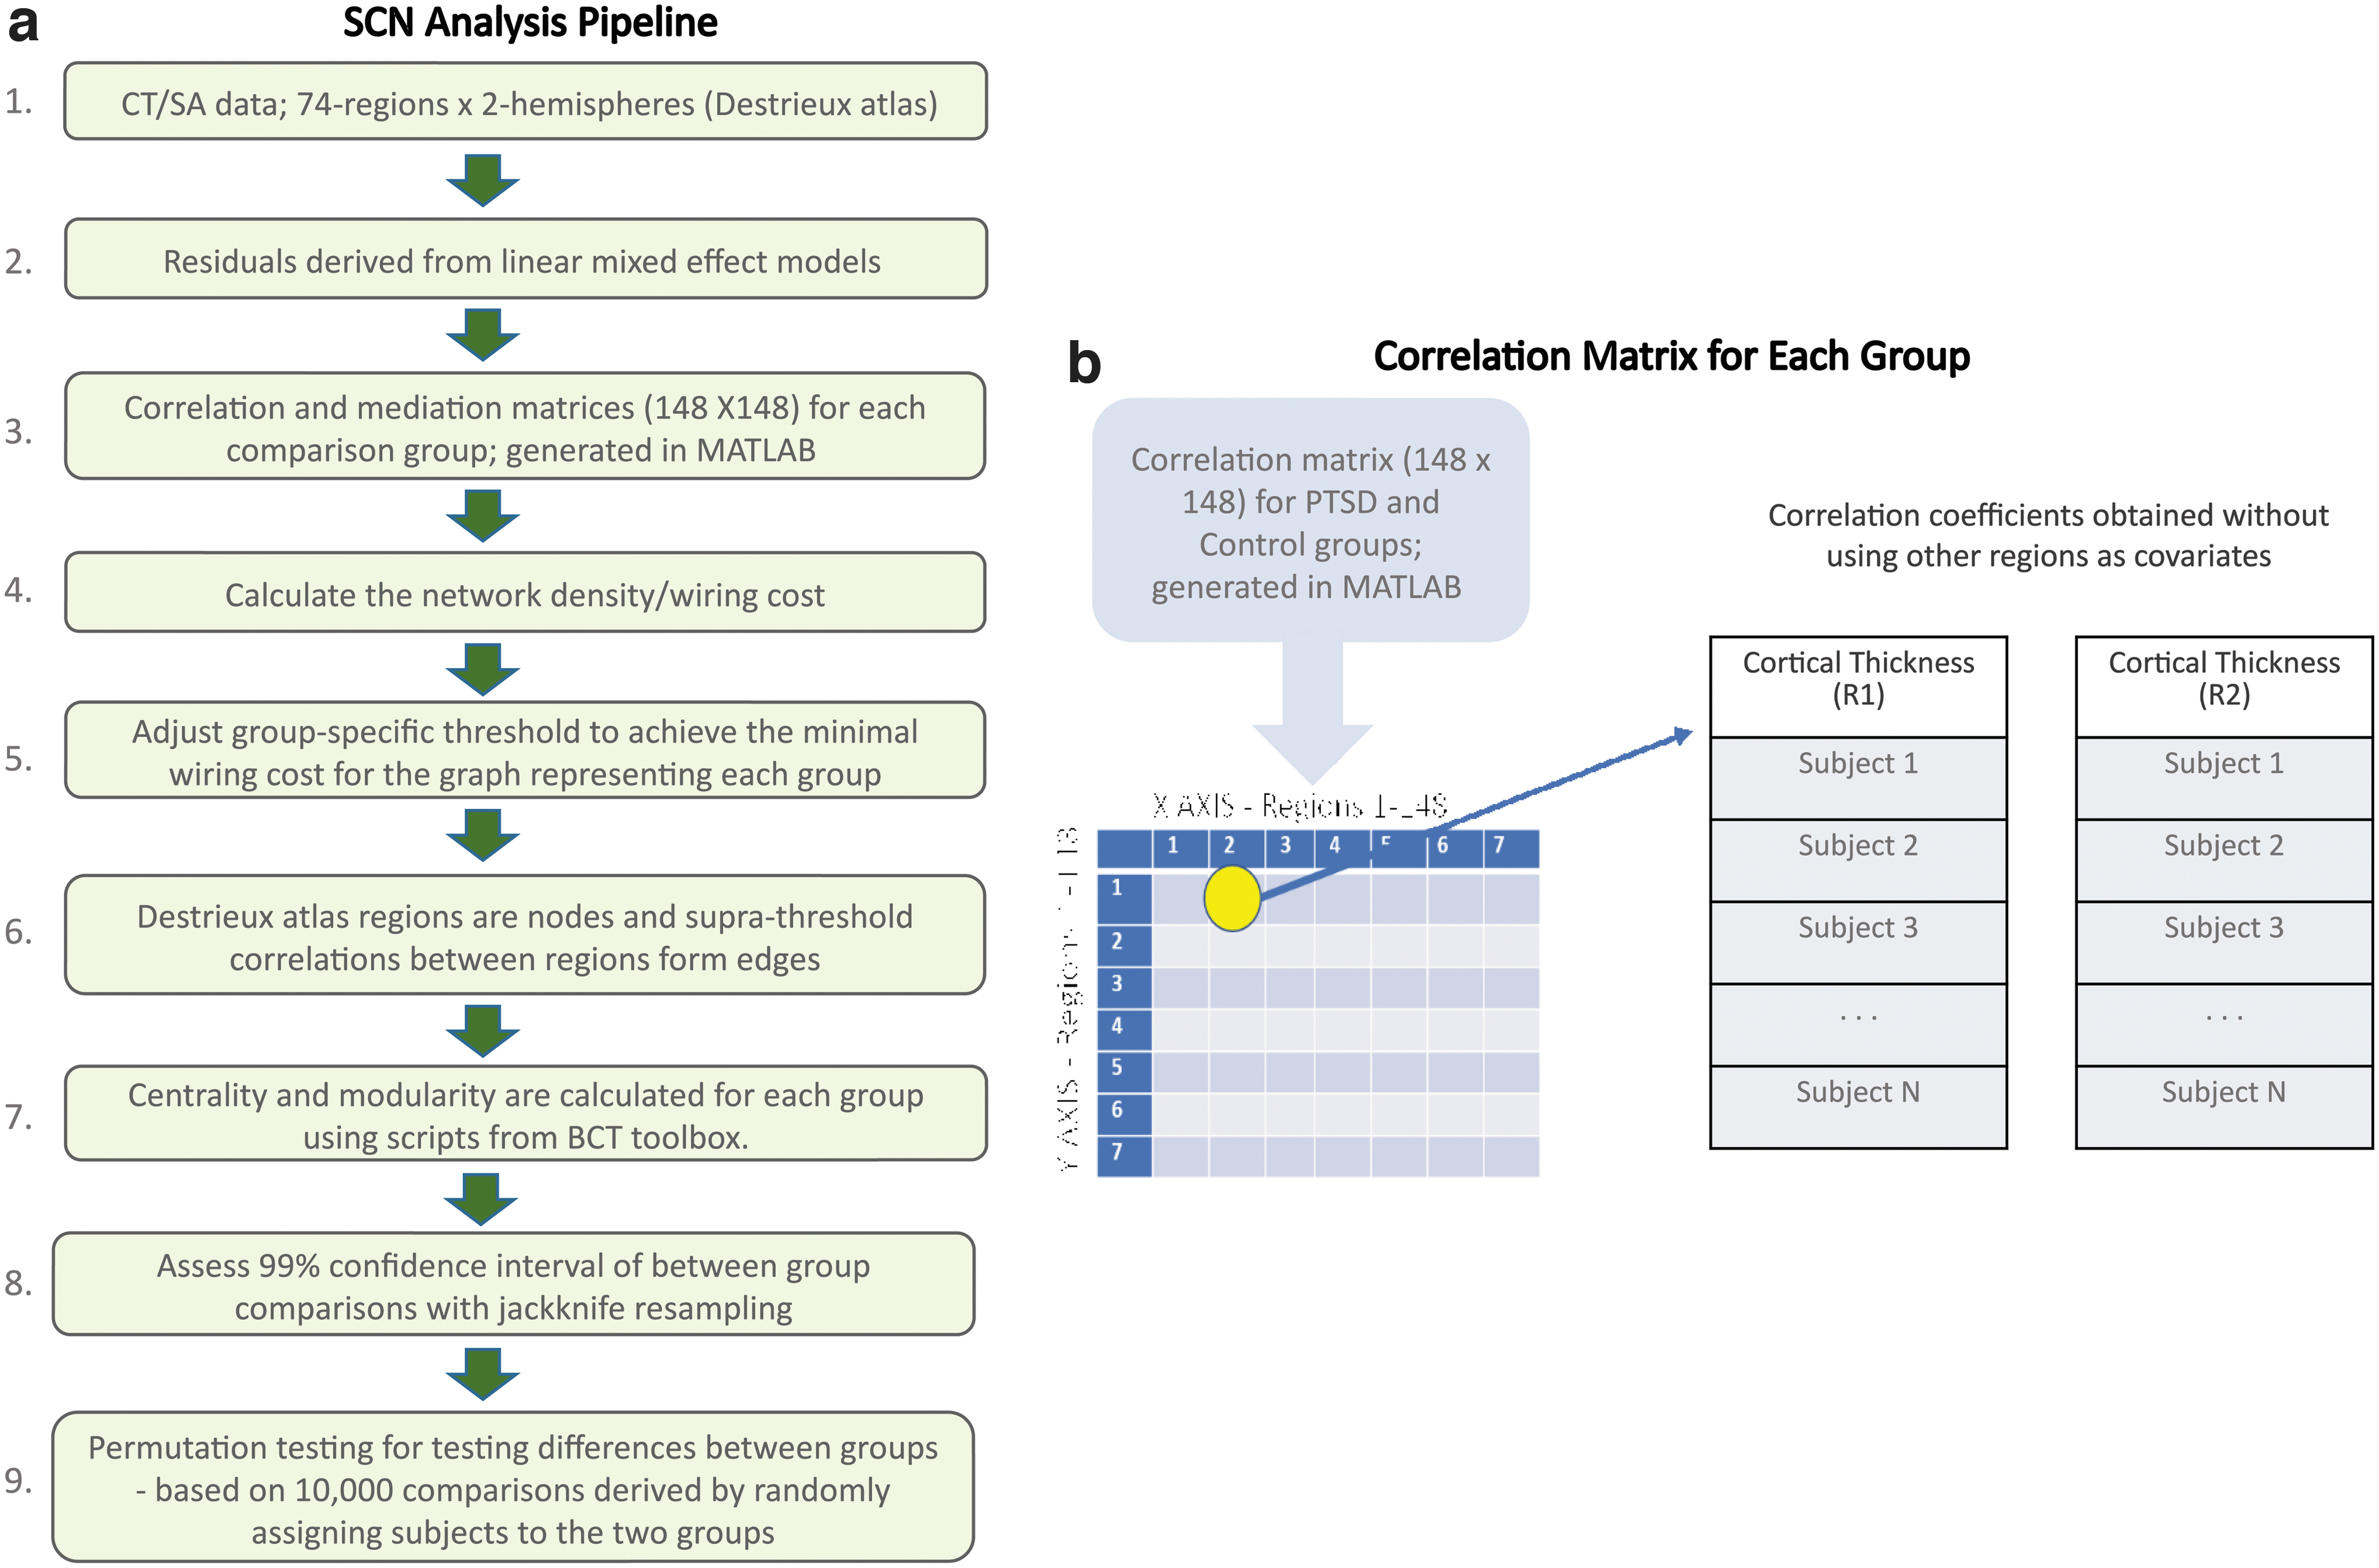
Figure 1 summarizes the sequence and function of steps of an established SCN analysis pipeline (Sun et al, 2018a; Sun et al, 2019). ComBat was utilized to harmonize CT and SA values by controlling for scanner and site effects while preserving inherent biological associations in the data (Fortin et al, 2018). ComBat achieves harmonization by first modeling expected imaging features as linear combinations of the biological variables and site effects whose error term is further modulated by site-specific scaling factors. Second, ComBat applies empirical Bayes to improve the estimation of site parameters for small samples.
This method has been shown to effectively remove unwanted sources of scanner and/or site variability while simultaneously increasing the power and reproducibility of subsequent statistical analyses of multi-site MRI studies (Fortin et al, 2018; Sun et al, 2022). PTSD diagnosis, age, and sex were designated as biological variables to preserve the associated variance, but to remove the variance associated with site and scanner. PTSD severity and depression diagnosis were not designated as biological variables, as they were highly correlated with PTSD diagnosis.
Subsequently, age, age2, sex, and mean whole-brain CT or SA estimates were included as regressors in a linear-effects model (He et al, 2007). We elected to use only fixed effects because the site associated variance was addressed by harmonization with ComBat. The age2 term was designed to adjust for possible nonlinear effects of age on CT or SA. The mean whole-brain CT or SA estimates were included as regressors to minimize bias from subjects with a higher global estimate tend to exhibit larger regional estimates.
Age and age2 were not included as regressors when we investigated the interaction effect between age and diagnostic group. Similarly, sex was not included as a regressor when we investigated the interaction effect between sex and diagnostic group. The residuals of the linear model were entered into subsequent analyses.
Regression models
CT ∼1 + age + age2 + sex + mean whole-brain CT
SA ∼1 + age + age2 + sex + mean whole-brain SA
Centrality and modularity
We selected graph theory measures that enabled direct comparisons of our results with previous findings (Teicher et al, 2014). Edges were formed between nodes when the correlation coefficient exceeded the wiring cost. This threshold was group specific so that the graphs of all groups had the same number of connections, which is the wiring cost. The calculation of wiring cost is simply the number of edges divided by the maximum possible number of edges.
Using undirected correlation-derived graphs, four centrality measures were calculated with the Brain Connectivity Toolbox (BCT) (Rubinov and Sporns, 2010): degree centrality, betweenness centrality, closeness centrality, and eigenvector centrality (a) Degree centrality of a node is the number of directly connected nodes, which reflects how much a node serves as a focal point of communication; (b) betweenness centrality is the frequency with which a node falls on the shortest connecting path between two other nodes, which reflects the potential of a node to control communication; and (c) closeness centrality is the number of steps required to access every other node from a given node. It is calculated as the average of the shortest path length from a node to every other node in the network and may reflect the speed at which a node can spread information throughout the network; (d) eigenvector centrality measures a node's overall influence based on its recursive relatedness to the importance of the nodes associated with it.
Although we compared CT-based and SA-based centrality between PTSD subjects and controls for the whole-brain network, we compared CT-based modularity at a subnetwork scale. We used ICA-derived canonical resting state networks for forming the subnetworks within which the modularity of SCNs was assessed. We constructed separate correlation matrices for anatomic regions contained in five canonical resting-state networks.
Thus, we examined the modularity of CT/SA-based SCNs of anatomic regions contained in the DMN, CEN, SN, VN, and sensorimotor network using their respective masks derived from Consensual Atlas of Resting-State Networks (Doucet et al, 2019). For each mask, we included corresponding regional outputs from the Destrieux atlas. See Section 2 and Supplementary Figure S1 in Supplementary Data for details. We calculated modularity using the Louvain method (Blondel, 2008) and Newman method (Newman, 2006) with BCT.
Statistical analyses
Analyses were performed with MATLAB (2020a, The Mathworks Inc.) scripts that were previously reported (Sun et al, 2018a; Sun et al, 2018b; Sun et al, 2019). We did not compare the four-centrality measures, given that they are highly correlated. Rather, we used an established method to test whether node centrality differed between groups (Sun et al, 2018a; Sun et al, 2018b; Sun et al, 2019). This method deems a significant difference in centrality if permutation testing-derived p values ≤0.05 for at least three out of four centrality measures (Teicher et al, 2014).
Given that the SCN approach only delineates a single network per participant group, we assessed the reliability (99% confidence interval) of between-group comparisons using the jackknife resampling method as reported by Teicher et al (2014).
Permutation testing was employed to assess significant between-group differences in centrality and modularity. The method measures the probability that between-group differences in centrality/modularity occurred by chance based on 10,000 network comparisons derived by randomly assigning subjects to two groups. For centrality, we analyzed interactions with permutation testing by modifying the procedure used to test main effects.
Specifically, we randomly assigned centrality values to one of four groups when investigating interactions between diagnosis and age, diagnosis and sex, or diagnosis and MDD status. To calculate PTSD × sex interaction, we (1) split the subjects into four groups: male PTSD, male non-PTSD, female PTSD, and female non-PTSD, and we calculated the between-group differences for (male PTSD + female non-PTSD) – (female PTSD + male non-PTSD); (2) shuffled the group labels 1000 times and calculated new between-group differences each time.
The statistical significance was calculated by the probability of obtaining the mean difference from the original labels in relation to the distribution of mean differences generated with permuted labels. We calculated the associated p value by comparing the centrality value obtained from the actual group labels with the distribution of centrality values obtained from the 1000 group-label permutations.
Unlike the results of the analysis of variance interaction test in parametric statistics, the present analyses of interactions with permutation testing does not provide an interaction result. The permutation testing result is more akin to the results of planned comparisons after interactions testing (e.g., t-test). In a similar manner, we investigated between-group differences of the contrast between five age-groups (<10, 10–21, 22–39, 40–59 and ≥60 years), MDD versus non-MDD and PTSD versus non-PTSD for modularity. We performed post hoc analyses on the nodes, showing a significant interaction effect for age-centrality and MDD/non-MDD-centrality.
For modularity comparison between PTSD subjects and controls, we performed post hoc analyses on the nodes showing significant differences between the two groups. Lacking specific hypotheses concerning interaction effects on modularity, these were not investigated.
Significance for comparisons of CT-based centrality measures, SA-based centrality measures, and modularity were corrected using Benjamini and Hochberg procedure for controlling the false discovery rate (Benjamini and Hochberg, 1995). This was done using MATLAB scripts for the same.
Results
Key demographic and clinical characteristics of each cohort are reported in Table 1. Overall, our data for analyses (n = 3439 for CT and n = 3436 for SA) were pooled from 29 sites across seven countries (United States, Australia, Belgium, Germany, South Africa, Netherlands, China). All sites except three (Duke University [De Bellis], University of Ghent and VA Waco) had control subjects who had been exposed to trauma. Three sites contributed data from children and adolescents (University of Washington, Duke University [De Bellis], Leiden University Medical Center).
Details of age by sex and diagnostic groups across sites are elucidated in Supplementary Table S1. Details on scan acquisition and scanner used are elucidated in Supplementary Table S2. Thresholds obtained from CT-based positive correlation coefficients were 0.06 and 0.07 for PTSD and control groups, respectively, and SA-based thresholds were 0.1 and 0.007 in PTSD and control groups, respectively. This minimum wiring cost was calculated using positive correlation coefficients that exceeded the group-specific threshold to ensure that the total number of edges in the network for every group was equal (Teicher et al, 2014).
Graph centrality based on Pearson's correlation coefficients
The PTSD group showed higher CT-based centrality compared with controls in the left fusiform gyrus, left precentral gyrus, lateral aspect of left superior temporal gyrus, left inferior frontal sulcus, right paracentral gyrus and sulcus, and right inferior temporal gyrus (Table 3). The PTSD group showed lower CT-based centrality compared with controls in right posterior transverse collateral sulcus and right anterior occipital sulcus (Table 3; Fig. 2). Except the right inferior temporal gyrus, all areas showed significant CT-based centrality differences in three of four measures when corrected for multiple comparisons (Table 3; Fig. 2). Supplementary Table S4 shows centrality for SA.
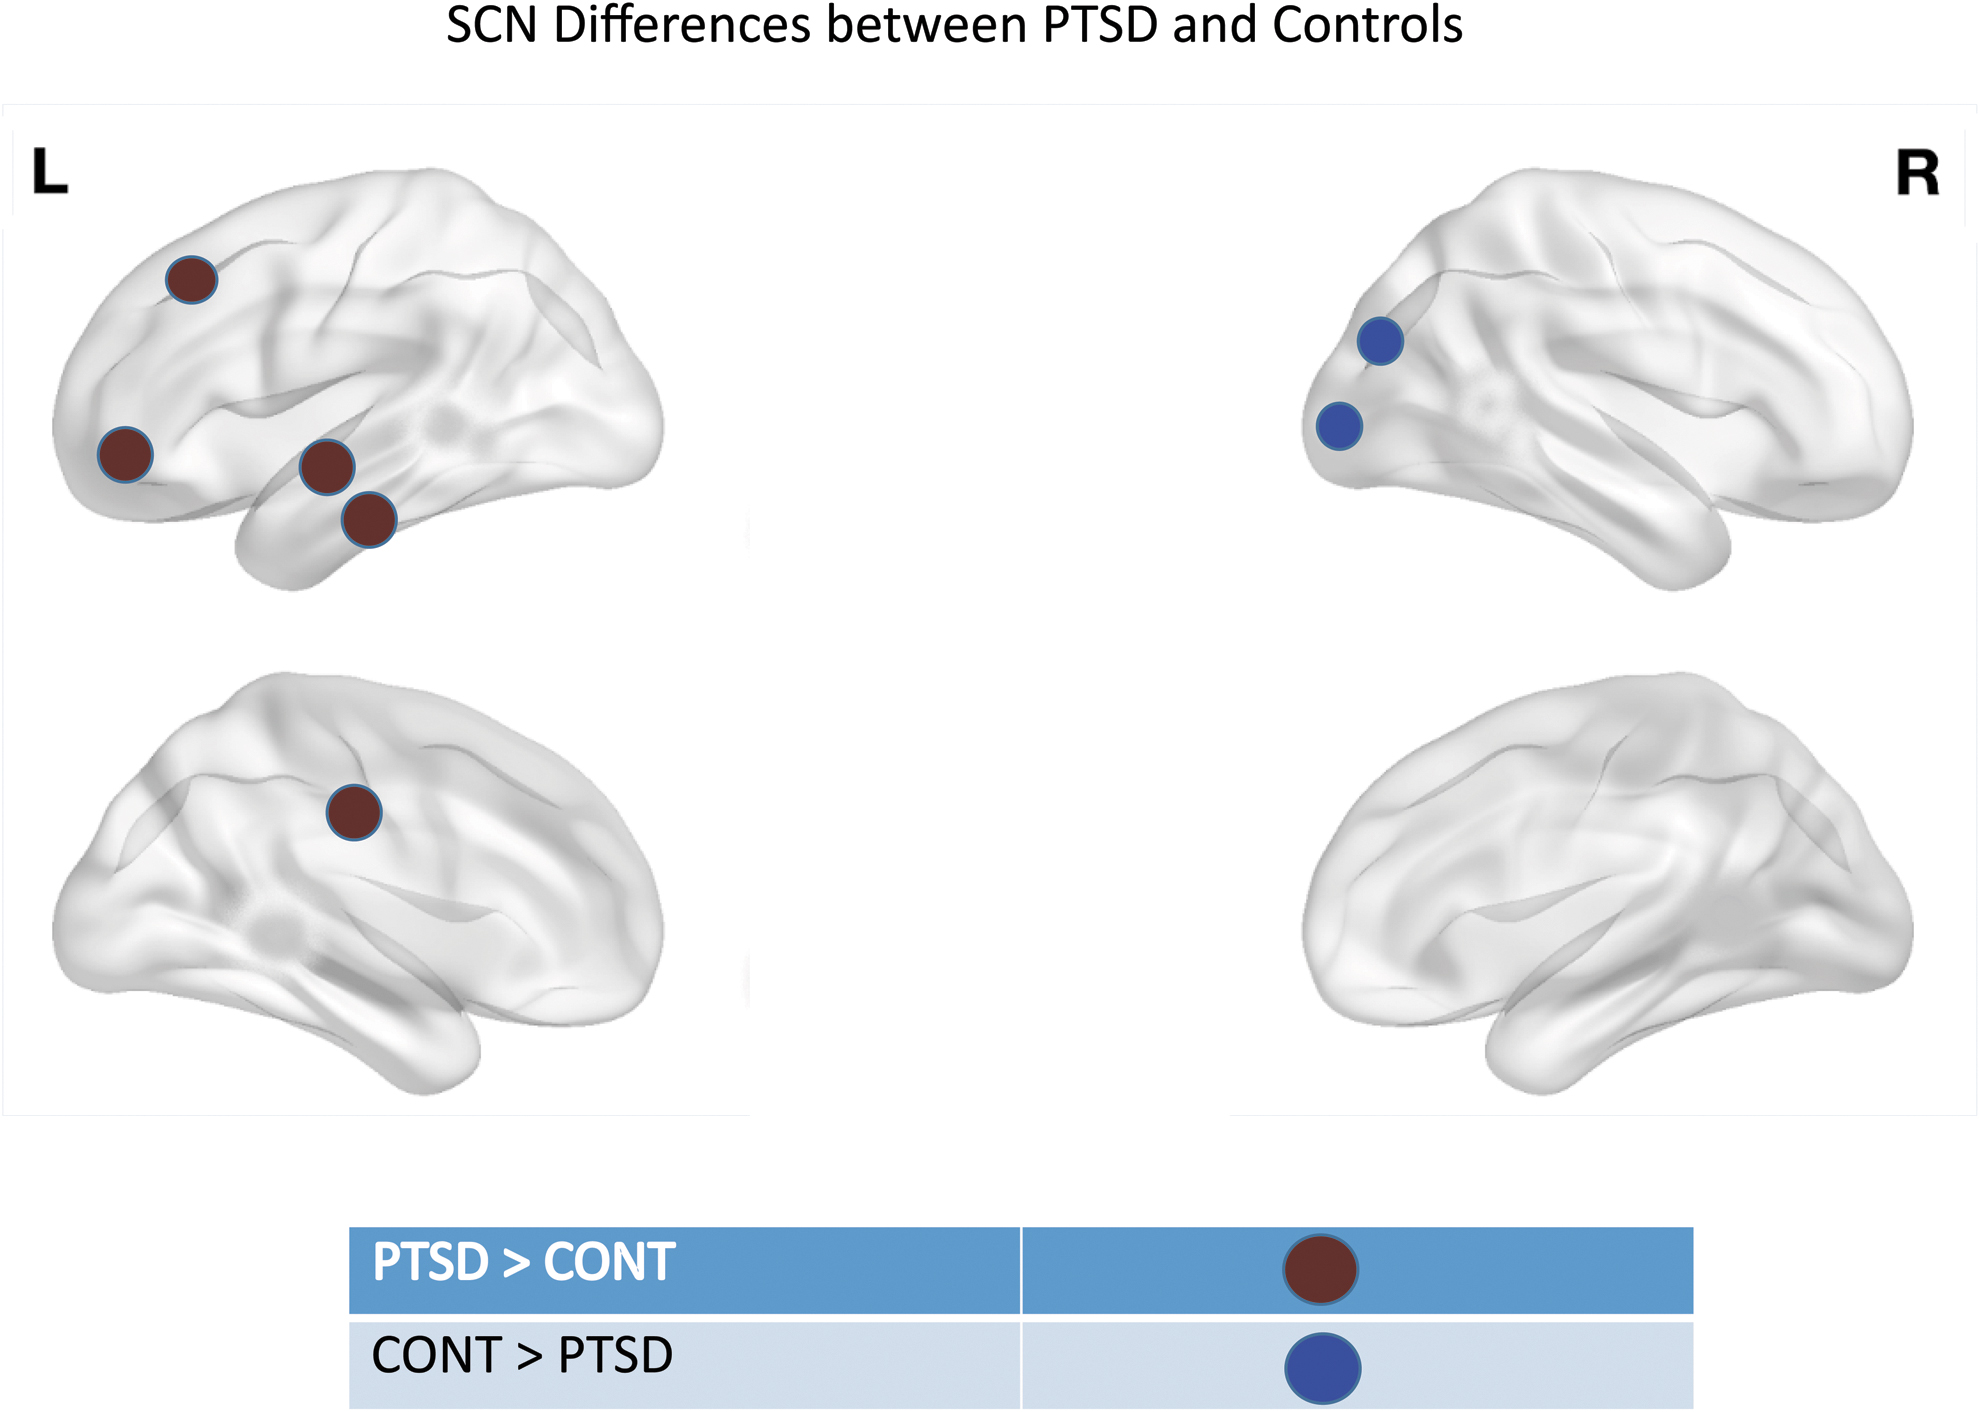
The red spheres indicate nodes that showed higher centrality in PTSD subjects compared with controls. The blue spheres indicate nodes that showed higher centrality in controls compared with PTSD subjects.
Main Effect of Group for Cortical Thickness Positive Correlations
i, j, k, and l indicate p values followed by q values in parentheses.
Degree centrality for PTSD subjects.
Degree centrality for control subjects.
Betweenness centrality for PTSD subjects.
Betweenness centrality for control subjects.
Closeness centrality for PTSD subjects.
Closeness centrality for control subjects.
Eigen vector centrality for PTSD subjects.
Eigen vector centrality for control subjects.
p Value for degree centrality comparison.
p Value for betweenness centrality comparison.
p Value for closeness centrality comparison.
p Value for eigen vector centrality comparison.
Interactions
Brain regions whose CT-based centrality showed a significant interaction of age and diagnosis are listed by age group in Supplementary Tables S5 to S9. Centrality and p values are provided for childhood (age <10), adolescence (10–21), early adulthood (22–39), middle adulthood (40–59), and late adulthood (≥60) years (Fig. 3). Males with PTSD showed higher centrality in right subcentral gyrus and lower centrality in right anterior transverse collateral sulcus and left posterior ramus of lateral fissure (Table 4).
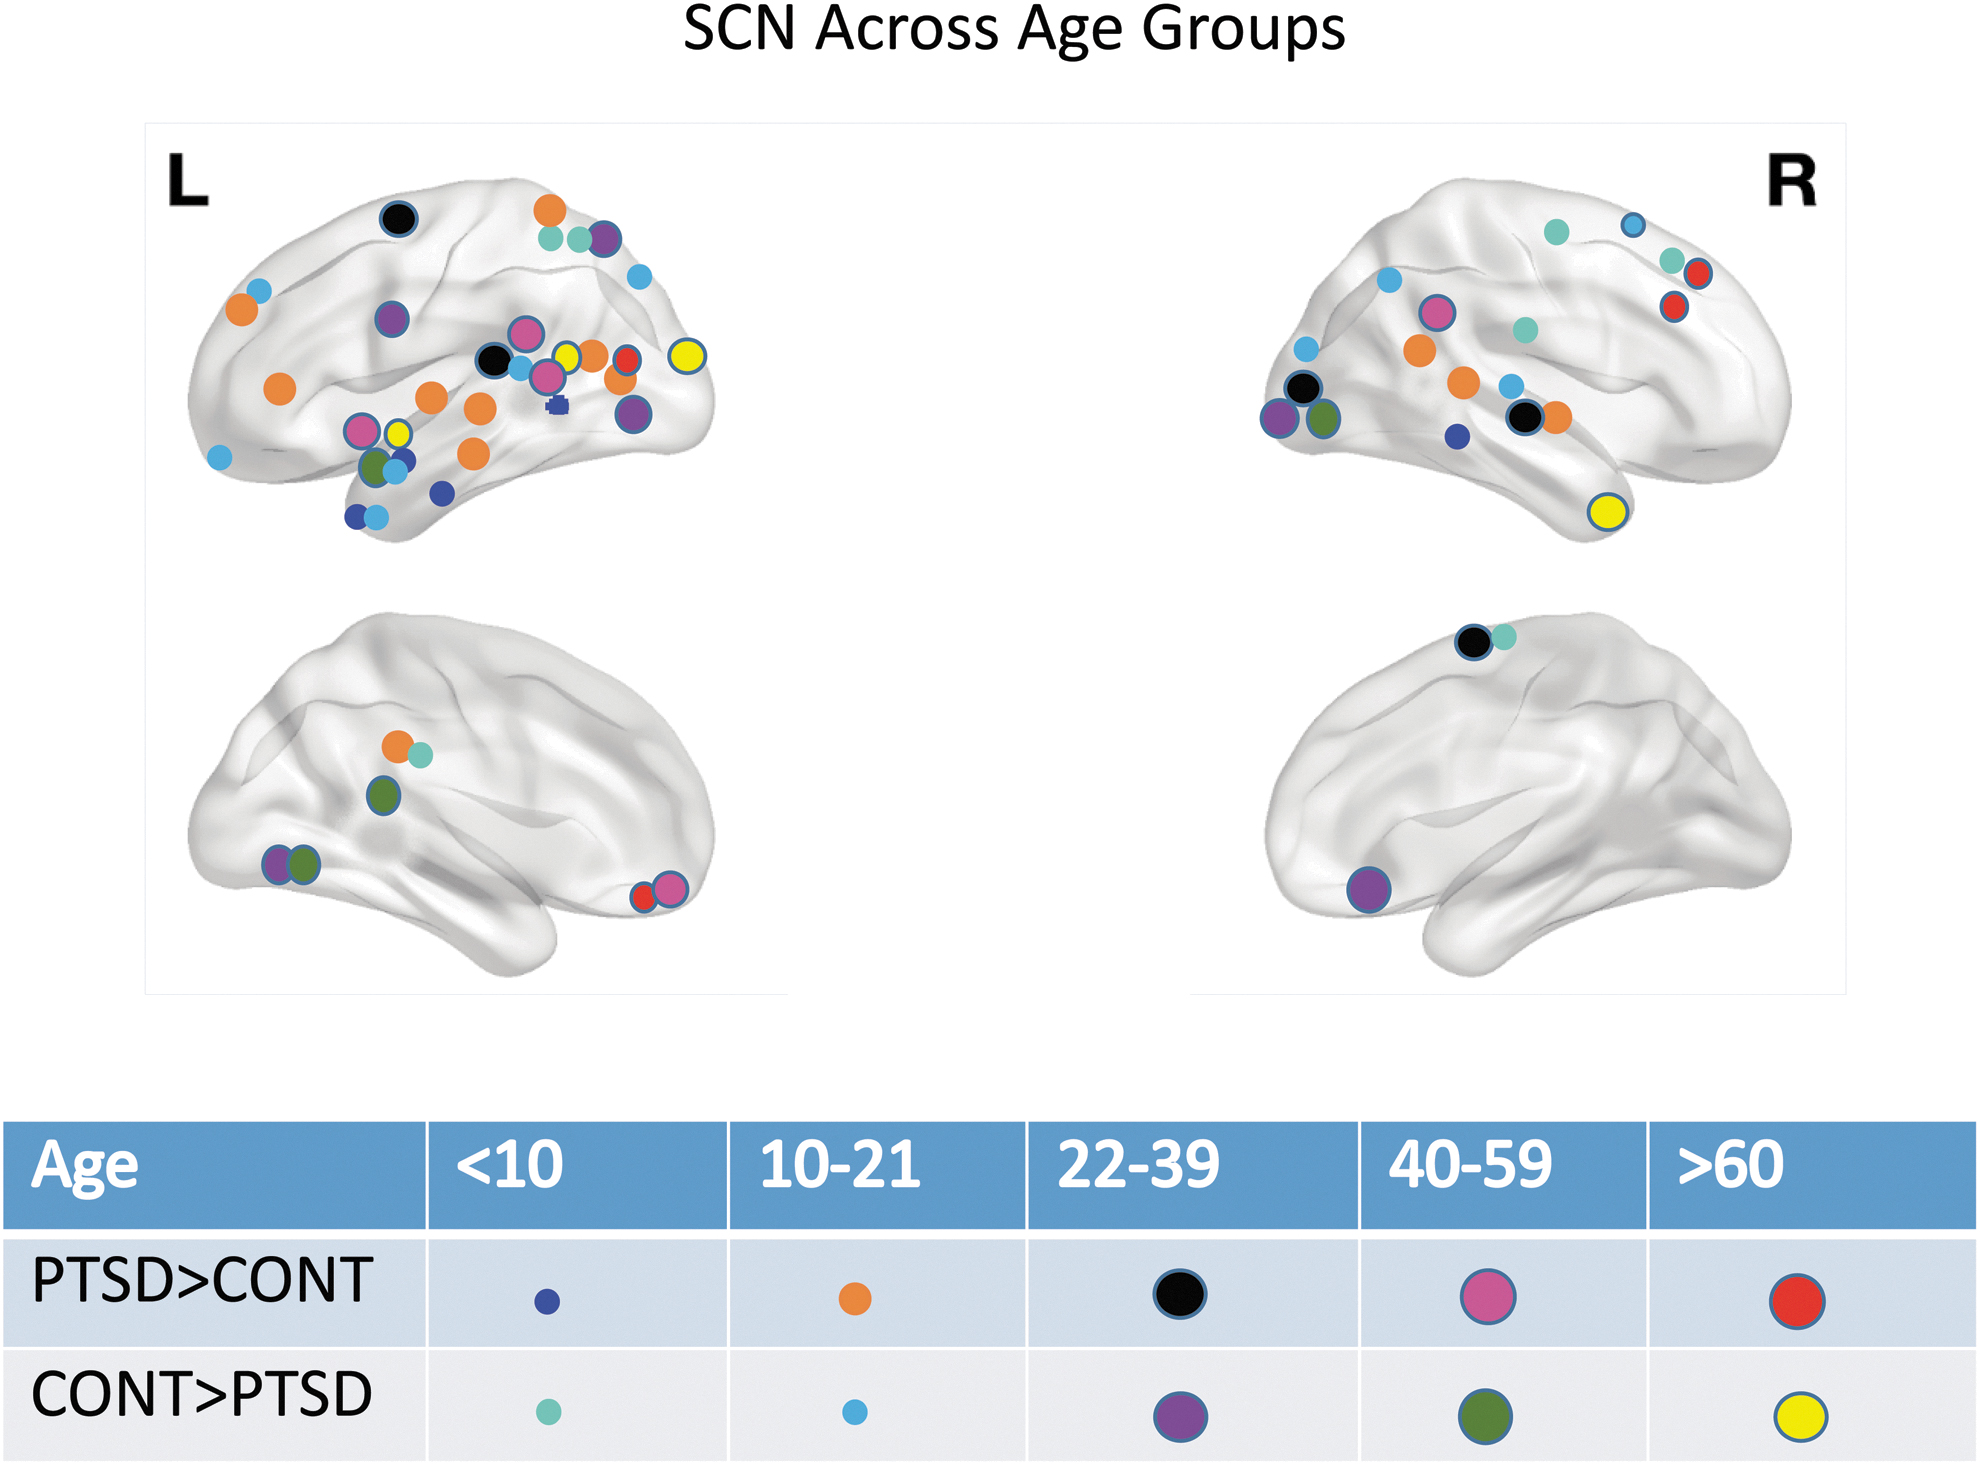
The figure shows regions that showed increased centrality and decreased centrality in PTSD compared with controls for age groups: <10, 10–21, 22–39, 40–59, and >60 years.
Diagnoses × Sex Interactions for Cortical Thickness Positive Correlations
i, j, k, and l indicate p values followed by q values (corrected) in parentheses. G1—Males with PTSD + Female Controls. G2—Females with PTSD + Male Controls.
Degree centrality for G1.
Degree centrality for G2.
Betweenness centrality for G1.
Betweenness centrality for G2.
Closeness centrality for G1.
Closeness centrality for G2.
Eigen vector centrality for G1.
Eigen vector centrality for G2.
p Value for degree centrality comparison.
p Value for betweenness centrality comparison.
p Value for closeness centrality comparison.
p Value for eigen vector centrality comparison.
All areas showed significant CT-based centrality differences in three out of four measures when corrected for multiple comparisons (Table 4). Subjects with PTSD and comorbid MDD showed higher centrality in the orbital part of left inferior frontal gyrus and right parahippocampal gyrus and lower centrality in right occipital pole (Table 5). Except right parahippocampal gyrus, all areas showed significant CT-based centrality differences when corrected for multiple comparisons (Table 5).
Posttraumatic Stress Disorder Diagnosis × Major Depressive Disorder Interaction for Cortical Thickness Positive Correlations
i, j, k, and l indicate p values followed by q values (corrected) in parentheses. G1—PTSD with comorbid major depressive disorder (MDD) + Controls without MDD. G2—Controls with comorbid MDD + PTSD without comorbid MDD.
Degree centrality for G1.
Degree centrality G2.
Betweenness centrality for G1.
Betweenness centrality for G2.
Closeness centrality for G1.
Closeness centrality for G2.
Eigen vector centrality for G1.
Eigen vector centrality for G2.
p Value for degree centrality comparison.
p Value for betweenness centrality comparison.
p Value for closeness centrality comparison.
p Value for eigen vector centrality comparison.
Modularity
Table 6 shows CT-based modularity comparisons between PTSD subjects and controls for canonical networks. With uncorrected p values, the VN showed higher CT-based modularity in the PTSD group compared with the control group. No network showed significant CT-based modularity differences when corrected for multiple comparisons.
Canonical Network Modularity Comparison Between Posttraumatic Stress Disorder and Controls
The column titled “network” lists names of respective networks: DMN, CEN, SN, SMN, VN, and number of Destrieux atlas nodes that were classified into each network within parentheses.
p Value ≤0.05.
CEN, central executive network; DMN, default mode network; SMN, sensorimotor network; SN, salience network; VN, visual network.
Discussion
The present study compared CT-based centrality and modularity and SA-based centrality in over 3000 participants that included PTSD cases and trauma-exposed control subjects. We compared interactions of diagnostic grouping with age, sex, and presence of MDD. In our analyses, CT-based SCN showed higher centrality in PTSD subjects compared with controls in left inferior frontal sulcus and left fusiform gyrus, both of which mediate fear conditioning (Fenster et al, 2018; Morey et al, 2015). We found lower centrality in anterior occipital sulcus and posterior transverse collateral sulcus in PTSD subjects compared with controls.
These conform with previous evidence of occipital brain region involvement in PTSD (Harnett et al, 2022; Morey et al, 2020, Morey et al, 2015, Morey et al, 2009). Modularity analyses corroborated these results although with reversed directionality, showing higher modularity in the VN in PTSD subjects compared with controls.
CT-based SCN showed higher centrality of the right inferior temporal gyrus and left superior temporal gyrus in PTSD compared with controls. These regions form a part of the DMN called the dorsal medial subsystem (Andrews-Hanna et al, 2014). The dorsal medial subsystem comprised the dorsal medial prefrontal cortex, temporo-parietal junction, lateral temporal cortex, and temporal pole (Andrews-Hanna et al, 2014). For SA-based SCN, the left superior temporal sulcus (part of DMN dorsal medial subsystem; Andrews-Hanna et al, 2014) and right middle cingulate gyrus and sulcus showed greater centrality in PTSD compared with controls.
The dorsal medial subsystem is specialized for mentalizing and social cognition. Previous studies with sample sizes of less than 100 participants show mixed results for the dorsomedial subsystem in PTSD. One previous study shows hyperconnectivity between dorsal medial prefrontal cortex and amygdala in PTSD (Olson et al, 2019), and another study shows no differences in this subsystem in PTSD (Miller et al, 2017).
Previous studies have reported reduced volumes of ACC in PTSD (Karl et al, 2006), and that left ACC volume predicted treatment response in PTSD (Bryant et al, 2008; Dickie et al, 2013; Helpman et al, 2016). Although we hypothesized ACC findings, ACC did not show centrality differences except for a diagnosis by age interaction among adolescents and young adults. Young adults show lower centrality in right ACC in PTSD subjects compared with controls. Contrary to our initial hypothesis, the ACC and vmPFC did not show differences in our CT SCN comparison between PTSD and controls.
However, the dorsomedial subsystem and VN showed differences associated with PTSD. The paucity of centrality differences in ACC and vmPFC could be explained by site confounds in our dataset that was collected at multiple sites and from multiple cohorts. However, site confounding is unlikely due to ComBat harmonization of CT and SA. A more likely explanation is that the established association of ACC volume with PTSD is a poor predictor of ACC-CT or ACC-SA covariance relationships with other cortical regions that are affected by PTSD.
Combining the earlier reports of ACC volume associations with PTSD with the present lack of ACC centrality findings suggests that the effects of PTSD may be relatively widespread in affecting ACC as well as CT and SA of other regions that covary with ACC.
At baseline, healthy females have more pronounced amygdala activation and stronger rsFC to prefrontal cortex compared with males (Kogler et al, 2016). Compared with males with PTSD, females with PTSD show weaker rsFC within the DMN and CEN (Helpman et al, 2021). Stronger rsFC in the SN is seen in males with PTSD, but this pattern is reversed in females with PTSD (Helpman et al, 2021, Helpman et al, 2017). Helpman and colleagues compared 59 males and 46 females with PTSD, to show weaker rsFC in the hippocampus-precuneus circuit and stronger rsFC in the dorsal anterior cingulate-precuneus circuit among females compared with males (Helpman et al, 2021).
Although rsFC differentially affects males and females with PTSD within DMN, CEN, and prefrontal connectivity to the medial temporal lobe, there is little evidence that primary sensory or sensory association cortices are involved. By contrast, our results using structural connectivity, which are known to parallel rsFC for some networks (Honey et al, 2009; Zielinski et al, 2010), show that males with PTSD have greater centrality in the right cuneus and lower centrality in the right anterior transverse collateral sulcus compared with females with PTSD.
Both regions are encompassed in the VN; however, they show opposing directionality with one showing higher centrality and another showing lower centrality in males with PTSD compared with females with PTSD. Sex-related effects on SCN have been reported in normally developing children (Zielinski et al, 2010), but not in adults who are traumatized or have PTSD. An important takeaway from our results is that the VN showed sex-based differences in centrality which are further modulated by PTSD diagnosis.
Despite a 30–60% comorbidity rate of PTSD with MDD (Campbell et al, 2007; Flory and Yehuda, 2015; Kessler et al, 1995), there is scant literature on brain changes in PTSD with comorbid MDD. A previous study shows increased rsFC between the subgenual ACC and perigenual ACC in PTSD subjects with comorbid MDD compared with PTSD alone. The comorbid MDD group had weaker rsFC between insula and hippocampus compared with PTSD alone (Kennis et al, 2013).
There is ongoing debate whether comorbid MDD with PTSD represents a distinct PTSD phenotype, as an outcome of traumatic stress rather than the co-existence of two illnesses with overlapping symptom dimensions (Afzali et al, 2017; Campbell et al, 2007). Nonetheless, a plausible explanation could be that comorbid MDD with PTSD may represent a PTSD subtype with distinct risk factors compared with PTSD alone or MDD alone (Adams et al, 2019). This phenotype also has more severe symptoms than PTSD without MDD (Adams et al, 2019).
Correlative differences in rsFC have been shown in a study comparing subjects with PTSD + MDD, as opposed to PTSD alone. PTSD + MDD (n = 21) show a greater reduction in rsFC between the following pairs of regions: basolateral amygdala—OFC, nucleus accumbens—thalamus, and nucleus accumbens—hippocampus as compared with subjects with PTSD alone (n = 27; Zhu et al, 2017). Our analyses showed that comorbid PTSD and MDD have lower centrality in the right occipital pole compared with PTSD alone.
The right occipital pole is part of the VN, and this conforms with shared VN abnormalities between PTSD and MDD (Javaheripour et al, 2021). In addition, recent evidence points to an association between SCNs (derived from structural MRI and diffusion MRI) within the ventral visual processing stream and maintenance of PTSD symptoms, 12 months after the trauma (Harnett et al, 2022).
Available evidence in pediatric PTSD points to (1) volume reduction in hippocampus and medial prefrontal cortex with trauma (De Bellis and Zisk, 2014; Morey et al, 2016); (2) increased activation in the right ACC, vmPFC, dorsal anterior cingulate, and amygdala (Herringa, 2017); (3) weaker rsFC in the circuit between amygdala and vmPFC (Herringa, 2017); and (4) weaker rsFC in the circuit between amygdala and right ACC.
In our analyses (Fig. 3), children (<10 years) and adolescents (10–21 years) had centrality differences in CT-derived networks in temporal and parietal nodes, with minimal frontal and occipital node involvement. Children (<10 years) had higher centrality in right SFG and adolescents/emerging adults (10–21 years) show higher centrality in left posterior cingulate gyrus and left inferior frontal gyrus. The young (22–39) and middle adult (40–59) groups had centrality differences in nodes distributed throughout the cortex, with heavy concentration in the visual cortex.
Our results demonstrate disrupted frontolimbic circuitry in pediatric PTSD, consistent with previous studies showing weaker rsFC between amygdala and vmPFC/right ACC (Herringa, 2017) and disproportionately greater occipital involvement in adult PTSD (Chao et al, 2012; Crombie et al, 2021).
Nodes with significantly higher centrality represent focal points of communication and could be considered overall drivers of brain activity (Lerch et al, 2006; Mechelli et al, 2005). The interpretation of centrality derived from structural MRI measures such as CT, SA, or cortical volume is fundamentally different from centrality derived from functional MRI (Guye et al, 2010; Yun and Kim, 2021). This is because a plausible correlation between CT at a brain region and its functional activation (at rest or when performing a task) is hypothesized, but it lacks strong support (Honey et al, 2009).
Nonetheless, centrality offers novel ways of gaining insights into a node's relationship to the entire connectome unlike other approaches like seed-based connectivity (Zuo et al, 2012). Centrality is able to quantify the relationship between a region and neighboring regions in the connectome, while also considering the relationships between more distant nodes (Zuo et al, 2012).
We elected to investigate centrality based on evidence that centrality comports with white matter connectivity (Gong et al, 2012) as well as gene expression networks (Romero-Garcia et al, 2018), whereas other graph theory measures such as efficiency or small worldness are not reflected in other types of neurobiologically derived brain networks. Although interpretation of directionality is vague with centrality measures, examining SCNs has revealed valuable insights in other diseases.
Examining SCNs in neurodegenerative diseases such as Alzheimer's has pinpointed nodes that are primary drivers of brain atrophy in other regions (hippocampus, thalamus, precuneus, posterior cingulate cortex) as well as network-specific changes in structural covariance based on etiology of the disease (Hafkemeijer et al, 2016; Qing et al, 2021). Examining SCNs in children and adolescents has shown how structural covariance of regions within specific networks changes with age (Vijayakumar et al, 2021). Although previous studies have shown a reduction in CT and volume in brain regions in PTSD, examining SCNs could bring similar valuable insights to PTSD neurobiology.
Modularity can pinpoint a subset of nodes that are more strongly interconnected to each other than nodes outside their own module. (Sporns and Betzel, 2016). Network specific modular organization can help identify nodes that connect important functional or structural modules. These nodes may be targets for therapeutic interventions such as neuromodulation. Our results show higher modularity in the VN of PTSD subjects compared with controls, which corroborates centrality results from diagnostic group by sex and diagnostic group by comorbid MDD interactions.
Although our results drew from many cohorts and could be limited by heterogeneity in PTSD phenotype assessment methods, the VN showed centrality differences in the results of all analyses (main SCN centrality analyses without interactions, SCN centrality analyses with interactions using age, sex and comorbid MDD, and modularity analyses). Our finding about the pivotal role of the visual cortex in PTSD is further substantiated by its role in the acute onset of PTSD symptoms in the year after trauma (Harnett et al, 2022).
Strengths and limitations
Our study has several strengths, including a large sample size and multi-cohort design representing diverse demographics, geography, and trauma types. However, this heterogeneity may expose a weakness as each site had different recruitment practices, different methods for clinical assessment even when using the same instruments, and different inclusion/exclusion criteria. Our strategy for addressing scanner-specific effects on CT with ComBat harmonization is a major strength (Fortin et al, 2018).
We specified PTSD diagnosis, age, and sex as “biological variables” during ComBat harmonization and this preserved the associated variance, but removed variance associated with site, scanner, and other sources of noise. Second, we explored how centrality compared between PTSD subjects and controls, based on different age groups (children, adolescents and emerging adults, young adults, older adults, and elderly), sex (males/females), and presence of MDD. These comparisons have not been explored in previous studies.
Third, the present method does not allow examining individual differences in network characteristics; only a single network can be generated per group (e.g., PTSD males). By contrast, interregional connectivity from resting-state functional MRI can be calculated for each subject (Sun et al, 2018b). This precludes testing associations with continuous measures such as symptom severity. Due to this limitation, our analyses of age effects involved grouping the sample into bins.
Fourth, our study utilized a cross-sectional design, which limits inferences about causal relationships between childhood or adult trauma exposure, PTSD status and severity, and CT-based SCN characteristics. Fifth, we lacked medication information from most sites. Sixth, we utilized a novel pipeline to calculate modularity derived from CT, based on established canonical networks.
Conclusions
We compared CT-derived SCNs between PTSD patients and controls along with interactions of age and diagnosis, sex and diagnosis, and PTSD with comorbid MDD. The present study had a dramatically larger sample size compared with previous studies and was the first to investigate SCN interactions. Structural covariance in PTSD is associated with centrality differences in occipital areas and modularity differences in the VN. In the context of extensive structural covariance remodeling that takes place both before and during adolescence, the present findings suggest a process of cortical remodeling that commences with trauma and/or the onset of PTSD but may also predate these events.
Footnotes
Acknowledgments
The authors would like to thank the ENIGMA-PGC-PTSD workgroup for contributing data for analyses and reviewing the manuscript. ENIGMA-PGC-PTSD Workgroup Members: Brian M. O'Leary BS, Hong Xie MD PhD, Emily L. Dennis PhD, Neda Jahanshad PhD, Saskia B.J. Koch, Jessie L. Frijling MD PhD, Laura Nawijn PhD, Miranda Olff PhD, Mirjam van Zuiden PhD, Faisal M. Rashid, Xi Zhu PhD, Judith K. Daniels PhD, Anika Sierk PhD, Antje Manthey MS, Jennifer S. Stevens PhD, Tanja Jovanovic PhD, Murray B. Stein MD MPH FRCPC, Martha Shenton PhD.
Steven J.A. van de Werff PhD, Nic J.A. van de Wee MD PhD, Robert R.J.M. Vermeiren MD PhD, Christian Schmahl MD, Julia Herzog MS, Milissa L. Kaufman MD PhD, Lauren O'Connor BA, Lauren A.M. Lebois PhD, Justin T. Baker MD PhD, Staci A. Gruber PhD, Jonathan D. Wolff BS, Erika J. Wolf PhD, Sherry R. Wintemitz MD, Atilla Gönenc PhD, Kerry J. Ressler MD PhD, David Bernd Hofmann PhD, Richard A. Bryant PhD, Mayuresh Korgaonkar PhD, Elpiniki Andrew MCP/PhD, Li Wang PhD, Ye Zhu PhD, Gen Li BS, Dan J. Stein MBChB FRCPC PhD DPhil, Jonathan Ipser PhD, Sheri Koopowitz PhD.
Sven Mueller PhD, Anna Hudson MSc, Luan Phan MD PhD, Bobak Hosseini MA, K. Mike Angstadt MS, Anthony P. King PhD, Marijo Tamburrino MD, Brynn C. Skilliter BS, Elbert Geuze PhD, Sanne J.H. van Rooij PhD, Tim Varkevisser MS, Katie A. McLaughlin PhD, Margaret A. Sheridan PhD, Matthew Peverill BA, Kelly Sambrook PhD, Dick J. Veltman PhD, Kathleen Thomaes MD, Steven M. Nelson PhD, Geoffrey May MD, Lee Baugh PhD, Gina Forster PhD, Raluca Simons PhD, Jeffrey Simons PhD, Vincent Magnotta PhD, Kelene A Fercho PhD, Adi Maron-Katz PhD, Stefan du Plessis MBChB PhD, Seth Disner PhD, Nicholas Davenport PhD, Sophia I. Thomopoulos BA.
Benjamin Suarez-Jimenez, PhD, Tor D. Wager, PhD, Yuval Neria PhD, Negar Fani PhD, Henrik Walter MD PhD, Inga Koerte MD PhD, Jessica Bomyea PhD, Kyle Choi MPH, Alan N. Simmons, PhD, Elizabeth Olson, PhD, Isabelle Rosso, PhD, Thomas Straube PhD, Theo G.M. van Erp PhD, Christine L. Baird BS, Sarah Laskowitz BS, Tian Chen PhD, Andrew S. Cotton MS, John Wall PhD, Richard J. Davidson, Terri deRoon-Cassini, Jacklynn Fitzgerald PhD, Christine Larson PhD, Evan Gordon PhD, Dan Grupe PhD, Scott R. Sponheim PhD, Amit Etkin MD PhD, Soraya Seedat MBChB MMed (Psych) PhD, Ilan Harpaz-Rotem PhD ABPP, Kristen Wrocklage PhD, Chadi G. Abdallah MD, John H. Krystal MD, Ifat Levy PhD, Hassaan Gomaa MD, Mary Agnes B. McMahon MS, Israel Liberzon MD, Xin Wang MD PhD.
Authors' Contributions
G.R.: Conceptualization, methodology, software, investigation, formal analysis, writing–original draft. M.W.L.: Methodology, formal analysis. E.C.-R.: Methodology, software. C.H.: Data curation. P.T. and M.D.D.: Methodology. R.A.M. and D.S.: Conceptualization, methodology, software, investigation, formal analysis, writing–review and editing.
Author Disclosure Statement
P.M.T. received partial research support from Biogen, Inc. (Boston, MA) for research unrelated to the topic of this manuscript.
Funding Information
This work was supported by Department of Veterans Affairs under grant number I01CX002293 (R.A.M.), National Institute of Mental Health (NIMH) under grant numbers R01MH111671 (R.A.M.) and R01MH129832 (R.A.M.).
Supplementary Material
Supplementary Data
Supplementary Table S1
Supplementary Table S2
Supplementary Table S3
Supplementary Table S4
Supplementary Table S5
Supplementary Table S6
Supplementary Table S7
Supplementary Table S8
Supplementary Table S9
Supplementary Table S10
Supplementary Table S11
Supplementary Figure S1
References
Supplementary Material
Please find the following supplemental material available below.
For Open Access articles published under a Creative Commons License, all supplemental material carries the same license as the article it is associated with.
For non-Open Access articles published, all supplemental material carries a non-exclusive license, and permission requests for re-use of supplemental material or any part of supplemental material shall be sent directly to the copyright owner as specified in the copyright notice associated with the article.