
Abstract
Objective:
Alzheimer's disease (AD) is the most common neurodegenerative disease. The predominantly sporadic form of AD is age-related, but the underlying pathogenic mechanisms remain not fully understood. Current efforts to combat the disease focus on the main pathological hallmarks, in particular beta-amyloid (Aβ) plaque pathology. According to the amyloid cascade hypothesis, Aβ is the critical early initiator of AD pathogenesis. Plaque pathology is very heterogeneous, where a subset of plaques, neuritic plaques (NPs), are considered most neurotoxic rendering their in-depth characterization essential to understand Aβ pathogenicity.
Methods:
To delineate the chemical traits specific to NP types, we investigated senile Aβ pathology in the postmortem, human sporadic AD brain using advanced correlative biochemical imaging based on immunofluorescence (IF) microscopy and mass spectrometry imaging (MSI).
Results:
Immunostaining-guided MSI identified distinct Aβ signatures of NPs characterized by increased Aβ1–42(ox) and Aβ2–42. Moreover, correlation with a marker of dystrophy (reticulon 3 [RTN3]) identified key Aβ species that both delineate NPs and display association with neuritic dystrophy.
Conclusion:
Together, these correlative imaging data shed light on the complex biochemical architecture of NPs and associated dystrophic neurites. These in turn are obvious targets for disease-modifying treatment strategies, as well as novel biomarkers of Aβ pathogenicity.
Impact Statement
Using advanced biochemical imaging tools, we delineate beta-amyloid (Aβ) signatures associated with neurotoxic plaque pathology in the postmortem human brain. The results implicate N-terminal Aβ processing and oxidative stress to be key in Aβ pathogenicity and neurotoxicity. These data highlight the great potential of mass spectrometry imaging to shed light on specific biochemically heterogeneous plaque morphologies, which cannot be delineated with conventional staining approaches. The distinct molecular traits identified for neuritic plaque pathology are in turn obvious targets for disease-modifying treatments, as well as potential novel biomarkers of Aβ pathogenicity.
Introduction
A
Here, diversity of Aβ aggregates, linked to Aβ peptide species, is considered an important driver of pathological changes. This component of AD pathology, however, is still poorly characterized. Nevertheless, the relevance of Aβ, and particularly its aggregates in AD, has seen a recent resurgence following the Food and Drug Administration (FDA) approval of aducanumab, a monoclonal antibody targeting aggregated Aβ (Sevigny et al, 2016). There are also several submissions for accelerated approval of additional biologics, for example, lecanemab and donanemab. Lecanemab reduces Aβ deposition by binding to the protofibrils of Aβ (Swanson et al, 2021), and donanemab interacts with pyroglutamated aggregates present in the core of the plaques and prevents growth of the plaques (Bayer, 2022). On the diagnostic side, a blood test for diagnosing AD by measuring Aβ isoforms was recently approved by the FDA (PrecivityAD) (Kirmess et al, 2021).
Extracellular Aβ plaques constitute a highly heterogeneous population that are commonly annotated as thioflavin (Th) or Congo red (CR)-positive cored plaques and conversely Th/CR-negative diffuse plaques. Moreover, a subset of Th-positive plaques includes neuritic plaques (NPs) that are characterized by the presence of neurites. These neurites are composed of pre-helical tau protein filaments, and hyperphosphorylation of these tau filaments is one of the earliest cytoskeletal changes observed in the neurites associated with NPs (Su et al, 1996). Biochemically, these neurites and NPs, respectively, can be delineated by immunohistochemistry (IHC) using an anti-paired helical filament (PHF)-1 antibody that recognizes Tau species doubly phosphorylated at Ser396 and Ser404 (Otvos et al, 1994).
Furthermore, NPs are found to be associated with neuronal aberrations, referred to as dystrophic neurites (DN) that are abnormal neuritic sprouting, swollen dendrites, and/or axons scattered throughout the gray matter in AD brain. The presence and prevalence of DNs was found to correlate with synaptic degradation (Shi et al, 2009). DNs associates with amyloid plaque pathology (i.e., NPs) but show localizations unaffiliated with amyloid deposits (Dickson et al, 1999; Lenders et al, 1989). Histochemical, immunohistochemical, and electron microscopy analyses of plaque-associated dystrophic neurites showed that those structures contain many proteins, including synaptic and axonal proteins such as phosphorylated Tau, amyloid precursor protein, neurofilaments, ubiquitin, pentraxins, and reticulon (Lenders et al, 1989; Sharoar et al, 2019).
Specifically, reticulon 3 (RTN3) is an abundant constituent of tubular endoplasmic reticulum (ER), and consequently, abundant levels of RTN3 are released during ER degradation (Grumati et al, 2017) such as in dystrophia. Interestingly, RTN3 has been demonstrated to label an abundant population of DNs in AD brains that was associated with cognitive decline (Shi et al, 2009), and most importantly, association of RTN3-immunopositive dystrophic neurites was found to be associated with NPs but was not witnessed around other plaque types (Hu et al, 2007). Together, PHF and RTN3 have been demonstrated to be robust tools to differently outline NPs among complex and heterogeneous amyloid plaque pathology in postmortem human AD brain tissue. Given the association of NP and the associated DNs with synaptic and neuronal degeneration further biochemical characterization of NP types are of great relevance.
More so, characterizing the Aβ makeup of NPs could be critical important to further understand the relation of Aβ pathology and neurodegenerative downstream processes. In addition, those NP-specific Aβ signatures are obvious drug targets and can further serve as fluid biomarkers indicative of NP pathology and Aβ pathogenicity. In situ characterization of Aβ isoforms is challenging when using conventional immuno-based methods. These challenges are overcome with the advent of matrix-assisted laser desorption ionization (MALDI)-based mass spectrometry imaging (MSI), which is an emerging powerful biochemical imaging technology well suited for in situ Aβ peptide analysis at the single plaque level (Hanrieder et al, 2011; Michno et al, 2021; Michno et al, 2020; Michno et al, 2019a; Michno et al, 2019b).
In this study, we set out to interrogate the differences of neuritic and non-neuritic cored plaques in postmortem human sporadic form of AD (sAD) brain. For this, we devised a correlative chemical imaging strategy comprising fluorescent amyloid staining with luminescent conjugated oligothiophenes (LCO; tetrameric formyl thiophene acetic acid [q-FTAA] and heptameric formyl thiophene acetic acid [h-FTAA]) along with IHC markers of NPs (PHF-1) (Dickson and Vickers, 2001; Moloney et al, 2021) and dystrophic neurites (RTN3) (Shi et al, 2009). The correlative IHC/LCO signatures were used together to guide subsequent MSI analysis on the facing surface of the consecutive (i.e., sequential) tissue section (mirror section) to determine the associated Aβ signatures of those individual plaque types.
Together, the correlative LCO/IHC and MALDI MSI revealed increased levels of Aβ1–42(ox) and Aβ2–42 in neuritic (PHF+) compared with non-neuritic (PHF−) cored plaques.
Materials and Methods
Chemicals and reagents
All chemicals for matrix and solvent preparation were pro-analysis grade and obtained from Sigma–Aldrich/Merck (St. Louis, MO, USA), unless otherwise specified. TissueTek optimal cutting temperature (OCT) compound was purchased from Sakura Finetek (Cat. No.: 4583; AJ Alphen aan den Rijn, The Netherlands). Deionized water was obtained by a Milli-Q purification system (Millipore Corporation, Merck, Darmstadt, Germany).
Patient samples
Fresh brain tissue samples were obtained from the superior temporal cortex of three clinically and pathologically diagnosed sAD patients (Table 1). All cases were obtained through the brain donation program of the Queen Square Brain Bank for Neurological Disorders (QSBB), Department of Clinical and Movement Neurosciences, University College London (UCL) Queen Square Institute of Neurology. The standard diagnostic criteria were used for the neuropathological diagnosis of AD (Montine et al, 2012). Ethical approval for the study was obtained from the Local Research Ethics Committee of the National Hospital for Neurology and Neurosurgery as well as the Institutional Review Board at the University of Gothenburg (Gothenburg, April 16, 2015; DNr 012-15). All studies abide by the principles of the Declaration of Helsinki.
Demographic Data
AAD, age at death; AAO, age at onset; CERAD, Consortium to Establish a Registry for Alzheimer's Disease; ABC, combined score based on Thal phase, Braak stage, and CERAD score; PCA, posterior cortical atrophy; PMD, postmortem delay.
Sample preparation
Sequential tissue sections (12 μm) were collected on a cryostat microtome (Leica CM1900; Leica Biosystems, Nussloch, Germany) as a set of mirror sections, that is, with the facing surfaces of two sequential sections placed upward on individual glasses for the respective, orthogonal imaging experiments (immunofluorescence [IF] vs. MSI). The operating temperature of the cryostat was maintained at −18°C to −20°C. Utmost care was taken to avoid the interference of the OCT mounting media while sectioning the brain tissues.
These mirror sections provide access to the two closest possible surfaces. One of the mirror sections is thaw-mounted on to the super frost slides for fluorescent microscopy while the other onto the charged surface of the indium tin oxide-coated, conductive glass slides (Cat. No.: 237001; Bruker Daltonics GmbH & Co. KG, Bremen, Germany) for MALDI imaging. Brain sections from all the patients included in the study are collected in a similar operating condition. All samples were stored at −80°C until further use. Before matrix deposition, samples were thawed in a desiccator under reduced pressure for 30 min.
Immunohistochemistry
For immunohistochemistry and fluorescent amyloid imaging, sections on superfrost glasses were fixed in gradient concentration of ice-cold 95%, 70% ethanol, and 1 × phosphate-buffered saline (PBS) at room temperature. Sections were then blocked with (bovine serum albumin, normal goat serum [NGS], Triton [0.1%] in PBS [PBST]) for a period of 90 min at room temperature. The sections were then incubated with cocktail of two primary antibodies PHF-1 (Courtesy of Dr. Peter Davies, Feinstein Institute for Medical Research) and RTN3 (Cat. No. ABN1723) diluted in PBS-T with 0.2% NGS (PHF-1: 1:500 and RTN3: 1:1000) for over 18 h at 4°C.
Sections were washed with 0.1% PBST and incubated with secondary antibodies (Alexa Fluor 594, Cat. No. A32740; Alexa Fluor 647, Cat. No. A32728) for a duration of 60 min at room temperature. All the brain sections were then treated with autofluorescence quenching agent TrueBlack™ 1 × for 30 sec and are later subjected to three PBS washes of 5 min each. To stain amyloid and tau morphologies, antibody-stained sections were incubated with two previously validated LCO fluorophores (q-FTAA, 2.4 μM in Milli-Q water, and h-FTAA, 0.77 μM in Milli-Q water) in the dark for 25 min. Subsequently, the sections were subjected to a single 10 min 1 × PBS wash followed by mounting with DAKO fluorescent mounting media and incubated in the dark for 24 h until further imaging.
Fluorescent microscopy
The multichannel imaging of immuno-stained human brain sections was performed using an automatic widefield microscope (Axio Observer Z1; Zeiss, Germany). Large multichannel tile scans were captured using enhanced green fluorescent protein (EGFP) filter, Alexa Fluor 594, and Alexa Fluor 647 filter sets. All the images were captured using Plan Apochromat 20 × /0.8 DIC air objective lens. The acquisition settings were adjusted to prevent saturation or bleed through during the acquisition of multichannel images acquired with EGFP/Alexa Fluor 594/Alexa Fluor 647 filter sets.
Image analysis
FIJI ImageJ was used for postprocessing of images. Here, files from each channel were split into grayscale images and are subjected to background subtraction. Here, EGFP/green channel with LCO-stained plaques are used as a reference image for marking the regions occupied by plaques. Segmentation was performed on green channel using the Li threshold method. Wand tool was used to mark the segmentation and is saved to regions of interest (ROI) manager. These ROI annotations are used to acquire intensity measurement from the corresponding grayscale image of anti-PHF-1/red channel and anti-RTN3/blue channel. Fluorescence intensities were calculated as intensity/μm2.
All amyloid plaques were identified based on the LCO fluorescent signal (LOC+) and further divided into two groups based on the immunoreactivity toward PHF-1. If a plaque showed positive immunoreactivity for PHF-1, then the plaque was referred to as PHF+/neuritic or else was referred to as PHF−/non-neuritic. Furthermore, all LCO+ plaques were investigated for RTN3 immunoreactive dystrophic neurites (RINDs). Here, only LCO+/PHF+ plaques showed the presence of RINDs.
MALDI MSI sample preparation
For amyloid peptide imaging, we employed a previously validated protocol for robust peptide and protein MALDI MSI (Michno et al, 2019a). Frozen tissue sections were thawed and dried under vacuum for 15 min. A series of sequential washes of 100% EtOH (60 sec), 70% EtOH (30 sec), Carnoy's fluid (6:3:1 EtOH/CHCl3/acetic acid) (90 sec), 100% EtOH (15 sec), H2O with 0.2% TFA (60 sec), and 100% EtOH (15 sec) were carried out. Tissues were subjected to formic acid vapor for 20 min. A mixture of 2,5-dihydroxyacetophenone (2,5-DHAP) and 2,3,4,5,6-pentafluoroacetophenone (PFAP) was used as matrix compound and applied using a HTX TM-Sprayer (HTX Technologies LLC, Carrboro, NC, USA).
A matrix solution of 5.7 μL/mL of PFAP and 9.1 mg/mL of DHAP in 70% ACN(aq) and 2% acetic acid/2% TFA was sprayed onto the tissue sections using the following instrumental parameters: nitrogen flow (10 PSI), spray temperature (75°C), nozzle height (40 mm), eight passes with offsets and rotations, spray velocity (1000 mm/min), and isocratic flow of 100 μL/min using 70% ACN as pushing solvent.
Matrix-assisted laser desorption ionization mass spectrometry imaging
MALDI MSI experiments were performed on a rapifleX MALDI-TOF instrument (Bruker Daltonics) using the Flex Imaging (v5.0; Bruker Daltonics). Measurements were performed at 10 μm spatial resolution, at a laser pulse frequency of 10 kHz with 200 shots collected per pixel. Data were acquired in linear positive mode in the mass range of 1500–6000 Da (mass resolution: m/Δm = 1000 (FWHM) at m/z 4515). Pre-acquisition calibration of the system was performed using a combination of peptide calibration standard II and protein calibration standard I, to ensure calibration over the entire range of potential Aβ species.
Data processing and image analysis
LCO+/PHF+ and LCO+/PHF− plaques were identified from the tile scan images obtained from the IF microscopy. These plaques were identified across the whole tissue sections (∼1 cm2) for each patient involved in the study. These tile scans were overlayed and aligned onto single ion images obtained from MALDI MSI on the sequential tissue section. The IF microscopy signatures were used to guide annotation of single plaques in the MALDI MSI data as ROI for further statistical analysis of mass spectrometry (MS) peak data using Flex Imaging (v5.0; Bruker Daltonics). MS peak data from N = 5–10 ROI (plaques per subtype) across n = 3 patient samples were exported as *.CSV files and imported into Origin (version 8.1; OriginLab, Northampton, MA, USA). Bin borders were generated using the Peak Analyzer function in Origin. Peak bin area values were obtained using an in-house developed R script as described previously (Hanrieder et al, 2011). All the data were compiled, and log normalized in Excel.
Average peak data from the different plaque-ROI were analyzed by grouped, univariate statistical comparisons of the respective plaque subtypes (PHF+/PHF−) across patients by means of paired t-statistics (p < 0.05) using Prism (v.9; GraphPad, San Diego, CA, USA).
Results
PHF-1 and RTN3 delineate NP pathology
We devised a correlative multimodal plaque imaging paradigm (Fig. 1), where IHC signatures obtained from one section guide MALDI based plaque analysis of Aβ signatures on the facing surface of the consecutive section. On section 1, plaques were stained with fluorescent amyloid probes (LCO) (Nyström et al, 2017) along with markers of NPs (PHF-1) and dystrophic neurites (RTN3). This was followed by MALDI MSI on the consecutive section and yielded a total of 7–10 plaques per subtype (PHF+ and PHF−) and patient that could be delineated with both correlative imaging techniques.
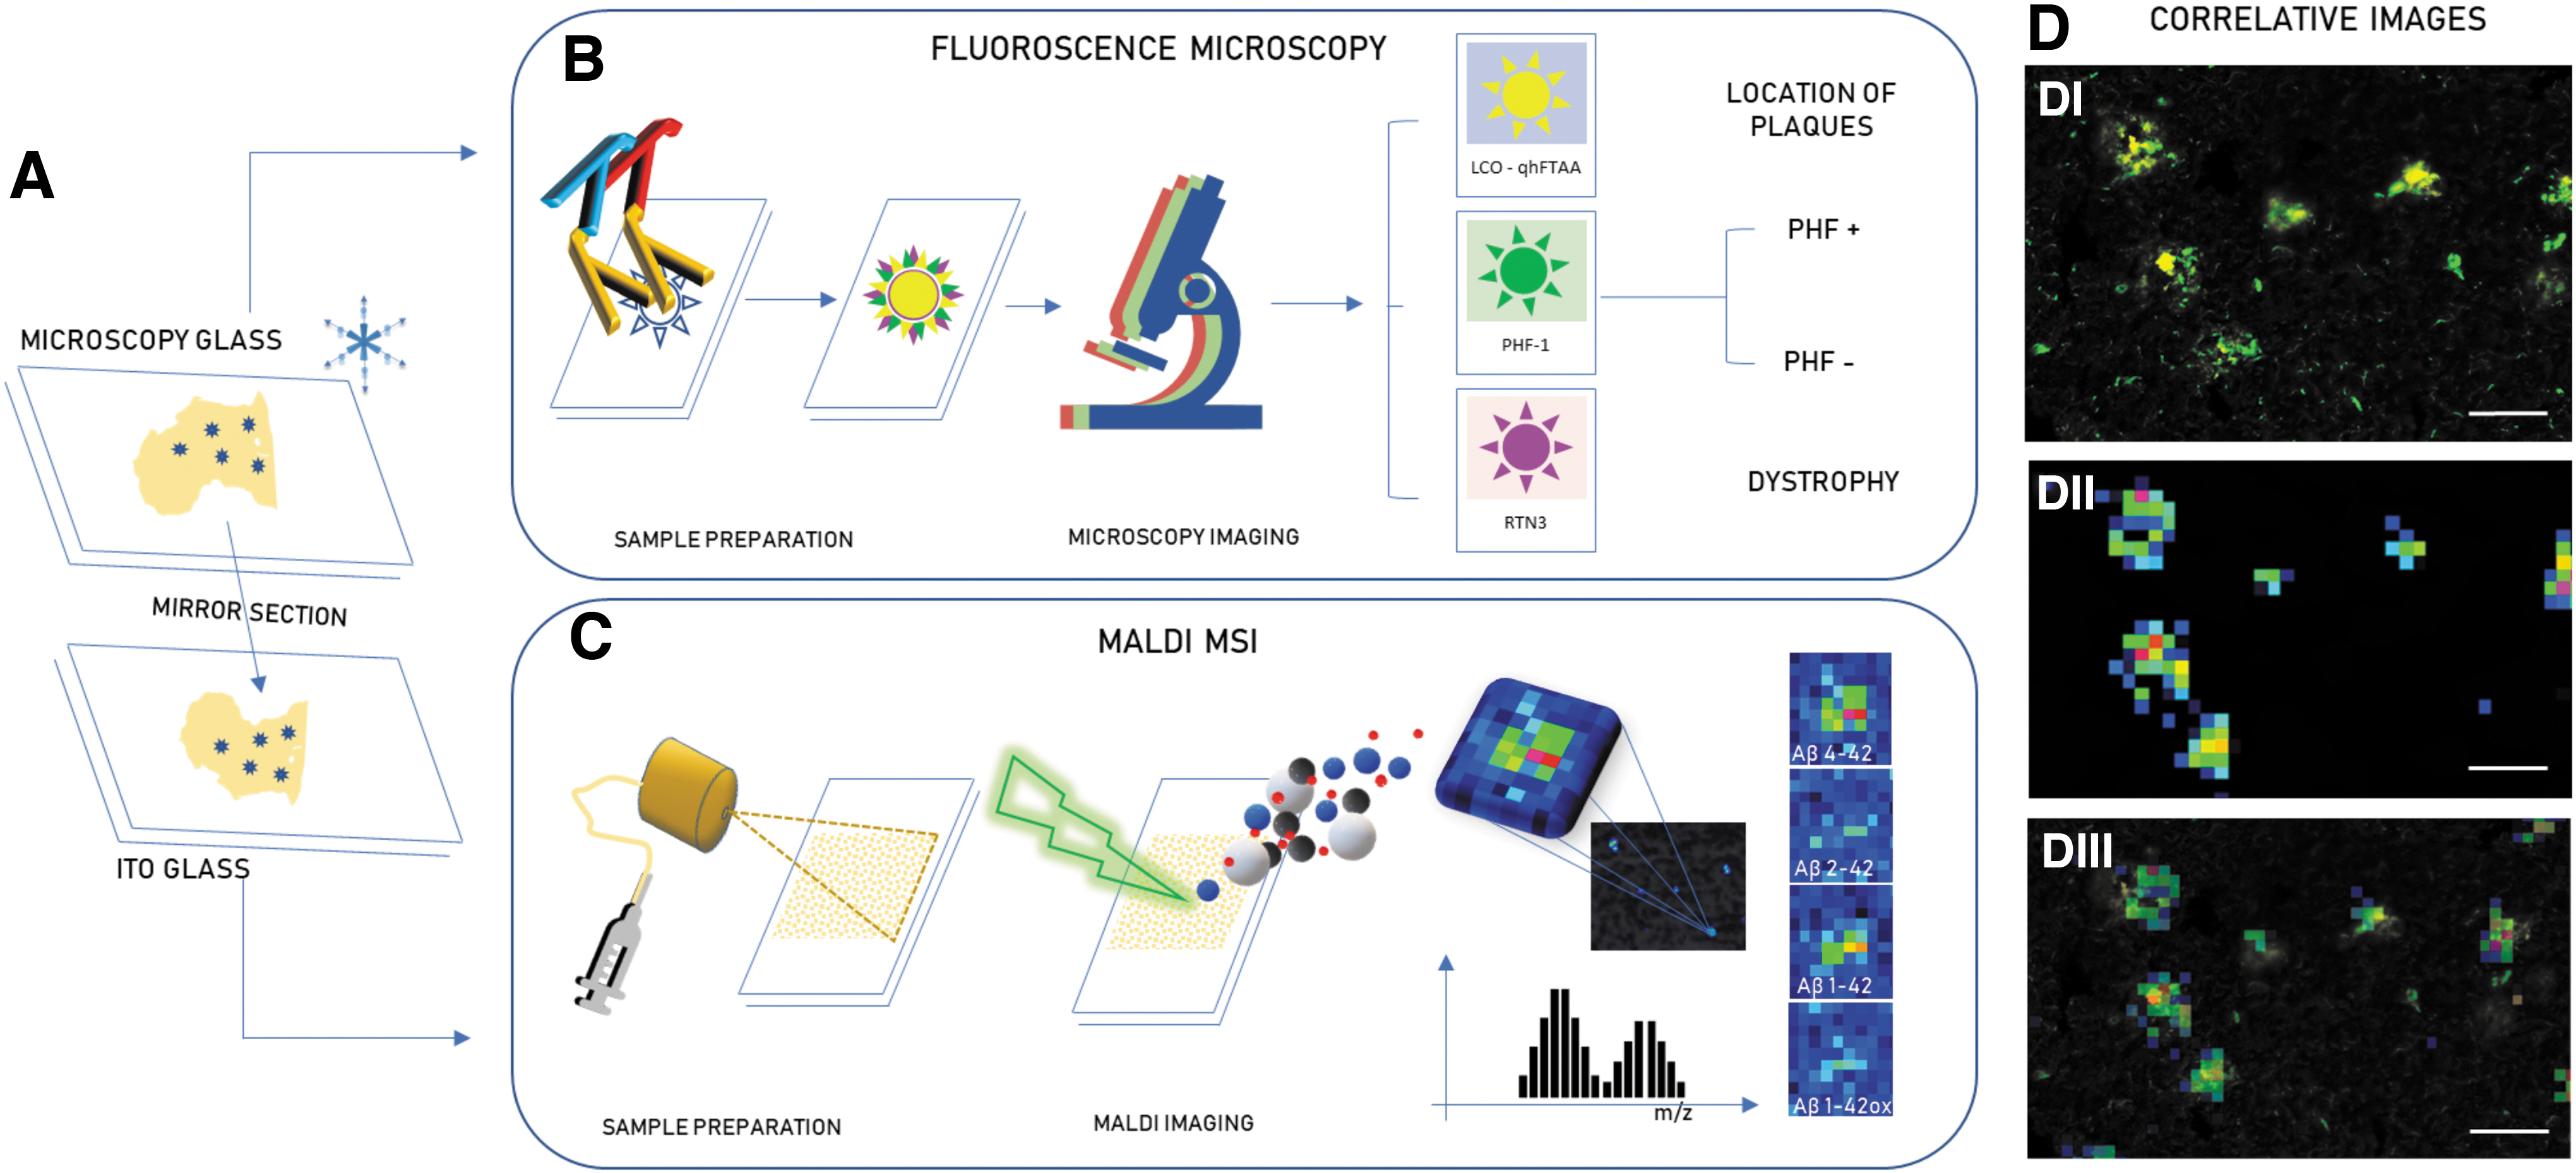
Correlative imaging of senile plaques.
In accordance with previous reports on PHF-1 staining of NPs, we observed LCO+/PHF+ (neuritic) and LCO+/PHF− (non-neuritic) plaques. (Fig. 2A, B I–III) (Hu et al, 2007). Similarly, all the LCO+/PHF+ plaques observed in our study were also found to be associated with RTN3+ dystrophic neurites, whereas all LCO+/PHF− showed no presence of RINDs (Fig. 2A, B IV).
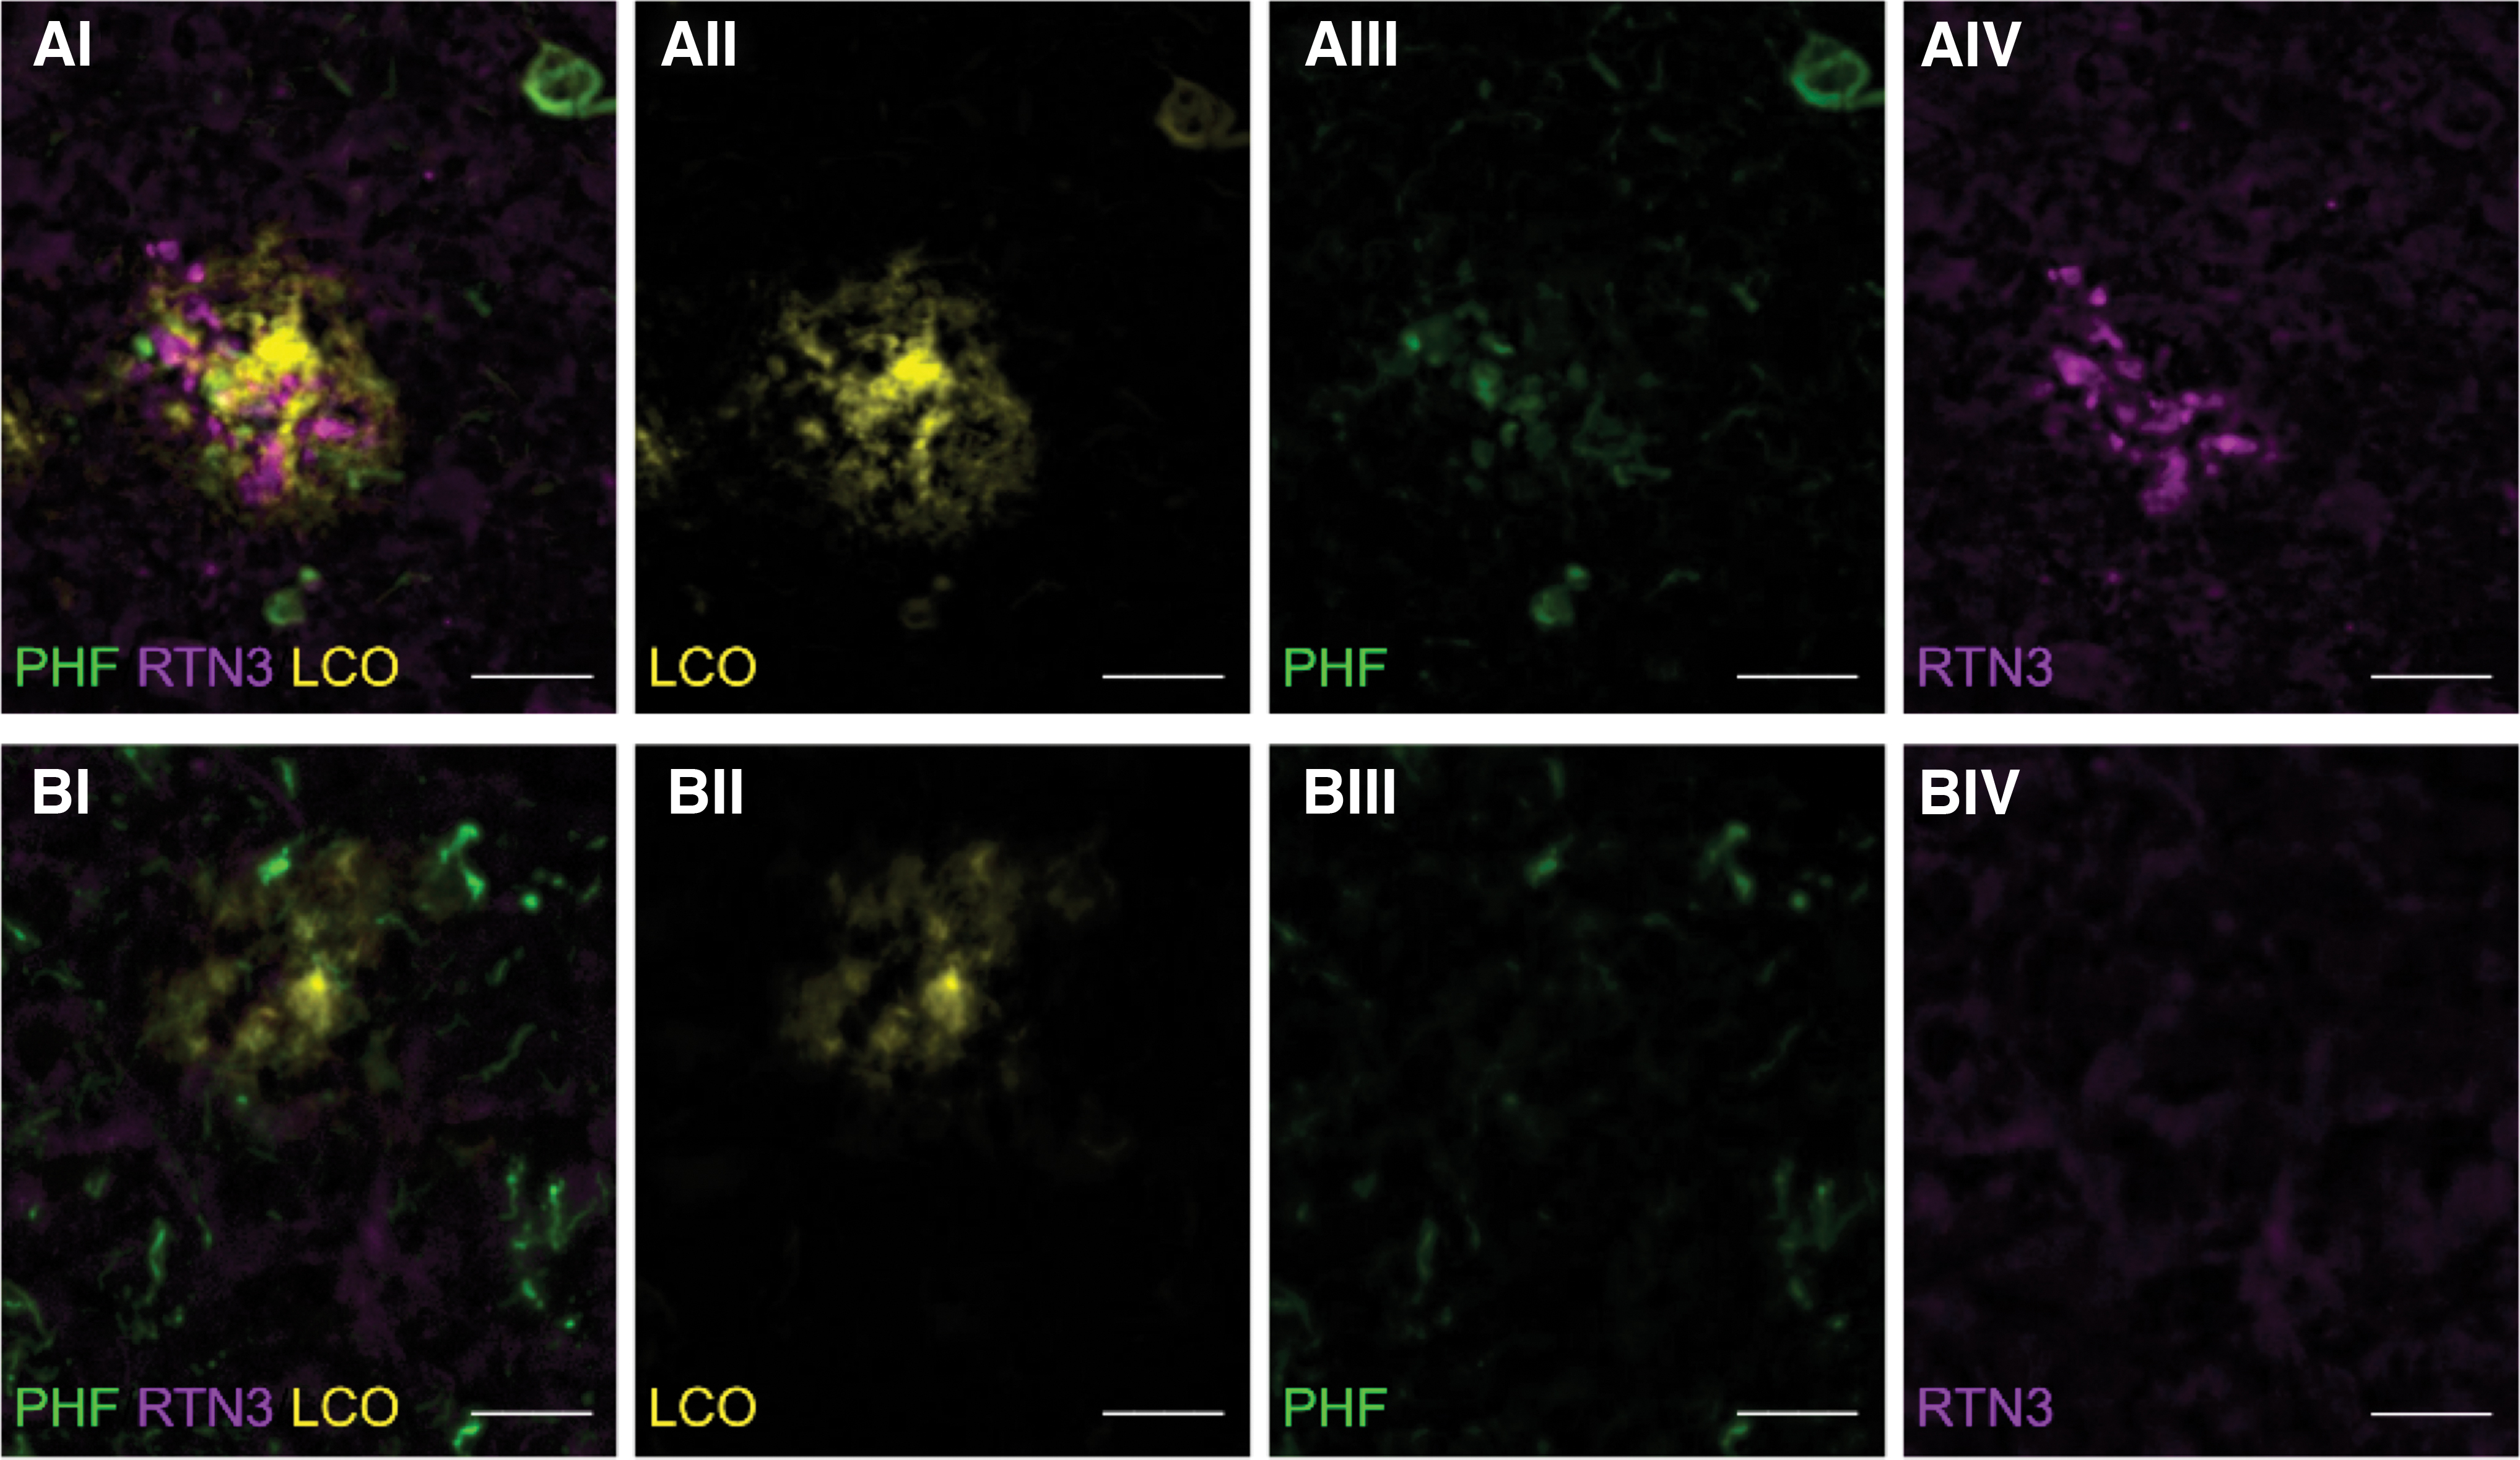
Immunohistochemistry of PHF+ and PHF− plaques and quantification of RTN3.
IHC-guided MALDI MSI identifies Aβ signatures of NPs
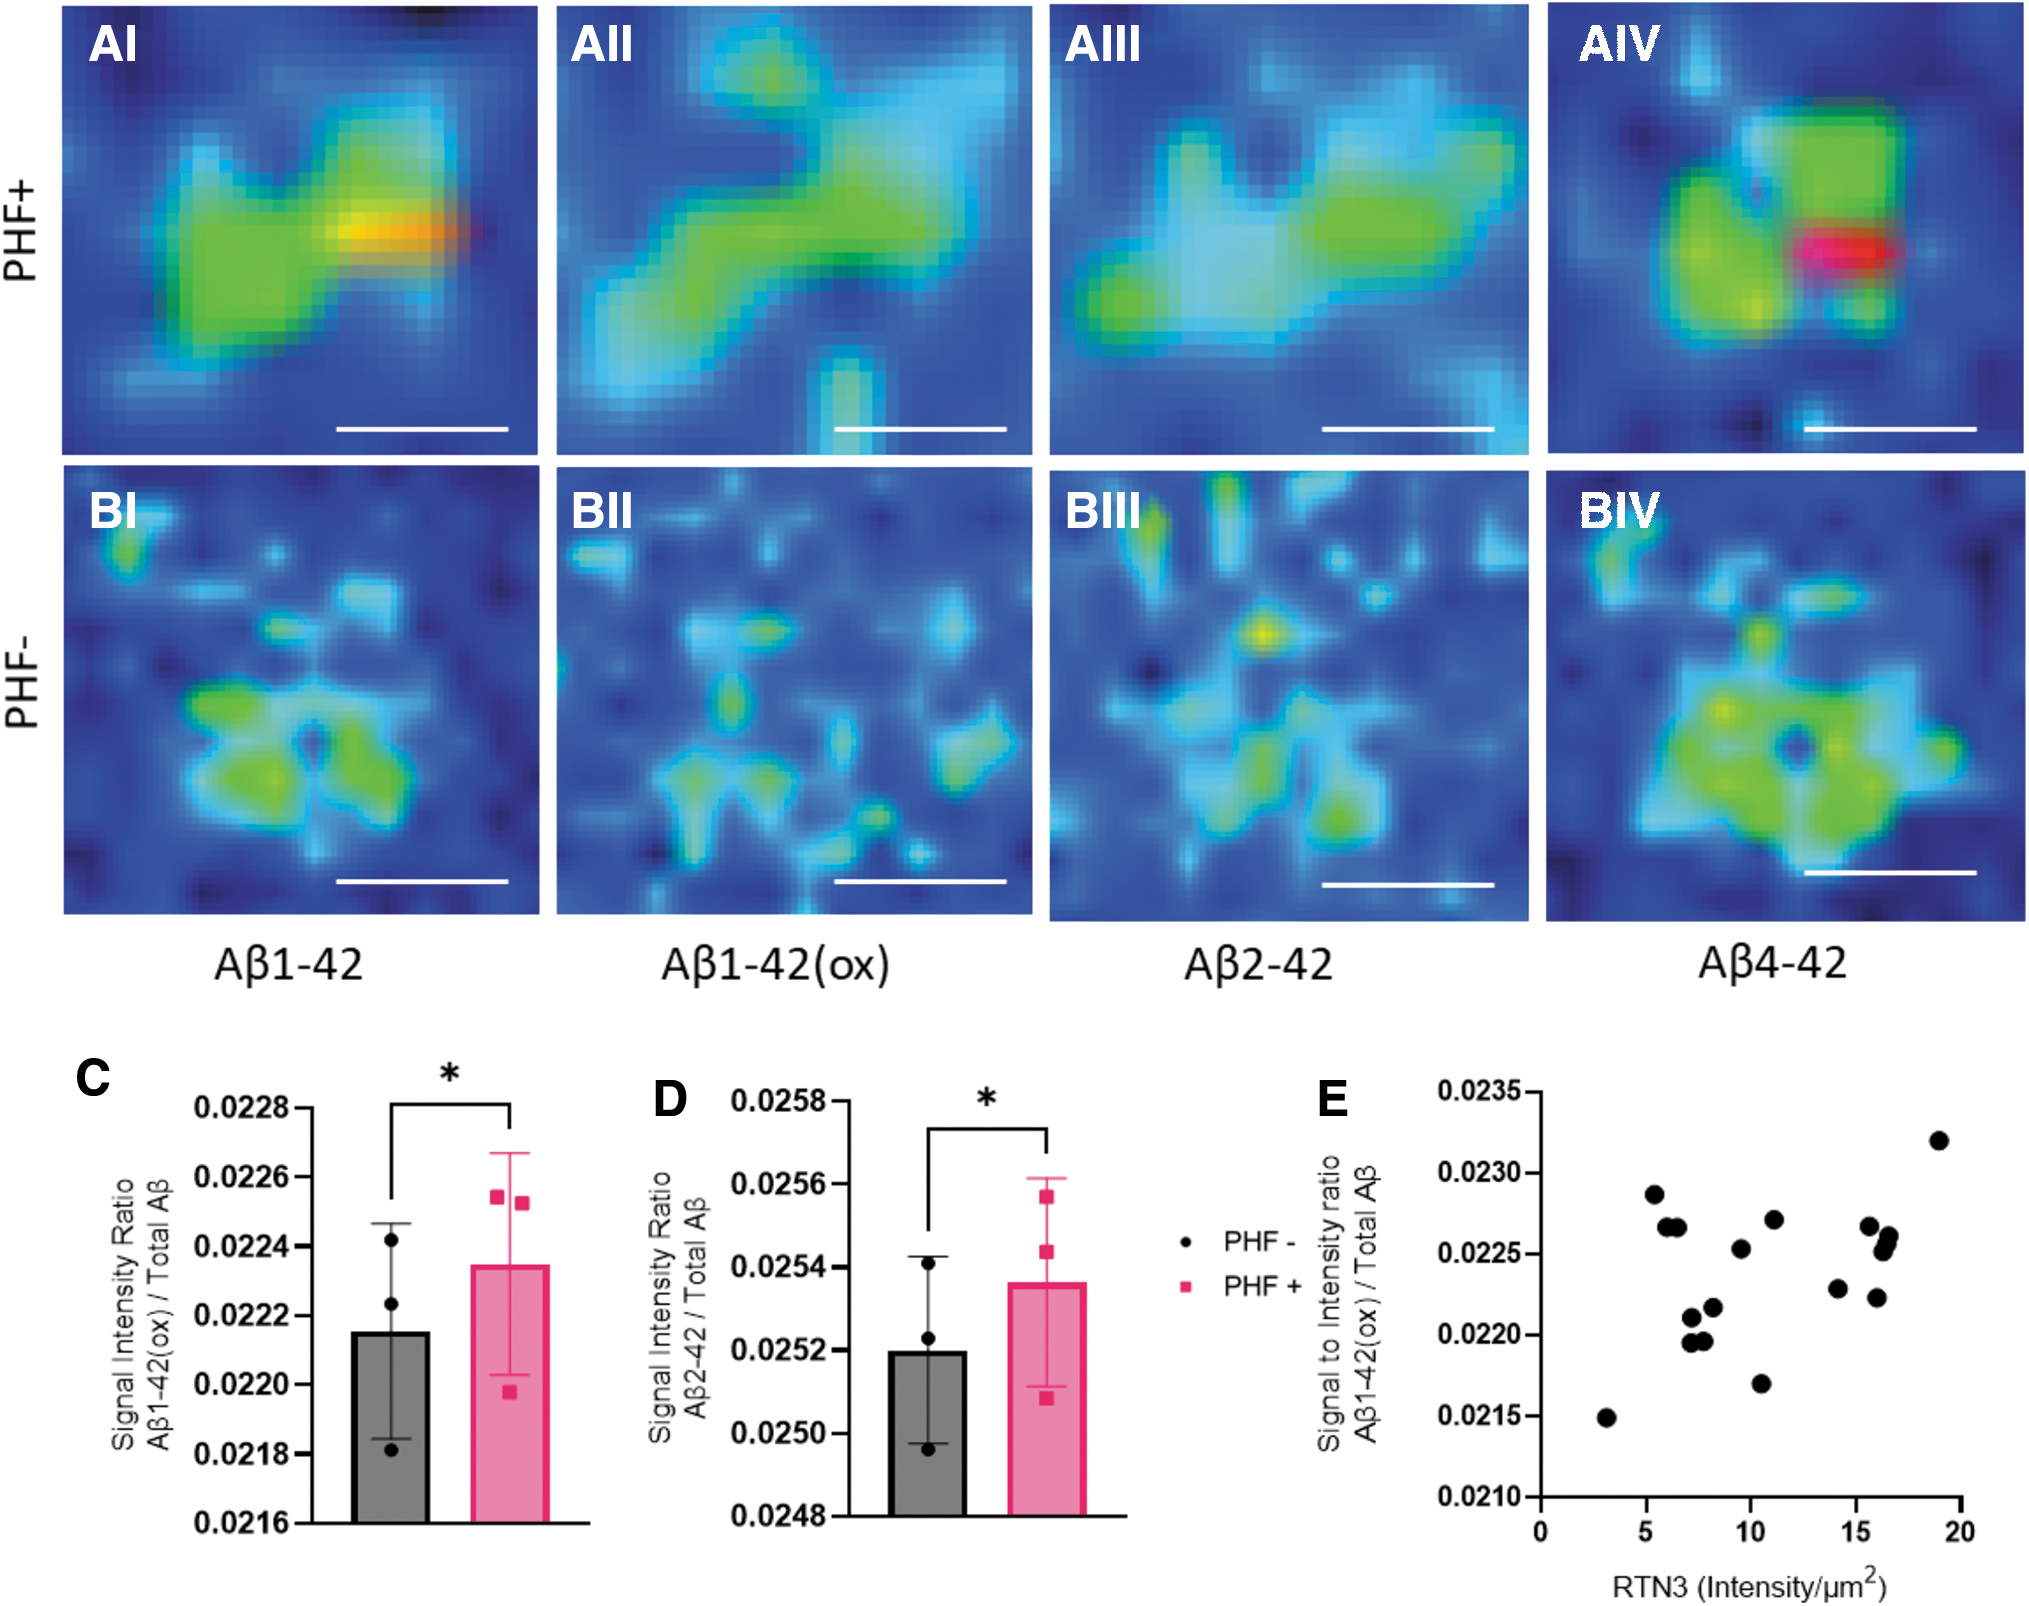
To explore the amyloid signatures of NPs, we performed MALDI imaging on the corresponding mirror section. The aim was to analyze the same population of the plaques identified in the immunostaining on the mirror section. Using IF microscopy, LCO+/PHF+ and LCO+/PHF− plaques were outlined across entire cortical brain tissue sections (∼1 cm2) from each patient involved in the study. The IF (LCO/PHF) signatures were co-registered with the MALDI MSI data to guide the annotation of plaques into neuritic (LCO+/PHF+) or non-neuritic (LCO+/PHF−). A total of 44 plaques (22 neuritic, 22 non-neuritic cored) were annotated across three patient samples. MALDI MSI signature from the PHF+/− plaque populations were extracted, binned, and statistically analyzed for differences in Aβ content (Table 2). Across all detected Aβ species, Aβ1–42(ox) (m/z 4528) and Aβ2–42 (m/z 4398) were found to be significantly higher in neuritic (LCO+/PHF+) than in non-neuritic cored plaques (LCO+/PHF−) (Fig. 3).
MALDI imaging MS of amyloid plaques.
Masses of the Detected Beta-Amyloid (Aβ)Isoforms
Aβ peptide patterns in NPs correlate with plaque-associated dystrophic neurites
To validate the neuritic identity of NP, we used both PHF and RTN3 to outline NPs in situ. While the first aim was to classify senile cored plaques into NP and non-NP, we then moved on to investigate whether the neuritic marker's IF intensity correlated with the levels of the different Aβ species within each plaque. Here, Aβ1–42(ox) (R = 0.2090, p = 0.0282) but not Aβ2–42 showed a significant correlation with RTN3 (intensity/μm2) IF. In contrast, no positive correlation was observed for any of the Aβ peptides with PHF.
Discussion
Amyloid plaques show a variety of morphologies, described historically as diffuse, cored, neuritic, compact, fibrillar, and others. They vary from each other in terms of their maturity of fibrils, density of the accumulated fibrils, and in some cases, their composition. The presence of these plaques in the brain is the source of immunogenic stimuli in the surrounding neurons and glia. This alteration in the homeostasis of the brain regions could trigger dystrophy in neurons present in the microenvironment around the plaques.
The characterization of senile plaques in postmortem brain tissue has for decades relied on histochemical, immunohistochemical, or immunofluorescent detection. This approach has two significant limitations with respect to specificity and the ability for comprehensive spatial detection of multiple truncated Aβ isoforms. We and others have previously demonstrated MALDI MSI to be a powerful tool to delineate Aβ peptide in situ on the single plaque level (Carlred et al, 2016; Kakuda et al, 2017; Michno et al, 2019a). One challenge, however, remains with respect to integrating MALDI MSI with IHC toward larger protein markers that cannot be detected with MALDI, such as RTN3 or Tau. Acquisition of fluorescent microscopy and MALDI MSI of peptides from the same tissue section is challenging due to laser distortion effects impeding subsequent immunolabeling and fluorescent imaging (Kaya et al, 2017).
In this first of its kind work, we employed a correlative chemical imaging approach to identify Aβ signatures associated with different populations of plaques, specifically NPs. We have previously shown that cored plaques show distinct signatures compared with diffuse plaques, which can be delineated morphologically using structure-sensitive probes that can be integrated in the MALDI MSI analysis from the same tissue. However, to delineate nondiffuse plaques, that is, mature/cored plaques including NPs, IHC-based plaque classification is necessary. We employed a methodology that involves the novel combination of correlative MSI and fluorescent microscopy, where we used PHF-1 antibody as a marker to differentiate NPs from non-neuritic deposits.
For fluorescence microscopy on human brain sections, an autofluorescence quenching agents—TrueBlack was used to neutralize the autofluorescence of lipofuscin. Also, secondary antibodies such as Alexa Fluor 594 (emission peaks at around 614 nm) and Alexa Fluor 647 (emission peaks at around 670 nm), which are infra-red and far-red–fluorescent dyes, respectively, are used to avoid overlap with the spectral emission range of lipofuscin (540–570 nm).
Fluorescent microscopy-based immunofluorescence and LCO staining allowed us to classify plaque types and guided MALDI MSI analyses to identify differences in Aβ patterns. With this approach, we observed that neuritic (LCO+/PHF+) were characterized by increased levels of Aβ1–42(ox) and Aβ2–42 compared with non-neuritic (LCO+/PHF−) plaques.
Previous studies have shown that compared with diffuse plaques, Th/CR-positive, mature, cored plaques show higher Aβ1–40 levels along with higher levels of AβpE3–42 and AβpE11–42 (Michno et al, 2019a). In the present study, Aβ1–40 was not found to be different between neuritic (LCO+/PHF+) and non-neuritic (LCO+/PHF−) plaques. In addition, there were no differences in the N-terminally truncated pyroglutamated forms of Aβx-42 (Aβ3pE-42 and Aβ11pE-42). This suggests that the PHF+ and PHF− status, rather than being related to maturity of a plaque, is a suitable marker of secondary mechanisms that are linked to neuronal pathology and dystrophy. Interestingly, analysis of the MALDI MSI identified Aβ2–42 to be significantly higher in PHF+ plaques compared with PHF− deposit.
Aβ2–42 has previously been implicated in plaque formation and aggregation dynamics (Wiltfang et al, 2001). Here, N-terminal truncations were found to synergistically increase the aggregation potential of Aβ peptides. This suggests that Aβ2–42 formation may serve as one of the initial factors for seeding aggregation preceding the formation of plaque core β-amyloid. This would also accelerate the aggregation kinetics of the fibrils, leading to increased amyloid deposition and aggregation, respectively. In line with these findings, Bibl et al (2012) reported low levels Aβ2–42 in AD cerebrospinal fluid (CSF) compared with non-demented controls and frontotemporal dementia. Interestingly, CSF Aβ2–42 was diagnostically a stronger indicator of AD than Aβ1–40/1–42, which suggests that indeed Aβ2–42 might detect neurodegeneration-associated amyloid plaques pathology, that is, NPs rather than general plaque load as indicated by Aβ1–40/1–42.
Another finding of our work was that Aβ1–42ox was increased in NPs compared with other non-neuritic plaques and suggests involvement of oxidative stress on NP pathology. Furthermore, Aβ1–42(ox) was observed to correlate with NP-associated dystrophy as indicated by RTN3 immunolabeling.
This is relevant as oxidative stress has been identified a key mechanism upon which amyloid may exert its pathogenicity. Specifically, amyloid pathogenicity was suggested to involve intracellular disturbance of mitochondrial function leading to generation of reactive oxygen species and subsequent intraneuronal cytotoxic mechanism that eventually leads to neuronal cell death (Cheignon et al, 2018). Specifically, Aβ1–42 has been shown to induce oxidative stress, catalyzing the formation of reactive oxygen species and downstream neurotoxic processes including conformational changes and oxidation of membrane proteins as well as lipid peroxidation (Butterfield and Boyd-Kimball, 2018; Ko et al, 2015; Yan et al, 1994). Importantly, Aβ-induced generation of reactive oxygen species and oxidative stress, respectively, has been demonstrated to affect neuronal processes and result in structural changes in DN that are associated with NPs (Garcia-Alloza et al, 2006).
Furthermore, a prolonged exposure of neurons to Aβ was found to induce ER stress and ER stress-mediated autophagy, respectively, that triggers caspase-mediated apoptotic pathways (Costa et al, 2012; Nakagawa et al, 2000). Previous reports demonstrated a surge in RTN3 expression with increase in ER stress as an antiapoptotic response (Wan et al, 2007). Hence, elevated RTN3 levels in NPs and the correlation of RIND with Aβ1–42ox point toward Aβ-induced ER stress and oxidative stress, including ROS-mediated ER stress that affect neural processes and ultimately result DN formation.
Dystrophic neurites are swollen, dysfunctional presynaptic terminals that are found across and around NPs. DN can be found in different forms including axonal dystrophy, which is the prominent kind of dystrophy observed for neurons. DNs are indicative of pathological processes including altered axonal transport (Shi et al, 2009) and cytoskeletal changes (Dickson et al, 1999). Such axonal alterations would result in axonal dystrophy, which has been associated with the presence of amyloid plaques. As hypothesized by Shi et al (2009), prolonged deposition of amyloid deposits results in the microtubule disruption and changes associated with autophagy. This can result in the accumulation of one of the autophagy-associated proteins such as RTN3, and axonal swelling in the neurons present around the amyloid deposition. Increase in the amyloid deposition increases the size of the plaques, thus bringing a greater number of surrounding neuronal processes in contact of the plaques, contributing to increased number of dystrophies.
Interestingly, increased expression of RTN3 in the regions of the marked plaques indicates axonal dystrophy prevailing in the axons of neurons. The observed correlation of RTN3 with one of the Aβ species (Aβ1–42(ox)) that were increased in NPs further adds to the notion that axonal dystrophy is one of the characteristic feature of NP pathology (Dickson et al, 1999; Oakley et al, 2006; Sharoar et al, 2019; Shi et al, 2009).
Conclusion
The present study represents the first of its kind to delineate the biochemical characteristics of neuritic Aβ plaque pathology using advanced correlative immunostaining-guided MSI. The results show that NPs are chemically different from other cored plaque deposits with respect to their Aβ truncation and modification pattern. The identified Aβ signatures delineate NPs from other plaques as well as display association with dystrophy. This information is difficult to obtain with conventional biochemical imaging techniques and highlights the emerging role of MSI in biomedical research. Together, these correlative imaging data shed light on the complex biochemical architecture of NPs and associated dystrophic neurites. The molecular traits associated with NP pathology in turn are obvious targets for disease-modifying treatments, as well as potential novel biomarkers of Aβ pathogenicity.
Footnotes
Acknowledgments
We thank the staff at Centre for Cellular Imaging (CCI), Core Facilities, The Sahlgrenska Academy, University of Gothenburg, for help with development of the hyperspectral imaging paradigm and microscopy expertise. The Queen Square Brain Bank is supported by the Reta Lila Weston Institute of Neurological Studies, UCL Queen Square Institute of Neurology.
Authors' Contributions
J.H. conceived and designed the study. T.L. selected the cases from the QSBB archives. S.K., J.G., and D.J. performed the experiments. S.K., J.G., W.M., K.B., T.L., H.Z., and J.H. analyzed and discussed the data. S.K., W.M., and J.H. wrote the article.
Author Disclosure Statement
H.Z. has served at scientific advisory boards and/or as a consultant for Abbvie, Alector, ALZPath, Annexon, Apellis, Artery Therapeutics, AZTherapies, CogRx, Denali, Eisai, Nervgen, Novo Nordisk, Pinteon Therapeutics, Red Abbey Labs, reMYND, Passage Bio, Roche, Samumed, Siemens Healthineers, Triplet Therapeutics, and Wave, has given lectures in symposia sponsored by Cellectricon, Fujirebio, Alzecure, Biogen, and Roche, and is a co-founder of Brain Biomarker Solutions in Gothenburg AB (BBS), which is a part of the GU Ventures Incubator Program (outside submitted work). K.B. has served as a consultant, at advisory boards, or at data monitoring committees for Abcam, Axon, BioArctic, Biogen, JOMDD/Shimadzu. Julius Clinical, Lilly, MagQu, Novartis, Ono Pharma, Pharmatrophix, Prothena, Roche Diagnostics, and Siemens Healthineers and is a co-founder of Brain Biomarker Solutions in Gothenburg AB (BBS), which is a part of the GU Ventures Incubator Program, outside the work presented in this article.
Funding Information
J.H. is supported by the Swedish Research Council VR (Nos. 2018-02181 and 2019-02397), the Swedish Alzheimer Foundation (Nos. AF-968238 and AF-939767), and Åhlén-Stiftelsen (No. 213027). Stiftelsen Gamla Tjänarinnor (S.K., J.H., W.M., H.Z., and K.B.) and Gun och Bertil Stohnes Stiftelse (J.H., S.K., and W.M.) are acknowledged for financial support. W.M. is supported on a Postdoc grant from the Knut and Alice Wallenberg Foundation.
H.Z. is a Wallenberg Scholar supported by grants from the Swedish Research Council (Nos. 2018-02532 and 2019-02397), the European Research Council (Nos. 681712 and 101053962), Swedish State Support for Clinical Research (No. ALFGBG-71320), the Alzheimer Drug Discovery Foundation (ADDF), USA (No. 201809-2016862), the AD Strategic Fund and the Alzheimer's Association (Nos. ADSF-21-831376-C, ADSF-21-831381-C, and ADSF-21-831377-C), the Olav Thon Foundation, the Erling-Persson Family Foundation, Hjärnfonden, Sweden (No. FO2019-0228), the European Union's Horizon 2020 research and innovation program under the Marie Skłodowska-Curie grant Agreement No 860197 (MIRIADE), the European Union Joint Programme–Neurodegenerative Disease Research (JPND2021-00694), and the UK Dementia Research Institute at University College London (UKDRI-1003).
K.B. is supported by the Swedish Research Council (No. 2017-00915), the Alzheimer Drug Discovery Foundation (ADDF), USA (No. RDAPB-201809-2016615), the Swedish Alzheimer Foundation (Nos. AF-930351, AF-939721, and AF-968270), Hjärnfonden, Sweden (Nos. FO2017-0243 and ALZ2022-0006), the Swedish state under the agreement between the Swedish government and the County Councils, the ALF-agreement (Nos. ALFGBG-715986 and ALFGBG-965240), the European Union Joint Program for Neurodegenerative Disorders (JPND2019-466-236), the National Institute of Health (NIH), USA (Grant No. 1R01AG068398-01), and the Alzheimer's Association 2021 Zenith Award (ZEN-21-848495). T.L. is supported by an Alzheimer's Research UK senior fellowship. Queen Square Brain Bank is supported by the Reta Lila Weston Institute for Neurological Studies.