
Abstract
Background:
Myalgic encephalomyelitis/chronic fatigue syndrome (ME/CFS) is a debilitating disease with unknown pathophysiology. Functional magnetic resonance imaging (fMRI) studies in ME/CFS have reported disparate connectivities for the brain salience (SA) network and default mode network (DMN).
Materials and Methods:
In this study, we acquired resting-state and task fMRI with an advanced scanner for improved subject numbers: 24 healthy controls (HC) and 42 ME/CFS patients, 18 meeting the International Consensus Criteria (ICC) and 24 meeting the Fukuda criteria. We evaluated mean functional connectivity between the SA network and DMN hubs and subcortical regions known to be involved in ME/CFS. We tested the hypothesis that ME/CFS connectivity differed from HC and the ICC and Fukuda classes are distinguished by different connectivities with HC for different pairs of SA network, DMN, or subcortical hubs.
Results:
During resting-state fMRI, only two connections differed from HC, both for Fukuda ME/CFS and both with an SA network hub. During task fMRI, 10 ME/CFS connections differed from HC, 5 for ICC, and 5 for Fukuda. None was common to both classes. Eight of the 10 different connections involved an SA network hub, six of the 10 were weaker in ME/CFS, and 4 were stronger. SA network connections to the hippocampus and brainstem reticular activation system (RAS) differed from and were stronger than HC.
Conclusions:
The SA network mediates the relative activity of the DMN and executive networks and an imbalance will have functional consequences. The RAS and hippocampus modulate cortical activation. Different regulatory connections are consistent with the impaired cognitive performance and sleep–wake cycle of ME/CFS. Different neuropathologies are involved in ICC and Fukuda classes.
Impact statement
Criteria for the diagnosis of the debilitating myalgic encephalitis/chronic fatigue syndrome (ME/CFS) condition have evolved over two decades. Physicians are now instructed that the recent, more stringent (ICC) questionnaire criteria define a disease that is distinct from those remaining subjects defined by the previous Fukuda criteria. This work reports the remarkable finding that functional magnetic resonance imaging connectivity can differentiate between these two classes of ME/CFS. This is the first objective medical evidence that the questionnaire-based diagnosis does indeed differentiate between two different disease states. This facilitates a clearer understanding of ME/CFS and can better direct research and therapy development.
Introduction
Myalgic encephalomyelitis/chronic fatigue syndrome (ME/CFS) is a disease characterized by a range of symptoms, including fatigue, malaise, headaches, disturbed sleep, impaired cognitive function, and muscle pain. ME/CFS can be diagnosed as meeting the Fukuda criteria (Fukuda et al, 1994), the Canadian Consensus Criteria (CCC) (Carruthers et al, 2003), or the International Consensus Criteria (ICC) (Carruthers et al, 2011). The Fukuda criteria require subjects to have clinically evaluated, unexplained, persistent or relapsing fatigue, and concurrently, four or more of eight additional symptoms. Additional autonomic and flu-like symptoms are included in CCC, and in ICC diagnostic criteria were further strengthened by requiring neurocognitive, cardiorespiratory, and thermoregulatory dysfunction. In this study, Fukuda and ICC classes are designated ME/CFSFuk and ME/CFSICC, respectively.
Currently, many studies limit themselves to an ICC (and CCC) criteria cohort with Fukuda criteria subjects being regarded as less scientifically useful. However, it is likely that the two groups represent different diseases and an analysis of a Fukuda cohort is important for a comprehensive understanding of ME/CFS and development of appropriate therapies. Thus, this study aims to demonstrate that the Fukuda and ICC cohort connectivities differ from healthy control (HC) and from each other.
Magnetic resonance imaging (MRI) has been widely used to detect brain abnormality in ME/CFS. A higher percentage of abnormal brain scans in ME/CFS were reported in a qualitative structural MRI analysis (Natelson et al, 1993). Smaller volumes in the bilateral prefrontal cortex were reported (de Lange et al, 2005) and smaller regional gray and white matter volumes were detected in a high-resolution structural 3T cerebral MRI study (Puri et al, 2012). Correlations of T1w and T2w spin-echo MRI with clinical variables (severity, blood pressure, heart rate) revealed abnormal relationships in multiple brainstem nuclei and implied impaired signaling within and from the brainstem (Barnden et al, 2016, 2015). Advanced instrumentation and myelin-sensitive T1 spin-echo MRI simultaneously detected ME/CFS reductions in the brainstem and increases in sensorimotor white matter (Barnden et al, 2018).
These findings of increased myelin in ME/CFS were supported by increases in the ratio of T1-weighted and T2-weighted images in widespread white matter, basal ganglia, and brainstem regions (Thapaliya et al, 2020). Diffusion tensor imaging has detected abnormalities in the brainstem (Thapaliya et al, 2021), but only in the ME/CFSICC subgroup. Hippocampal subvolumes were also increased only in ME/CFSICC (Thapaliya et al, 2022). The implied difference between the ICC and Fukuda subgroups of ME/CFS is explicitly investigated here.
Functional MRI (fMRI) provides neuronal blood flow data. In fMRI, after excitation, a series of several hundred image volumes are acquired. Their voxel values are blood oxygen-level dependent (BOLD). Voxel BOLD values can be averaged over the time-series, or time-series from different brain areas can be tested for correlation. If correlated, “connectivity” is said to exist between the areas. A cognitive task may be performed during fMRI acquisition. Some ME/CFS studies have simply compared the distribution of the average BOLD signal with HC and/or its correlation with symptoms such as postexertional malaise (Cook et al, 2017).
The interaction between the three major networks, the default mode network (DMN), salience (SA) network, and central executive network (CEN), is thought to underlie normal behavior and cognition (Menon, 2011), and so, connectivity within and between them is of interest in ME/CFS. Early connectivity studies have nominated a few hubs from either the DMN or SA network, conducted a voxel-wise estimation of their connectivity to the rest of the brain, and tested for voxel clusters with a significantly different connectivity between ME/CFS and HC. Surveys of basic hub-to-hub connectivity are sparse or absent.
A pilot study (N = 6 ME/CFS and 10 HC) tested voxel-wise connectivity with SA network and DMN hubs and reported increased ME/CFS functional connectivity (FC) between the SA network right anterior insula hub and frontal and subcortical areas (Manca et al, 2021). In contrast, an arterial spin labeling (instead of whole-brain fMRI excitation) study reported decreased connectivity with the SA network right anterior insula hub in ME/CFS (Boissoneault et al, 2016). A larger study (42 ME/CFS and 26 HC) of FC between the 4 DMN hubs reported impaired ME/CFS connectivity for 3 pairs of hubs, but no increased connectivity relative to HC (Shan et al, 2018). A brainstem-optimized analysis of the same cohort within and from the brainstem reticular activation system (RAS) detected impaired FC in ME/CFS between the medulla and midbrain and between the medulla and hippocampus, which correlated with symptom severity (Barnden et al, 2019).
The inability to reproduce FC results in ME/CFS was highlighted by five studies that assessed posterior cingulate cortex (PCC) to anterior cingulate cortex (ACC) connectivity within the SA network. Increased FC was reported in two (Boissoneault et al, 2016; Kim et al, 2015), decreased FC in one (Gay et al, 2016), and no difference in two (Gay et al, 2016; Shan et al, 2018).
In this study, we attempt to advance knowledge of connectivity in ME/CFS. We test for connectivity in the ICC and Fukuda cohorts that differs from HC by specifically assessing connectivity between pairs of nodes listed in Table 1, namely hubs of the SA network and DMN as well as selected subcortical areas.
Twenty-Five Regions of Interest Between Which Connectivity Was Assessed
SA and default mode network hubs were provided in the CONN package. Voxel volume was 0.008 mL.
L, left; PAG, periaqueductal gray; R, right; ROI, region of interest; SA, salience; VTA, ventral tegmental area.
Materials and Methods
Subjects
This study was approved by the Human Research Ethics Committees (HREC/15/QGC/63 and GU:2014/838) of the Griffith University and the Gold Coast University Hospital where data were acquired from 71 subjects including 45 ME/CFS (age 43.4 ± 11.7 years) and 26 age-matched HCs (age 39.8 ± 13.8 years). Participants were recruited and scanned over a 1-year period. Written informed consent was obtained from all individuals.
The ME/CFS patients were classified as meeting ICC (Carruthers et al, 2011) or Fukuda (Fukuda et al, 1994) criteria using a Centres for Disease Control and Prevention-validated questionnaire and reviewed by a clinician experienced in ME/CFS. Three ME/CFS patients were excluded due to conditions including autoimmune disease, microvascular disease, attention-deficit/hyperactivity disorder, or MRI image distortion (Barnden et al, 2019). Among the 42 ME/CFS patients, 24 met Fukuda and 18 met ICC criteria. After excluding HC subjects taking medication other than paracetamol or oral contraceptive, 26 HC subjects were included. Table 2 lists subject demographics.
Subject Demographics and Stroop Task Accuracy and Reaction Time for the Congruent, Incongruent, and Neutral Task Periods for International Consensus Criteria and Fukuda Classes of ME/CFS, and Healthy Control Cohorts
p is statistical inference of the difference between the ME/CFS group versus HC.
ACC, accuracy; _Con, Congruent; HC, healthy control; ICC, International Consensus Criteria; _Inc, Incongruent; ME/CFS, myalgic encephalomyelitis/chronic fatigue syndrome; _Neu, Neutral; RT, reaction time.
MRI acquisition
The fMRI data were acquired sagittally on a 3T MRI scanner (Siemens Skyra) with a 64-channel head-neck coil. For each subject, 1100 volumes of fMRI data were acquired using a multiband echo-planar imaging pulse sequence developed at the University of Minnesota (Auerbach et al, 2013) with 72 slices, multiband factor = 8, TR = 798 ms, TE = 30 ms, flip angle = 40°, acquisition matrix 106 × 106, and voxel size 2 × 2 × 2 mm. During the resting-state fMRI, 1100 volumes were acquired while the subject was awake and viewing a fixed stationary cross. Following resting-state fMRI, 1100 task fMRI volumes were acquired while the subject was responding to a sequence of Stroop color-word tests (Leung et al, 2000). During both fMRI, physiological measures were acquired from a Siemens pulse oximeter and respiratory strap sensors.
An anatomical image was acquired using a T1-weighted magnetization-prepared rapid gradient-echo sequence with 208 slices, TR = 2400 ms, TE = 1.81 ms, flip angle = 8°, acquisition matrix = 224 × 224, and voxel size = 1 × 1 × 1 mm.
The Stroop task experiment
For the task fMRI, the Stroop task was used to investigate the attention and concentration difficulties reported by ME/CFS patients (Leung et al, 2000). Each Stroop task displayed two colored words. The subject was asked to decide whether the color of the upper word agreed with the meaning of the lower word and press one of two buttons on a handpiece to respond “yes” or “no.” The upper word, RED, BLUE, YELLOW, or XXXX, was colored red, blue, or yellow on a black background. The lower word was RED, BLUE, or YELLOW colored white on a black background.
The Stroop task fMRI was divided into four periods/conditions, three between stimulus onset and response, for neutral (upper word is XXXX), incongruent (the upper word is written in a different color from its meaning), or congruent (upper word is written in the color of its meaning). The incongruent task is considered more challenging because of the inhibitory element required to overcome the natural impulse to read the top word rather than inspect its color, and so decide meaning versus meaning of the two words rather than color versus meaning. The fourth condition, rest, was the period between a trial response and the next trial onset. During this “rest” condition, a fixed stationary cross appeared on the screen for a period randomized between 3 and 12 sec.
In each task fMRI, a total of 110 Stroop trials were randomly distributed over the 14.5-min acquisition with an average interstimulus time of 10.5 sec. Forty percent of trials were incongruent, 30% were congruent, and 30% were neutral. For each trial type, the stimulus-onset and response times were recorded. Onset and response times for the four Stroop conditions were input to the connectivity analysis (below) to permit independent evaluation of connectivity during each trial-type period. The time between stimulus and response for each trial was reaction time. For each trial type, mean reaction time and accuracy = correct/total responses were evaluated for each group. Table 2 list reaction times, accuracy, and the statistical inference (p) for ME/CFS differences from HC (computed with SPSS v20).
Regions of interest
A total of 25 regions of interest (ROIs) in Montreal Neurological Institute (MNI) space were assessed (see Table 1), 7 in the SA network, 4 in the DMN, 7 in the RAS nuclei, ventral tegmental area (VTA), and periaqueductal gray matter in the midbrain, 1 in the cerebellum, and bilateral hippocampus and thalamus nuclei. SA network and DMN regions were supplied with the CONN package and are shown in Figure 1. The 14 subcortical regions outside of the SA network and DMN were selected because of their involvement in ME/CFS, reported in an earlier MRI study (Barnden et al, 2016), or rich connections (intralaminar thalamus, hippocampus subiculum) to brainstem RAS nuclei (Edlow et al, 2016, 2012). See Barnden et al (2019) for details of subcortical ROI creation.
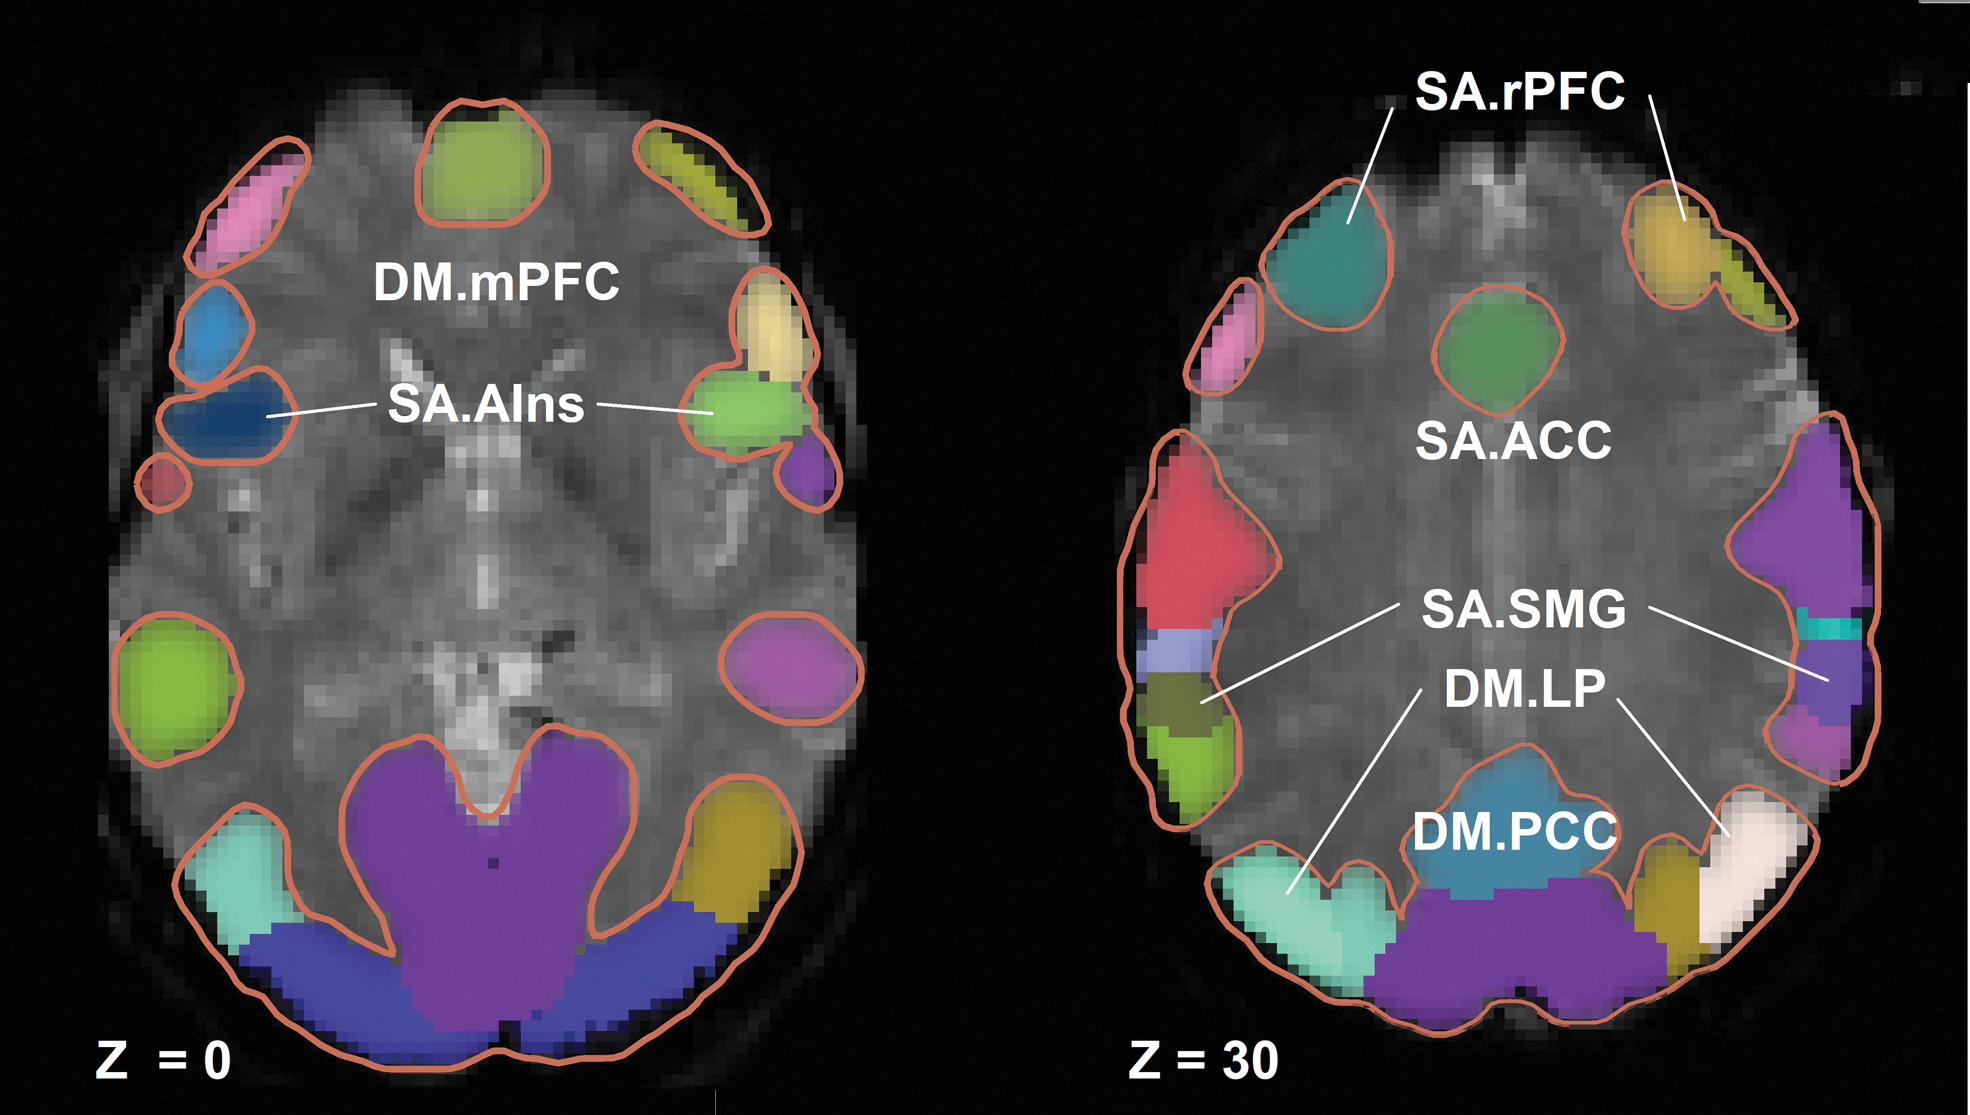
Hubs for all brain networks available in the CONN toolbox shown on fMRI transaxial images. The SA and DM network hubs tested here are labeled. Z denotes the distance (mm) of the transaxial plane above the AC-PC line. AC-PC, anterior commissure-posterior commissure; DM, default mode; fMRI, functional magnetic resonance imaging; SA, salience.
MRI processing
The fMRI data were preprocessed using the default preprocessing pipeline in the CONN toolbox (Nieto-Castanon, 2020; Whitfield-Gabrieli and Nieto-Castanon, 2012) dedicated to connectivity evaluation and comparison. The first 5 of the 1100 volumes were omitted while the magnetic field stabilized. For each subject, motion was measured within the 1095 volume fMRI data set. The average of the motion-corrected volumes was spatially normalized to a template image in MNI space and the deformation applied to all motion-corrected volumes. Time-series were created of the six rigid-body motion parameters and a binary covariate identifying outlier intra-fMRI movements. The amount of sudden intrascan motion could be assessed by counting the number of volumes with “1” in this binary covariate file. See the CONN handbook (Nieto-Castanon, 2020) for details.
Finally, the fMRI volumes were spatially smoothed (6 × 6 × 6 mm). For each subject the anatomical image was segmented into gray/white/cerebrospinal fluid (CSF) partitions, each used to compute time-series for use as covariates.
Physiological noise was measured with pulse oximeter and respiratory strap sensors. The cardiac and respiratory time-series and their interactions, computed using the TAPAS toolbox (Kasper et al, 2017), were used in denoising.
For each subject, for each ROI, BOLD time-series were computed. Denoising of the BOLD time-series incorporated physiological noise, motion parameters, motion outliers, and total white matter and CSF volumes as nuisance covariates. After denoising, a temporal bandpass filter was used to remove frequencies below 0.008 Hz and above 0.15 Hz from the BOLD signal (Sasai et al, 2021).
After denoising and filtering the BOLD time-series, FC between pairs of the 25 regions was computed for each subject (first-level) using CONN's basic ROI-to-ROI correlation approach. BOLD time-series correlations were performed independently for Stroop neutral, congruent, incongruent, and “rest” task conditions through their specified onset and completion times. We processed 42 ME/CFS (24 Fukuda, 18 ICC) and 26 HC. Age and gender were included as covariates in the second-level (group) multivariate analysis.
The CONN toolbox evaluated FC for the entire set of 300 connections between the 25 ROIs. It then performed a multivariate parametric general linear model (GLM) analysis for all correlation values. The GLM model here was
where Yi is the vector of FC values (i = 1 to N subjects), and Xi 1 and Xi 2, are vectors that specify group membership (0 for HC, 1 for ME/CFS class). Xi 3 and Xi 4 are vectors of age and gender values for the N subjects. Yi is FC for class of ME/CFS and HC for different periods of the Stroop task. Solving the GLM equation yields β1, β2, β3, and β4 the relative contribution of group, age, and gender to the observed variation in connectivity Yi ,. ɛ i is the residual variation not explained by group, age, and gender, which has zero mean and variance σ2, used to estimate statistical inference.
This yielded the T statistic for connectivity difference for each ROI pair. It also yielded a false discovery rate (FDR)-corrected p value (Benjamini and Hochberg, 1995) for each ROI pair defined as the expected proportion of false discoveries among all ROI pairs with similar or larger effects across the entire set of FC pairs. A CONN analysis for differences between the mean connectivities of the HC group and each ME/CFS class was performed for all pairs of regions. Each ROI pair with an FDR-corrected p value <0.05 for difference between HC and ME/CFS is reported below for the two ME/CFS classes (ICC and Fukuda).
A single-group (one-sample) analysis for ROI connectivity difference from zero was performed by omitting Xi 2 from the GLM model. The sign of beta (and T) for a selected ROI pair indicated correlation (+) or anticorrelation (−) between their BOLD time-series.
An additional analysis was performed for direct differences between the two classes of ME/CFS by specifying class membership with Xi 1 and Xi 2 (0 for ICC, 1 for Fukuda) in the GLM model.
Results
Table 2 shows the accuracy and reaction times for the three different Stroop task conditions (congruent, incongruent, and neutral). ME/CFS accuracy did not differ from HC for either ME/CFS group for any Stroop condition. Reaction times were longer for the Fukuda group in all Stroop conditions, but only for one condition (neutral) for the ICC group.
Quality control
Movements between sequential volumes in the 1095-volume fMRI data sets exceeded the CONN threshold 2 or more times in 40 of the 76 subjects and 10 or more times in 3 subjects. No subjects were excluded.
Functional connectivity
Significant FC differences between ME/CFS and HC are summarized in Tables 3 and 4 for resting-state and task fMRI, respectively.
Resting-State Functional Magnetic Resonance Imaging
Pairs of ROIs with different ME/CFS connectivities. Two ROI pairs showed a significantly different connectivity between Fukuda ME/CFS and HC (p-FDR <0.05). “T” is the T statistic for group difference. Positive T denotes HC mean connectivity was stronger than for ME/CFS and vice versa.
Task Functional Magnetic Resonance Imaging
Ten pairs of ROIs with mean ME/CFS connectivity different to HC (p-FDR <0.05) for two ME/CFS classes (ICC and Fukuda) for different Stroop task conditions. See Table 1 for ROI abbreviations. Connectivity was weaker in ME/CFS than HC, except for pairs 7 to 10 (negative β and T). The “average” condition connectivity was the average of congruent, incongruent, and neutral Stroop period correlations. “p-FDR” is the statistical inference for the difference between HC and ME/CFS connectivity. “T” is the T statistic from comparison of the HC and ME/CFS groups. “β” is the relative strength of group membership (β1 in General Linear Model) in explaining the observed variation in subject-to-subject connectivity difference.
For both HC and ME/CFS, the pair of blood oxygen-level-dependent time-series were anticorrelated.
ME/CFS correlation stronger than HC (negative β and T).
Resting-state FC
In resting-state fMRI, we detected FC differences between ME/CFSFukuda and HC for two connections. FC was stronger in ME/CFSFukuda between the supramarginal gyrus (
Task FC
For the task fMRI, Table 4 lists 10 ROI pairs with FC that differed from HC in ME/CFS, 5 for ME/CFSFukuda, and 5 for ME/CFSICC. Figure 2 (HC vs. ICC) and Figure 3 (HC vs. Fukuda) locate the ROI pairs with connectivity different to HC on glass brain displays. Eight of 10 abnormal connections involved SA network hubs. There were no abnormal connectivities common to both ME/CFSFukuda and ME/CFSICC. ROIs from all areas (SA network, DMN, RAS, subcortical, and hippocampus) demonstrated FC differences. The anterior insula

Five pairs of ROIs with connectivity that differed between HCs and the ICC class of ME/CFS subjects during task fMRI.

As for Figure 2, but for six pairs of ROIs and the Fukuda class of ME/CFS.
All Stroop task conditions were involved, with the average of congruent, incongruent, and neutral conditions (called “average” here) most frequent. FC was weaker in ME/CFS for 6 ROI pairs, but stronger in 4 (pairs 7–10; Table 4). No intra-SA or intra-DMN connections differed from HC. Each correlation between an SA network hub and a DMN hub in Table 4 (pairs 1, 2, 3) was negative (anticorrelated) for both ME/CFS and HC. Stronger ME/CFS connectivity was detected between SA network hubs and the hippocampus (pairs 7 and 8) and between SA network hubs and RAS nuclei (pairs 9 and 10). Connections of pair 8 were anticorrelated for both HC and Fukuda. Analysis of the pooled ICC and Fukuda ME/CFS groups did not detect further connections different to HC.
An intra-brainstem connection (pair 6) from the medulla (Mdul_R) to the midbrain CnF_L was abnormal. This was the only connection that was abnormal for the more challenging incongruent Stroop task period.
Two subcortical gray matter nuclei showed abnormal connectivity to an SA network hub: one between the left cerebellum culmen (Culm_L) and rostral prefrontal cortex (SA.rPFC_R) for ICC, and one between the VTA and medial prefrontal cortex (DM.mPFC) for Fukuda.
Correlation or anticorrelation between ROI pairs from a one-sample analysis indicated anticorrelation between the SA network and DMN ROIs (pairs 1–3 in Table 4) and for Hippo_L to
A direct ICC versus Fukuda comparison detected a difference in the connectivity between the dorsal Raphe (DoRph) and salience network supramarginal gyrus (
Discussion
The tri-network model proposed by Menon (Menon, 2011) integrates three key intrinsic brain networks—the CEN, SA network, and the DMN, into a single cohesive model underlying normal behavior and cognition. This model predicts that the levels of internally directed cognition of the DMN and externally directed cognition of the CEN are anticorrelated and under the control of the SA network, such that if the brain engages one of the two, the SA network inhibits the activation of the other (Shaw et al, 2021). Such a reciprocal relationship implies that if an SA network to DMN connectivity is different to HC in ME/CFS, then the SA network to CEN connectivity will also differ (with opposite sign).
The CONN toolbox that we utilized permits investigation of extensive networks from first principles with determination of potential network hubs using sophisticated connectivity matrix characterization. While these techniques may ultimately be of value in understanding ME/CFS, here we wished to take a simple first step into the world of network connectivity in ME/CFS by evaluating connectivity between established atlas-based SA network and DMN hubs as well as selected subcortical areas (Table 1).
We directly assessed SA network and DMN hub-to-hub FC in extended high temporal resolution (1100 × 0.798-sec volumes = 14.6 min) resting-state and task fMRI on an advanced scanner with an improved sample size (26 HC and 42 ME/CFS) for separate Fukuda and ICC ME/CFS cohorts. Previous work had mostly conducted “seed-to-voxel” FC analysis, which correlated the BOLD time-series for a network hub (seed) with single-voxel BOLD time-series for all brain voxels. Significant clusters of voxels were then reported, but their ill-defined morphology complicates comparisons across studies. The hub-to-hub approach adopted here is a more standardized and more reproducible method with results interpretable using the rich literature on intrinsic brain networks.
The two ME/CFS groups examined here were defined by the Fukuda (Fukuda et al, 1994) and ICC (Carruthers et al, 2011, 2003). The Fukuda definition is self-reported persistent or relapsing fatigue lasting 6 or more consecutive months not explained by other medical or psychological conditions. Fukuda subjects must also report four or more of the following: impaired memory or concentration, sore throat, tender lymph nodes, muscle pain, multijoint pain, new headaches, unrefreshing sleep, or postexertional malaise during but not before the onset of fatigue. There are major distinguishing symptoms in the ICC definition compared with the Fukuda criteria, namely: the compulsory inclusion of postexertional malaise, neuroimmune exhaustion, neurological impairment (three of neurocognitive, pain, sleep, or neurosensory disturbance), gastrointestinal, genitourinary, and energy production/transport disturbance.
We established that connectivity between SA network and DMN was diminished in ME/CFS for both ME/CFS cohorts. However, several SA network to subcortical nuclei connections were stronger for ME/CFS than HC. A key finding was that connections that were different to HC were distinct for the ICC and Fukuda cohorts for both resting-state and task fMRI. All SA network to DMN connections were anticorrelated.
We confirmed our hypothesis that the ICC and Fukuda ME/CFS cohorts are quite distinct in terms of their altered connectivities relative to HC. No different connection was common to both. This segregation suggests that the FC and symptom differences in ICC and Fukuda subjects result from different abnormalities. The anticorrelation of the three abnormal SA network to DMN connections in Table 4 is consistent with the inhibition of DMN activity by increased SA network activity.
In the ICC cohort during task fMRI, it was notable that four of the five connections that differed from HC involved subcortical nodes, three with RAS nuclei and one with the cerebellum. Two of these RAS connections (SA with Mdul_L and DoRph) were stronger than HC. This suggests that the more severe symptoms of the ICC class may stem from the impaired connection between the important
For ICC, the RAS connection between the rostral medulla and midbrain was weaker than HC (pair 6). This was the only different connection that was associated with the demanding Stroop task incongruent condition. This connection was also reported as weaker than HC in the brainstem-optimized FC analysis of the pooled ME/CFS cohorts (Barnden et al, 2019). This circuit plays a key role in the integration of multiple cortical, RAS, and sensory responses (Fisher et al, 2021; Garcia-Rill et al, 2016) and its impairment may also contribute to the more severe ICC symptoms.
Three hippocampal connections (pairs 7, 8, 9) were stronger in ME/CFS than HC. This suggests that the hippocampus may have a compensatory role in ME/CFS stimulated by a weakened SA network to DMN connectivity. The same may apply to the stronger DoRph connection (pair 10).
The insula plays a key role in attention systems (Eckert et al, 2009), sleep and wakefulness (Levichkina et al, 2020), and was specifically associated with function impairment in adolescent ME/CFS (Wortinger et al, 2017, 2016). It is also involved in several neurological conditions (Colivicchi et al, 2004; King et al, 2009; Ostrowsky et al, 2000).
A cerebellum culmen with SA.rPFC (pair 4) connection also differed from HC. The culmen is known to be involved in cognitive as well as motor processing (Lange et al, 2015; Schmahmann, 2013).
The fundamental mechanism behind these altered connectivities, or whether one is a primary driver of the others, cannot be deduced from a cross-sectional study. Differences in myelination (Barnden et al, 2018) or axonal diffusivity (Thapaliya et al, 2021) may contribute, or more fundamentally, differences in cellular calcium transport (Cabanas et al, 2019) or neuroinflammation (Nakatomi et al, 2014) may be relevant.
Stroop task conditions
The simpler Stroop task conditions (rest, neutral, or Congr) revealed nine connections that differed from HC, but the more demanding incongruent (Incongr) task only 1. It is possible that the demanding incongruent task yields a higher intersubject variance in FC for ME/CFS and/or HC thereby reducing the statistical sensitivity for detection of differences. The “average” condition utilized three of the four Stroop periods to increase its sampling period and statistical power, and yielded more connections that differed from HC.
Limitations
Although we analyzed scans from an advanced scanner and used reliable processing, the sample size was only moderate, particularly when ME/CFS was subdivided into two classes and when four subperiods of the Stroop task were assessed. These results do, however, yield novel results that inform future research directions. Correlation with clinical severity measures of connectivities that differ from HC would likely provide further insights. Explicit inclusion of CEN hubs may further enrich our knowledge of impaired ME/CFS connections. Although the connectivity measures here cannot diagnose ME/CFS in single subjects, the much enhanced signal to noise ratio of 7T fMRI (Colizoli et al, 2020), particularly in the brainstem, may bring this prospect closer.
Conclusion
ME/CFS FC was significantly different to HC for connections between the SA network, DMN, RAS, hippocampus, and midbrain regions. The Fukuda and ICC classes of ME/CFS were associated with different connections that differed from HC. Therefore, the Fukuda and ICC classes of ME/CFS derive from different mechanisms and can be regarded as distinct diseases. SA network connections that differed from HC dominated. During task fMRI, FC was weaker in ME/CFS than HC for three SA network hub to DMN hub connections. Stronger SA network connections between the hippocampus and two RAS nuclei may signal a compensatory response. Connections that differed from HC involved three regulatory areas: the SA network, RAS, and hippocampus, consistent with the impaired cortical arousal, attention to task, memory and cognitive performance, and sleep–wake cycle associated with ME/CFS.
Footnotes
Acknowledgments
We thank Zack Shan, Kevin Finegan, and Sandeep Bhuta for their contribution to data collection and the patients and healthy controls who donated their time and effort to participate in this study.
Authors' Contributions
J.S.: Methodology, formal analysis, and writing—original draft. K.T.: Writing—review and editing and supervision. N.E.-F.: Resources. S.M.-G.: Supervision and project administration. L.B.: Conceptualization, methodology, writing—review and editing, and funding acquisition.
Author Disclosure Statement
No competing financial interests exist.
Funding Information
ME Research UK (charity no. SC036942) funded Dr. Su. This study was also supported by the Stafford Fox Medical Research Foundation (award no. 216285), the Judith Jane Mason Foundation (award no. MAS2015F024), Mr. Douglas Stutt (award no. 220633), the Blake-Beckett Foundation, Ian and Talei Stewart (award no. 220633), Buxton Foundation, and McCusker Charitable Foundation (award no. 220485).