
Abstract
Background:
In older people with mild cognitive impairment (MCI), the relationship between early changes in functional connectivity and in vivo changes in key neurometabolites is not known. Two established correlates of MCI diagnosis are decreased N-acetylaspartate (NAA) in the hippocampus, indicative of decreased neuronal integrity, and changes in the default mode network (DMN) functional network. If and how these measures interrelate is yet to be established, and such understanding may provide insight into the processes underpinning observed cognitive decline.
Objectives:
To determine the relationship between NAA levels in the left hippocampus and functional connectivity within the DMN in an aging cohort.
Methods:
In a sample of 51 participants with MCI and 30 controls, hippocampal NAA was determined using magnetic resonance spectroscopy, and DMN connectivity was quantified using resting-state functional MRI. The association between hippocampal NAA and the DMN functional connectivity was tested within the MCI group and separately within the control group.
Results:
In the DMN, we showed a significant inverse association between functional connectivity and hippocampal NAA in 20 specific brain connections for patients with MCI. This was despite no evidence of any associations in the healthy control group or group differences in either of these measures alone.
Conclusions:
This study suggests that decreased neuronal integrity in the hippocampus is associated with functional change within the DMN for those with MCI, in contrast to healthy older adults. These results highlight the potential of multimodal investigations to better understand the processes associated with cognitive decline.
Impact statement
This study measured activity within the default mode network (DMN) and quantified N-acetylaspartate (NAA), a measure of neuronal integrity, within the hippocampus in participants with mild cognitive impairment (MCI) and healthy controls. In participants with MCI, NAA levels were inversely associated with connectivity between specific regions of the DMN, a relationship not evident in healthy controls. This association was present even in the absence of group differences in DMN connectivity or NAA levels. This research illustrates the possibility of using multiple magnetic resonance modalities for more sensitive measures of early cognitive decline to identify and intervene earlier.
Introduction
Older people with mild cognitive impairment (MCI) are recognized to be at greater risk of developing dementia, with around 45% converting to dementia over a 5-year period (Gauthier et al, 2006). MCI is characterized by objective evidence of neuropsychological dysfunction, which is greater than that expected as part of the normal aging process, with still generally intact daily functioning. MCI can be reflective of early dementia stages (including both Alzheimer's disease and non-Alzheimer's dementia), although it can also be a result of other pathologies such as cerebrovascular disease and depression (Gauthier et al, 2006). MCI is therefore considered an important “at-risk” stage preceding dementia in many cases, although it is important to note that some patients with MCI may remain stable or may revert to prior levels of functioning (estimates varying from 14.4% to 55.6%; Petersen et al, 2018). The MCI stage is therefore a critical window for early or secondary prevention of dementia and so greater understanding of critical brain changes underpinning MCI is warranted, both from a scientific and clinical perspective.
Behaviorally, MCI has been categorized into two distinct subtypes. In amnestic MCI (MCI-A), memory impairments are the primary neurocognitive feature and individuals with this MCI subtype are more likely to progress to Alzheimer's disease (Petersen et al, 2001). Nonamnestic MCI (MCI-NA) is characterized by impairments in nonmemory domains such as processing speed, language, or executive functions, and may more commonly reflect non-Alzheimer's pathology (e.g., vascular or Lewy Body dementia, late-life depression; Gauthier et al, 2006; Naismith et al, 2012). Investigation into these subtypes provides valuable insight into risk and protective factors influencing progression to dementia syndromes.
There remains relatively little embryonic understanding of dynamic neurodegenerative changes, and limited work to-date has focused on how changes in functional brain connectivity relate to brain metabolites in this key at-risk phase. For Alzheimer's disease, there have been significant advances of biomarkers, for example, amyloid deposition in MCI (Jack et al, 2010). This has been developed into the National Institute on Aging ATN framework (Jack et al, 2018) describing biomarkers under beta amyloid deposition, pathologic tau, and neurodegeneration. While these characterizations provide subtype profiles, recent study illustrated that a substantial proportion of individuals with high biomarker load do not show an observable dementia syndrome (Burke et al, 2021). Therefore, there is an unmet need in identifying individuals likely to experience dementia, and it is proposed that using multiple magnetic resonance (MR) modalities concurrently can provide unique insight into the deterioration of harmonized brain systems underpinning this at-risk state.
There have been numerous studies investigating the neurobiological changes observed in MCI using MR. In particular, MCI is associated with changes in functional connectivity within the default mode network (DMN; Badhwar et al, 2017; Bai et al, 2011; Dennis and Thompson, 2014; Eyler et al, 2019; Jin et al, 2012). The DMN is a network which shows greater connectivity at rest (Esposito et al, 2006; Fransson, 2006; Gusnard et al, 2001; McKiernan et al, 2003; Raichle et al, 2001; Uddin et al, 2009), and is associated with processes relating to memory (Greicius and Menon, 2004; Miall and Robertson, 2006) and social cognition (Iacoboni et al, 2004; Uddin et al 2007; Uddin et al, 2005). The changes seen in the DMN network in MCI appear to occur concurrently with changes in episodic memory (Dunn et al, 2014). Notably, connectivity changes within the DMN are not necessarily linear in aging and neurodegeneration. Rather, there is evidence of both hyper- and hypoconnectivity within the DMN in those experiencing MCI and Alzheimer's disease (Bai et al, 2011; Damoiseaux et al, 2012). Degeneration of structural and functional connectivity within the DMN has been consistently observed in AD (Binnewijzend et al, 2012; Dai et al, 2019; Greicius et al, 2004; Reid and Evans, 2013; Zhou et al, 2022).
Disentangling these changes from typical aging processes is a challenge, especially as connectivity change within the DMN precedes observable amyloid accumulation (Jones et al, 2016). It is hypothesized that changes in the DMN may be indicative of cognitive decline, however, as a standalone measure it is not sufficiently sensitive to identify individual risk. One avenue of investigation is combining DMN connectivity with other MR modalities, which may be more sensitive and may be able to be used as a biomarker.
Change in brain chemistry through the measure of metabolites, such as N-acetylaspartate (NAA), is another avenue for investigating the biological underpinning of cognitive decline. NAA is a metabolite thought to reflect neuronal health and can be measured through magnetic resonance spectroscopy (MRS; Moffett et al, 2007; Rae, 2014). For individuals with MCI, consistent reductions in NAA within the hippocampus and posterior cingulate have been found (Tumati et al, 2013). This aligns with the established hippocampal atrophy correlate of MCI and Alzheimer's disease. This is limited in specificity, however, as hippocampal atrophy is present in healthy aging, although it is greater in individuals evidencing cognitive impairment (Armstrong et al, 2019), there are a number of other causes of hippocampal volumetric decline (Schroder and Pantel, 2016). While NAA levels have been shown to associate with clinical change (Kantarci et al, 2007) and aging (Cleeland et al, 2019), disentangling pathological processes to general aging processes is a challenge.
Combining NAA measures with functional networks may offer a more sensitive measure of cognitive decline. For example, it remains unclear whether the observed decrease in hippocampal neuronal integrity is associated with concurrent changes in DMN connectivity, or whether these observed changes are distinct.
To the best of our knowledge, no studies have examined the inter-relationships between neurochemistry in the hippocampus, a key medial temporal brain structure, and network functioning using MR. To address this gap, this study investigated the association between NAA levels within the hippocampus, as a sensitive proxy of hippocampal neuronal health, and functional connectivity within the DMN in participants with MCI. We were specifically interested in connectivity between regions of the DMN to investigate effects within a highly relevant network for this disorder. As there is evidence of both hypo- and hyper-connectivity in the DMN, this study did not have a priori hypotheses regarding the directionality of association between NAA levels and DMN connectivity. Additionally, given the distinct trajectories of MCI-A and MCI-NA, a secondary aim was to assess for any differences between these two diagnostic categories in DMN connectivity and NAA levels.
Methods
Participants
The data included in this study were collected from the Healthy Brain Aging Clinic at the Brain and Mind Center, University of Sydney, Australia, and included participants who had completed hippocampal MRS and resting-state functional MRI (rsfMRI) sequences as part of their clinical research assessment. The Healthy Brain Aging Clinic is a specialized early diagnosis and intervention research clinic for older adults with new-onset (i.e., within the last 5 years) subjective mood and/or cognitive complaints. This study included participants diagnosed with MCI following assessment in the clinic (diagnostic details provided below), as well as healthy control participants with no subjective or objective cognitive decline. Exclusion criteria included age younger than 50 years at the time of testing, an established diagnosis of dementia, history of neurological disease (e.g., epilepsy) or nonaffective psychiatric illness (e.g., psychosis), previous head injury (involving loss of consciousness >30 min), or other medical conditions known to affect cognition (e.g., cancer, stroke).
Additionally, MRI contraindications were also part of the exclusion in the current study. Ethics approval was obtained from the University of Sydney Human Research Ethics Committee and all participants provided written informed consent before participation.
Clinical and neuropsychological assessment
As previously detailed (Duffy et al, 2014), participants underwent a comprehensive neuropsychological, mood and medical assessment. A standardized battery of tests, chosen for their sensitivity to cognitive changes evident in MCI and dementia, was administered by a clinical neuropsychologist. Cognitive composite scores were calculated for several domains from a combination of neuropsychological tests, using age- and (where available) education-adjusted normative data, as follows:
Verbal learning
The average of Logical Memory I subtest from the Wechsler Memory Scale, third edition (Wechsler, 1997b) and sum of learning trials 1–5 from the Rey Auditory Verbal Learning Test (Lezak, 1995).
Verbal memory
The average of Logical Memory II subtest from the Wechsler Memory Scale, third edition (Wechsler, 1997b) and delayed recall (trial 7) from the Rey Auditory Verbal Learning Test (Lezak, 1995).
Language
The average of animal naming total score (Tombaugh et al, 1999) and Boston Naming Test total score (Kaplan et al, 1983).
Executive functioning
An average of Digit Span total score subtest from the Wechsler Adult Intelligence Scale, third edition (Wechsler, 1997a) for working memory, Trailmaking Test part B total time (Reitan, 1979) for cognitive flexibility, and word generativity total score using the letters F, A, and S (Strauss et al, 2006) for phonemic fluency, plus the average of conditions 3 and 4 from the Color Word Interference subtest of the Delis–Kaplan Executive Function System (Delis et al, 2001) for response inhibition and set shifting.
Additionally, a vascular risk score was calculated as a score out of 5, comprising one point each for a history of heart disease, high blood pressure, high cholesterol, diabetes, and smoking.
MCI was defined based on Winblad's criteria (Winblad et al, 2004). This requires evidence of at least a 1.5 standard deviation decline, relative to age- and (where available) education-adjusted normative data, on at least one objective neuropsychological test. All MCI diagnoses were consensus rated by two clinical neuropsychologists and a medical specialist (geriatrician and/or neurologist). The presence of a depressive history was assessed using the Mini Neuropsychiatric Interview (Sheehan et al, 1998), version 6, or the Structured Clinical Interview for DSM-IV-TR (First et al, 2002).
MRI acquisition
Imaging was conducted within 4 weeks of clinical assessment and took place on a 3-Tesla GE Discovery 750 scanner (GE Medical Systems, Milwaukee, WI) using an eight-channel phased-array head coil. The acquisition included a T1-weighted anatomical image, a left hippocampal Point-RESolved Spectroscopy sequence (PRESS) and a rsfMRI acquisition. The T1 sequence acquired 196 sagittal slices (7.2 ms repetition time; 2.8 ms echo time; 10° flip angle; 256 × 256 matrix; 0.9 mm isotropic voxels), and was used for the placement of the PRESS sequence, as well as processing of both the PRESS and rsfMRI time series.
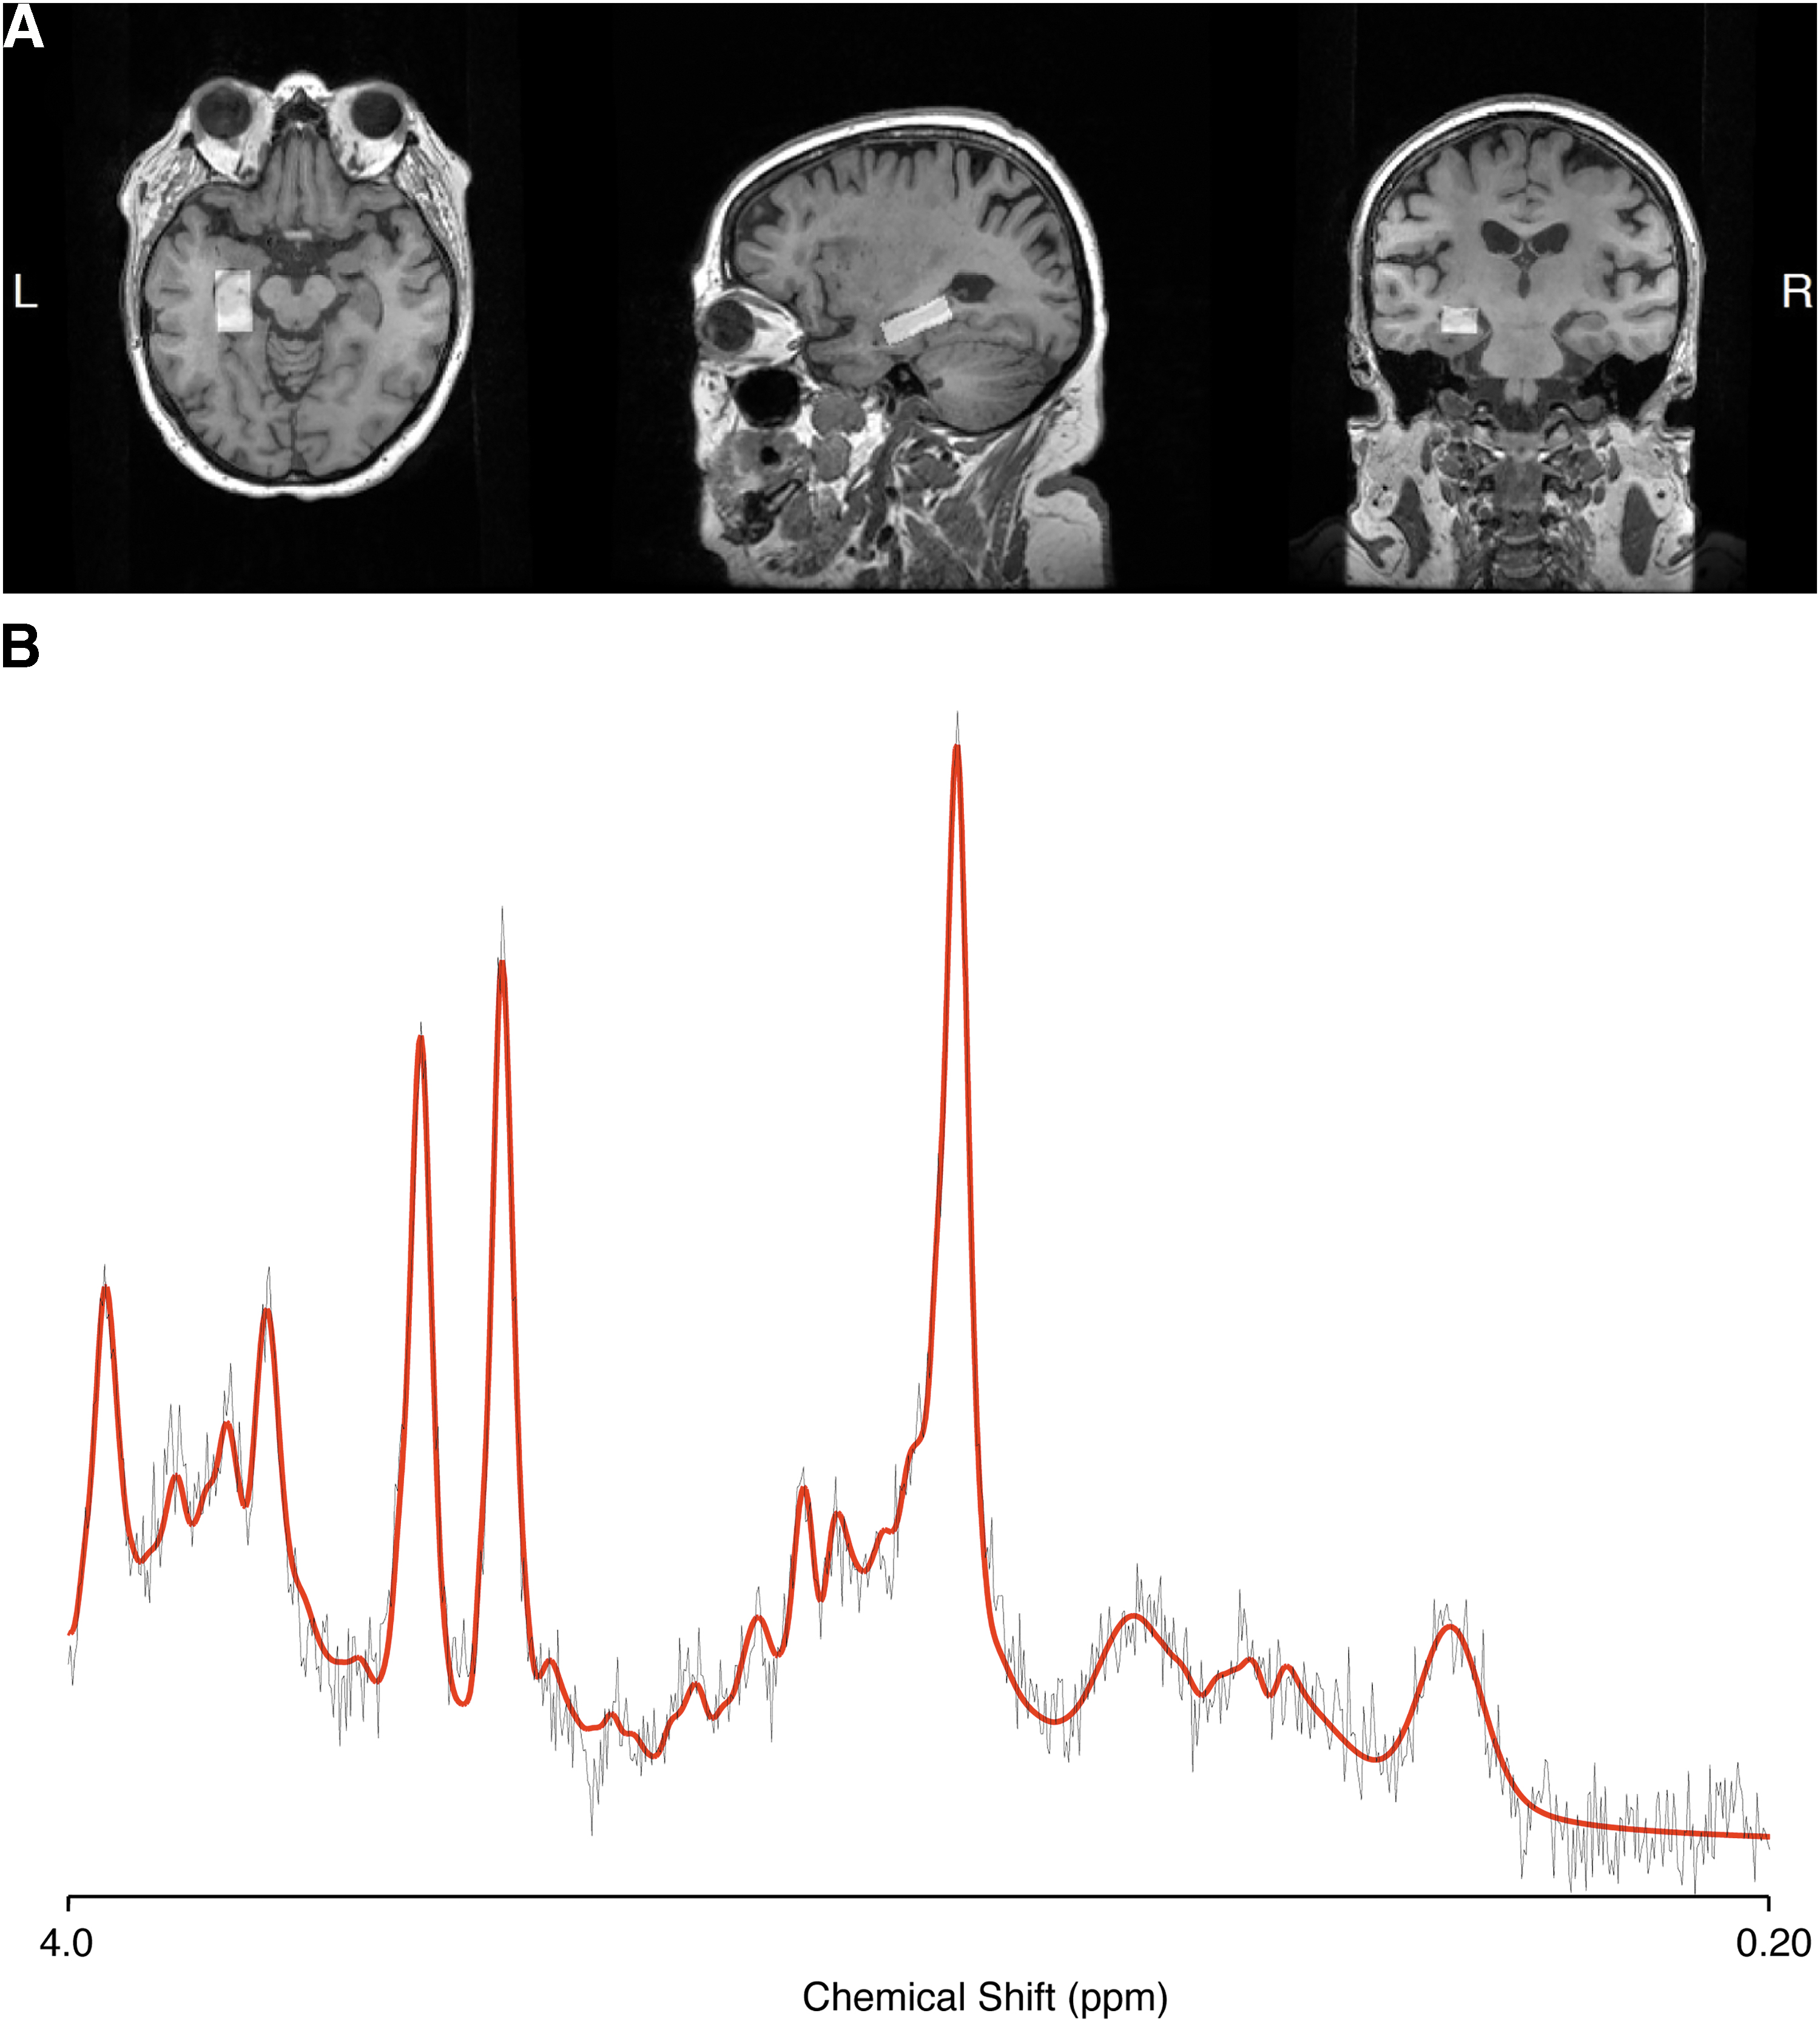
The single voxel PRESS acquisition was placed on the left hippocampus, with a voxel size of 10 × 15 × 30 mm, 2000 ms repetition time; 35 ms echo time; and 128 averages with two chemical shift-selective imaging pulses for water suppression. As a bilateral acquisition was not feasible, the choice of left hippocampus was informed by its early volumetric decline (Shi et al, 2009) and the association of left hippocampal NAA to memory dysfunction, more so than the right side (Watanabe et al, 2012). An example of the hippocampal voxel placement is shown in Figure 1A. The PRESS volume was shimmed to achieve full width at half maximum (FWHM) of <13 Hz.
The fMRI data were acquired with 3,000 ms repetition time, 36 ms echo time, 90° flip angle, 39 axial slices covering the whole brain, 220 mm field of view, 0.4 mm interslice gap, and voxel size = 3.4 × 3.4 × 3 mm3 (matrix: 64 × 64; total scan time: 6.5 min).
MRS processing
To ascertain NAA levels within the left hippocampus, MRS data were processed using LCModel (Provencher, 2001). Data quality and spectral fit were assessed by two independent raters (M.M.D. and S.D.). An example of processed spectra is provided in Figure 1B.
The CoRegStandAlone feature from Gannet (Version 3.0.1; Harris et al, 2015) was used to coregister the MRS voxel to the T1 anatomical, segment the anatomical image into white matter, gray matter, and cerebrospinal fluid (using spm12; Ashburner and Friston, 2005) and generate the tissue fraction estimates within the hippocampal voxel. These values were used to correct NAA levels to molar values (Gasparovic et al, 2018, Gasparovic et al, 2006; Near et al, 2021).
rsfMRI processing
Results included in this article come from preprocessing performed using fMRIPrep 20.2.0rc1 (Esteban et al, 2019), including skull stripping, slice timing correction, motion correction, automatic removal of motion artefacts using Independent Component Analysis based strategy for Automatic Removal of Motion Artifacts (including a FWHM = 6 mm spatial smoothing, Pruim et al, 2015), and spatial normalization to MNI152NLin6Asym. Full details of the fmriprep pipeline are provided in the Supplementary Data. The first 20 acquisitions were discarded to avoid instability in the signal. Following preprocessing, in-house code was used to apply the bandpass filter of 0.01 to 0.08 Hz, using the MATLAB bandpass function, and extract the signal from the Brainnetome Atlas, using its 36 region definition of the DMN network (Fan et al, 2016), listed in Table 1. To represent regional fMRI activity within the DMN regions, fMRI signals within each brain region were extracted. Regional signal was used to build connectivity matrices of the DMN, using Pearson's correlation between regional signals, creating a 36 × 36 matrix of correlation coefficients for each individual.
Brainnetome Definition of the Default Mode Network, with the Short Names and the Full Names
Bold, italicized, indicates a node that was connected by a significant edge.
Hippocampal quantification
The Freesurfer segmentation protocol (Fischl, 2012), run as part of the fMRIprep pipeline, was used to quantify left hippocampal volume. The default segmentation from the Desikan–Killiany atlas (Desikan et al, 2006) was used to ascertain left hippocampal volume and total intracranial volume. The left hippocampal volume was calculated as a proportion of total intracranial volume (i.e., left hippocampus/total intracranial volume × 100).
Statistical analyses: NAA–DMN association
All analysis was conducted within MATLAB, using the false discovery rate (FDR) function from the NBS Toolbox (Zalesky et al, 2010) to control for multiple comparisons. A general linear model was used to identify connections within the DMN associated with NAA levels, within the MCI group and the control group separately, with the FDR method used to control for errors caused by multiple comparisons. In the primary analysis, age, sex, and hippocampal volume were used as covariates. Additionally, a model was run with hippocampal volume as a predictor, with NAA, age and sex as covariates, to ascertain the effect of hippocampal volume. Using the t-test function of MATLAB, independent samples t-tests were conducted to compare NAA levels and average DMN connectivity between the groups.
For each edge in the DMN identified to be associated with NAA in the FDR analysis, MATLAB was used to calculate “corrected functional connectivity score,” regressing out the effects of age and sex. These corrected functional connectivity scores were used to compare connectivity of each edge between patients with MCI-A and MCI-NA and separately, between patients with and without a depressive history.
To investigate the association between connectivity and continuous variables, an average connectivity score was created using the corrected scores. This average connectivity was correlated with measures of cognitive performance and vascular risk, to examine associations between these measures and NAA–DMN connectivity.
Results
Demographics and clinical characteristics
There were 81 participants included in the final sample. Demographic details of participants are included in Table 2.
Demographic Details of Included Sample
Data shown as mean values with standard deviations in brackets.
DMN, default mode network; MCI, mild cognitive impairment; NAA, N-acetylaspartate.
NAA levels and DMN connectivity
There were no differences between groups in average DMN connectivity or NAA levels (Table 2). When investigating the association between DMN connectivity and NAA levels within the MCI group, using an F-test and an FDR correction, there were 20 connections in the DMN that were significantly associated with NAA levels (Figs. 2 and 3), while controlling for age, sex, and hippocampal volume. These connections showed increased connectivity with decreased NAA levels, that is, an inverse relationship. In contrast, the equivalent analysis within the control group identified no connections with an association between NAA levels and DMN connectivity. In both groups (MCI and control), investigations of the effect of left hippocampal volume, while controlling for NAA, age, and sex, showed no effect of volume on DMN connectivity.
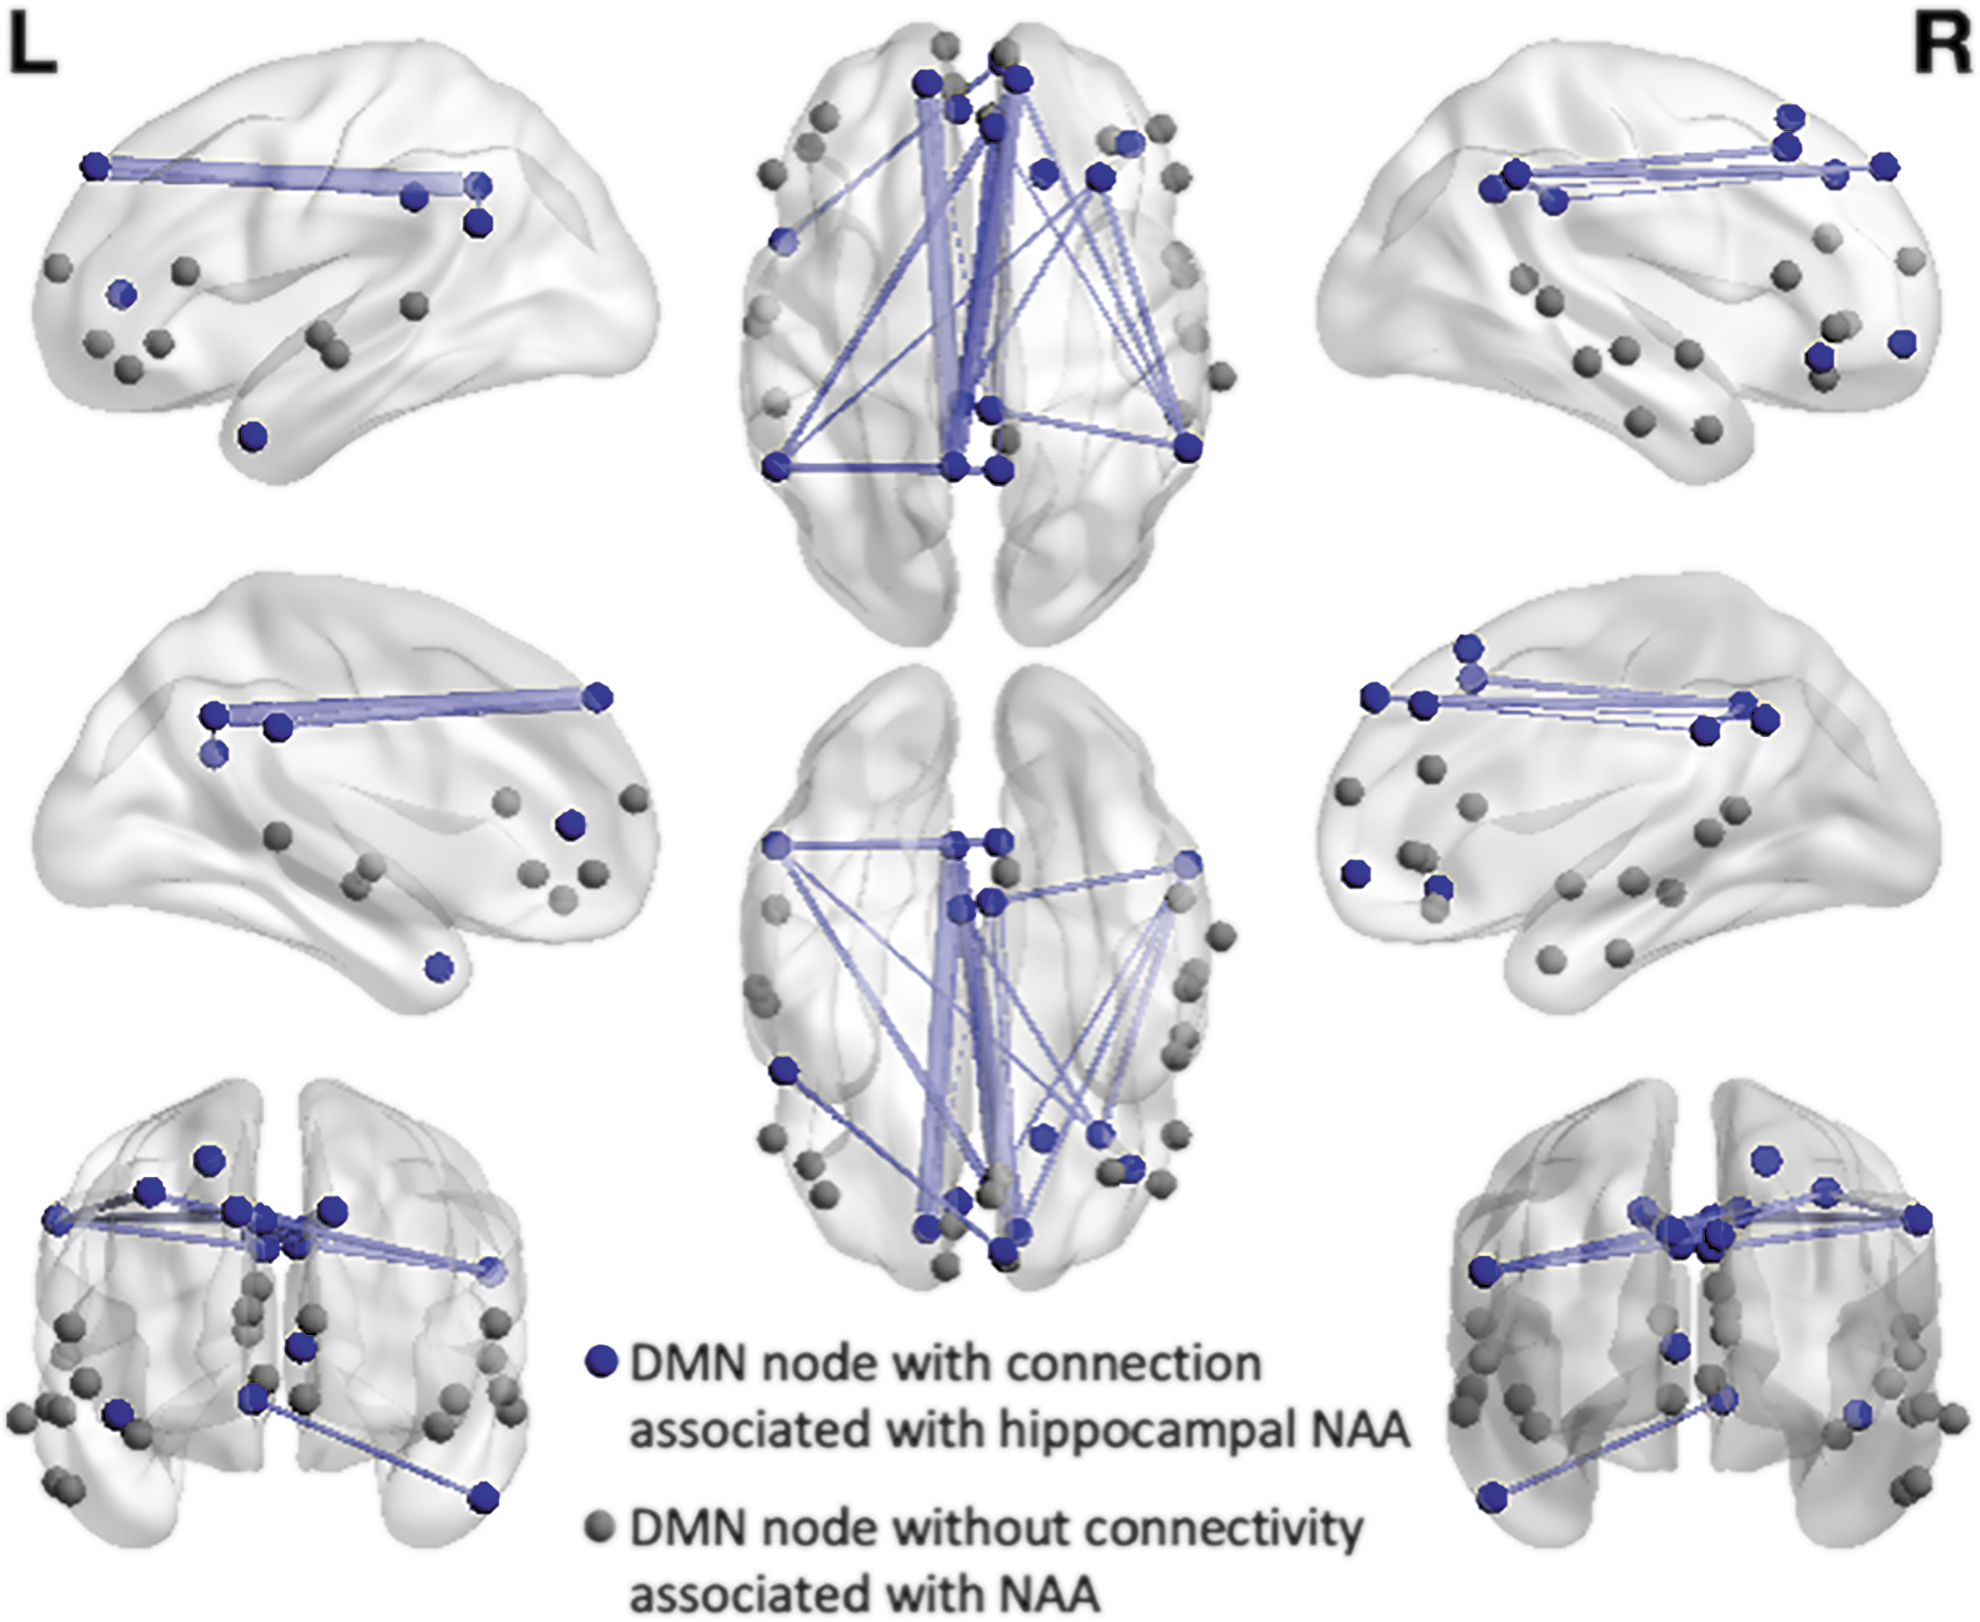
Illustration of the edges within the DMN associated with NAA levels in the hippocampus in MCI. Nodes which had significant edges associated with NAA levels are shown in blue, with the other nodes of DMN network shown in gray. The thickness of the line indicates the strength of connectivity within the edge. DMN, default mode network; MCI, mild cognitive impairment; NAA, N-acetylaspartate.
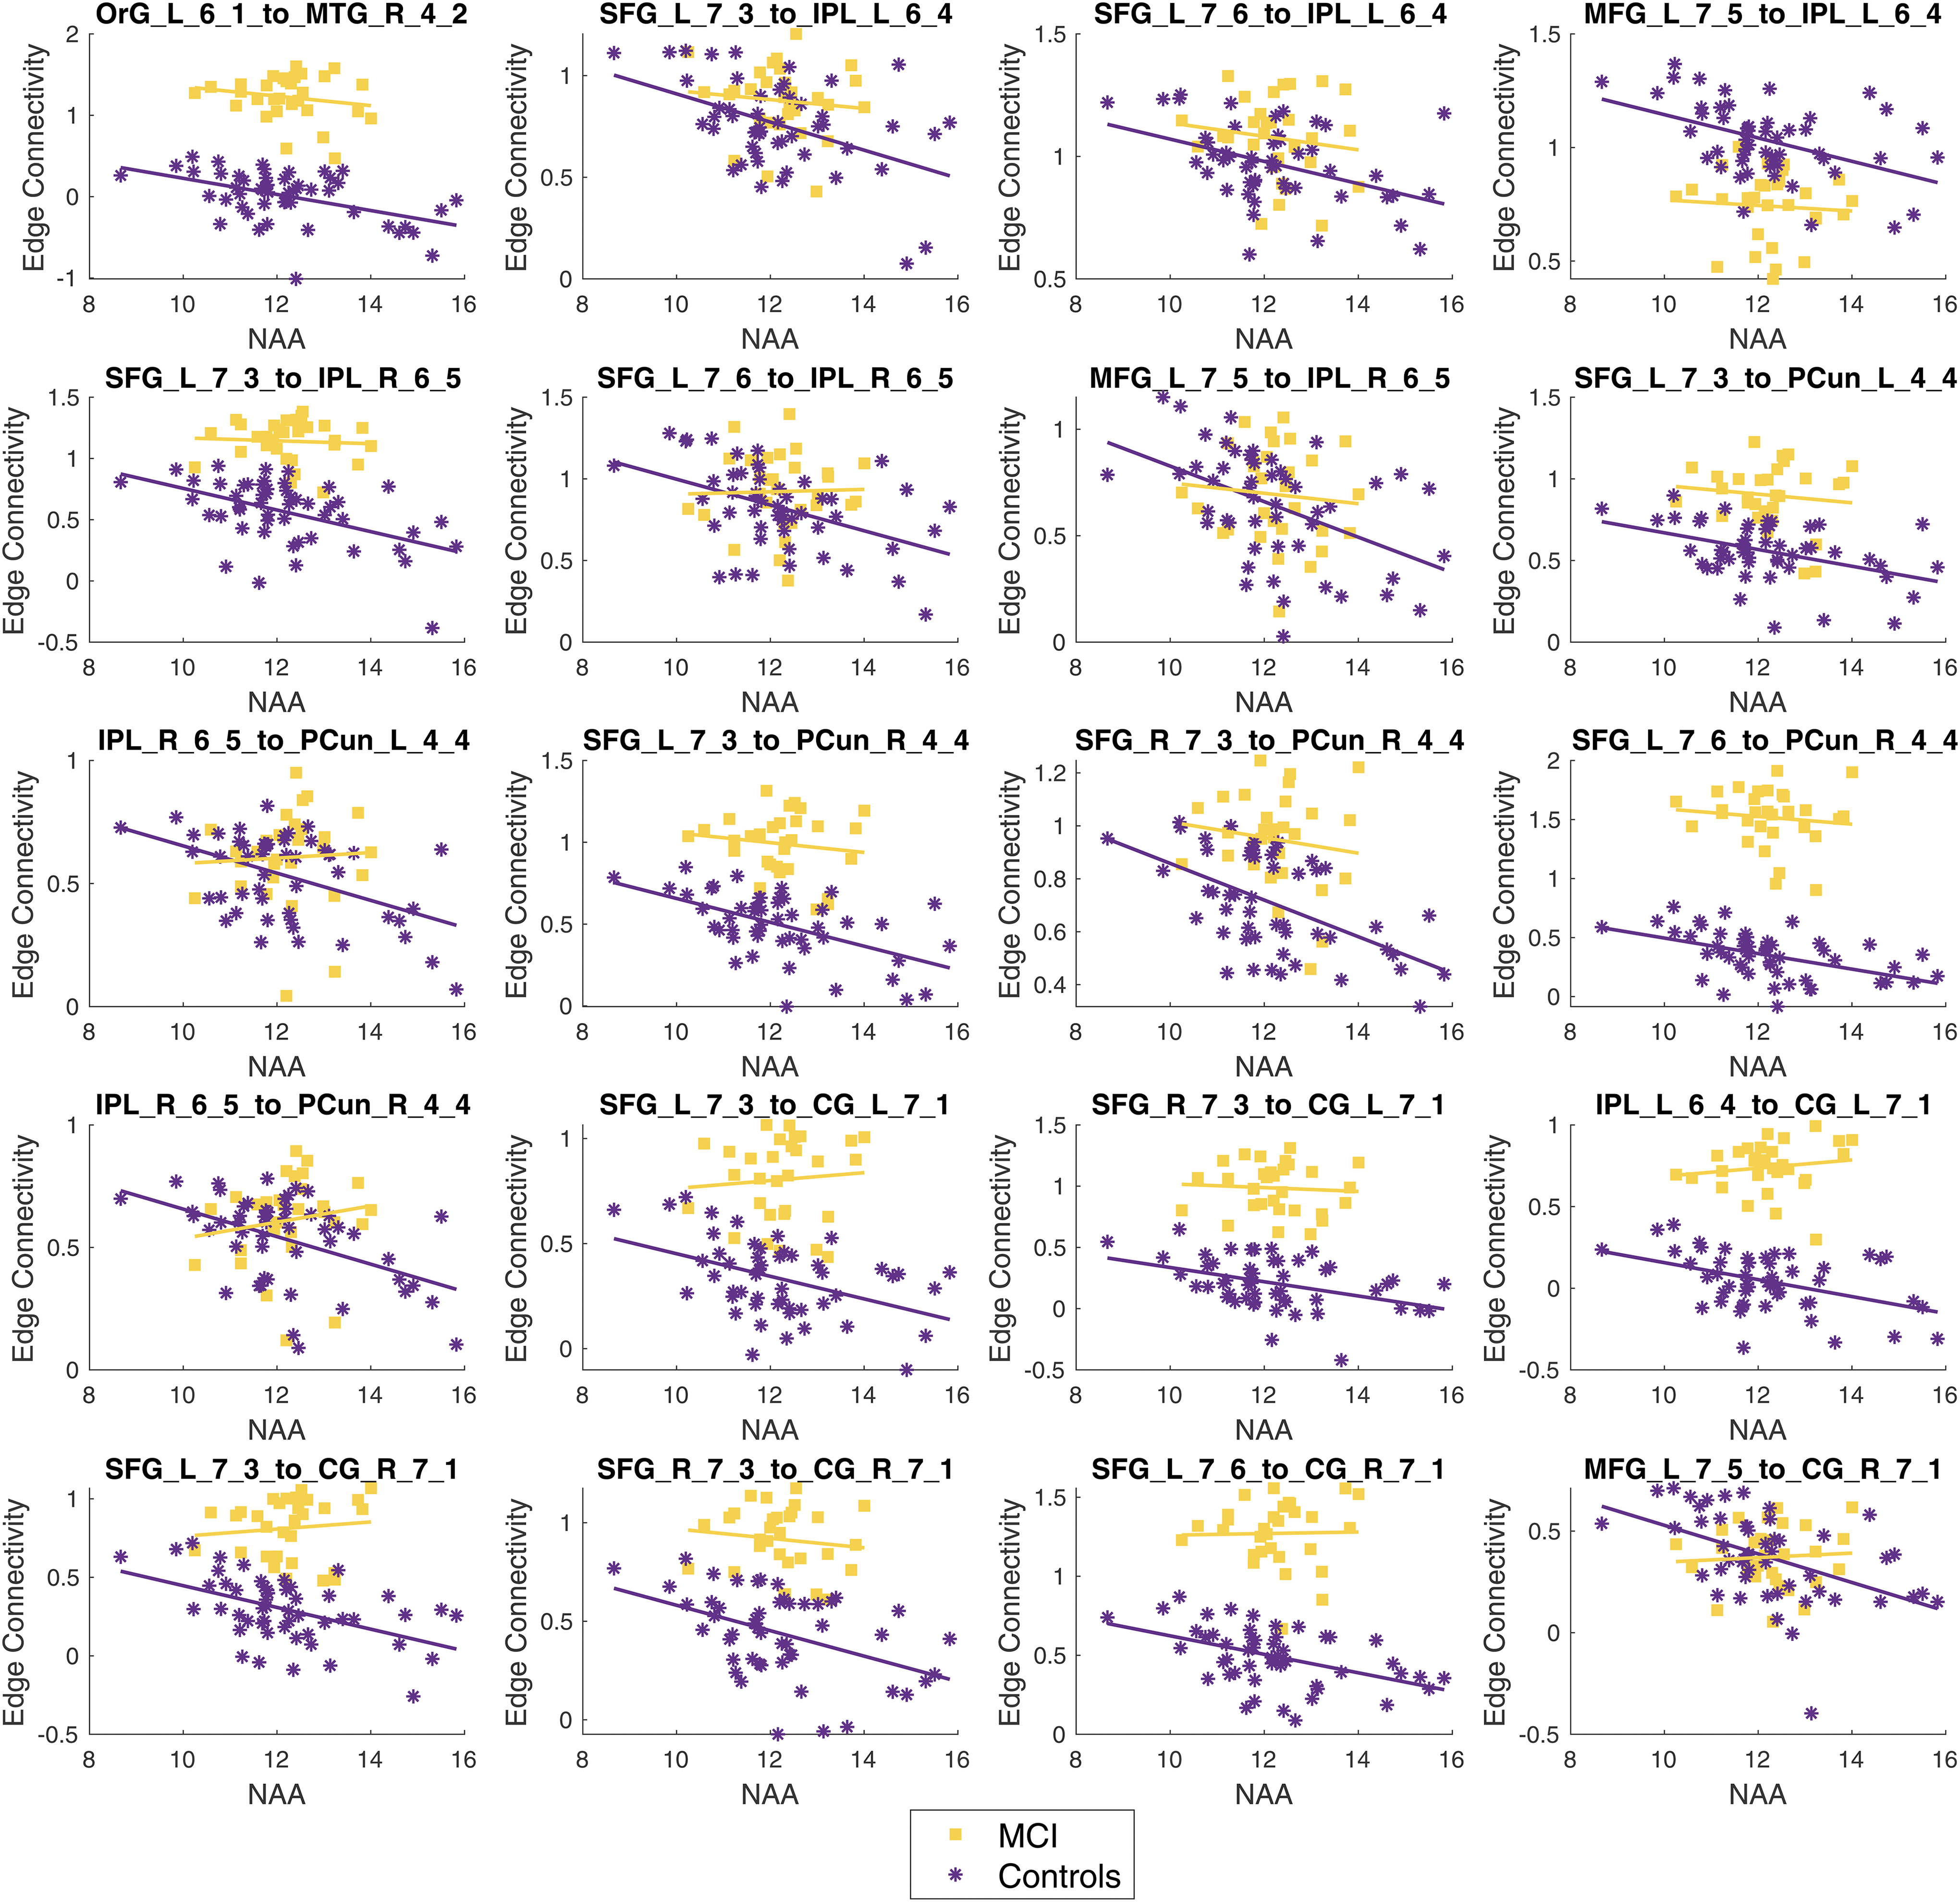
Graphs showing each edge significantly associated with NAA levels in the MCI participants. The MCI participant data are shown in purple asterisks and the controls are shown in yellow squares. The labels for each region are defined in Table 1.
Effect of MCI subtype
For each significant edge from the FDR analysis above, a linear model was run on the corrected connectivity, assessing the effect of NAA levels and the interaction between NAA levels and MCI subtype (MCI-A vs. MCI-NA). ANOVA was used to assess the significance of model predictors, with NAA levels being significant predictors in all edges identified by FDR and a significant interaction between group and NAA in only one edge [F(1, 48) = 4.07, p = 0.049]. The significant group interaction was found in an interhemispheric connection between the left medial frontal gyrus and right inferior parietal lobe, and is shown in Figure 4, along with the model fit parameters and an illustration of the connection. For completeness, plots of all edges are included in the Supplementary Data.
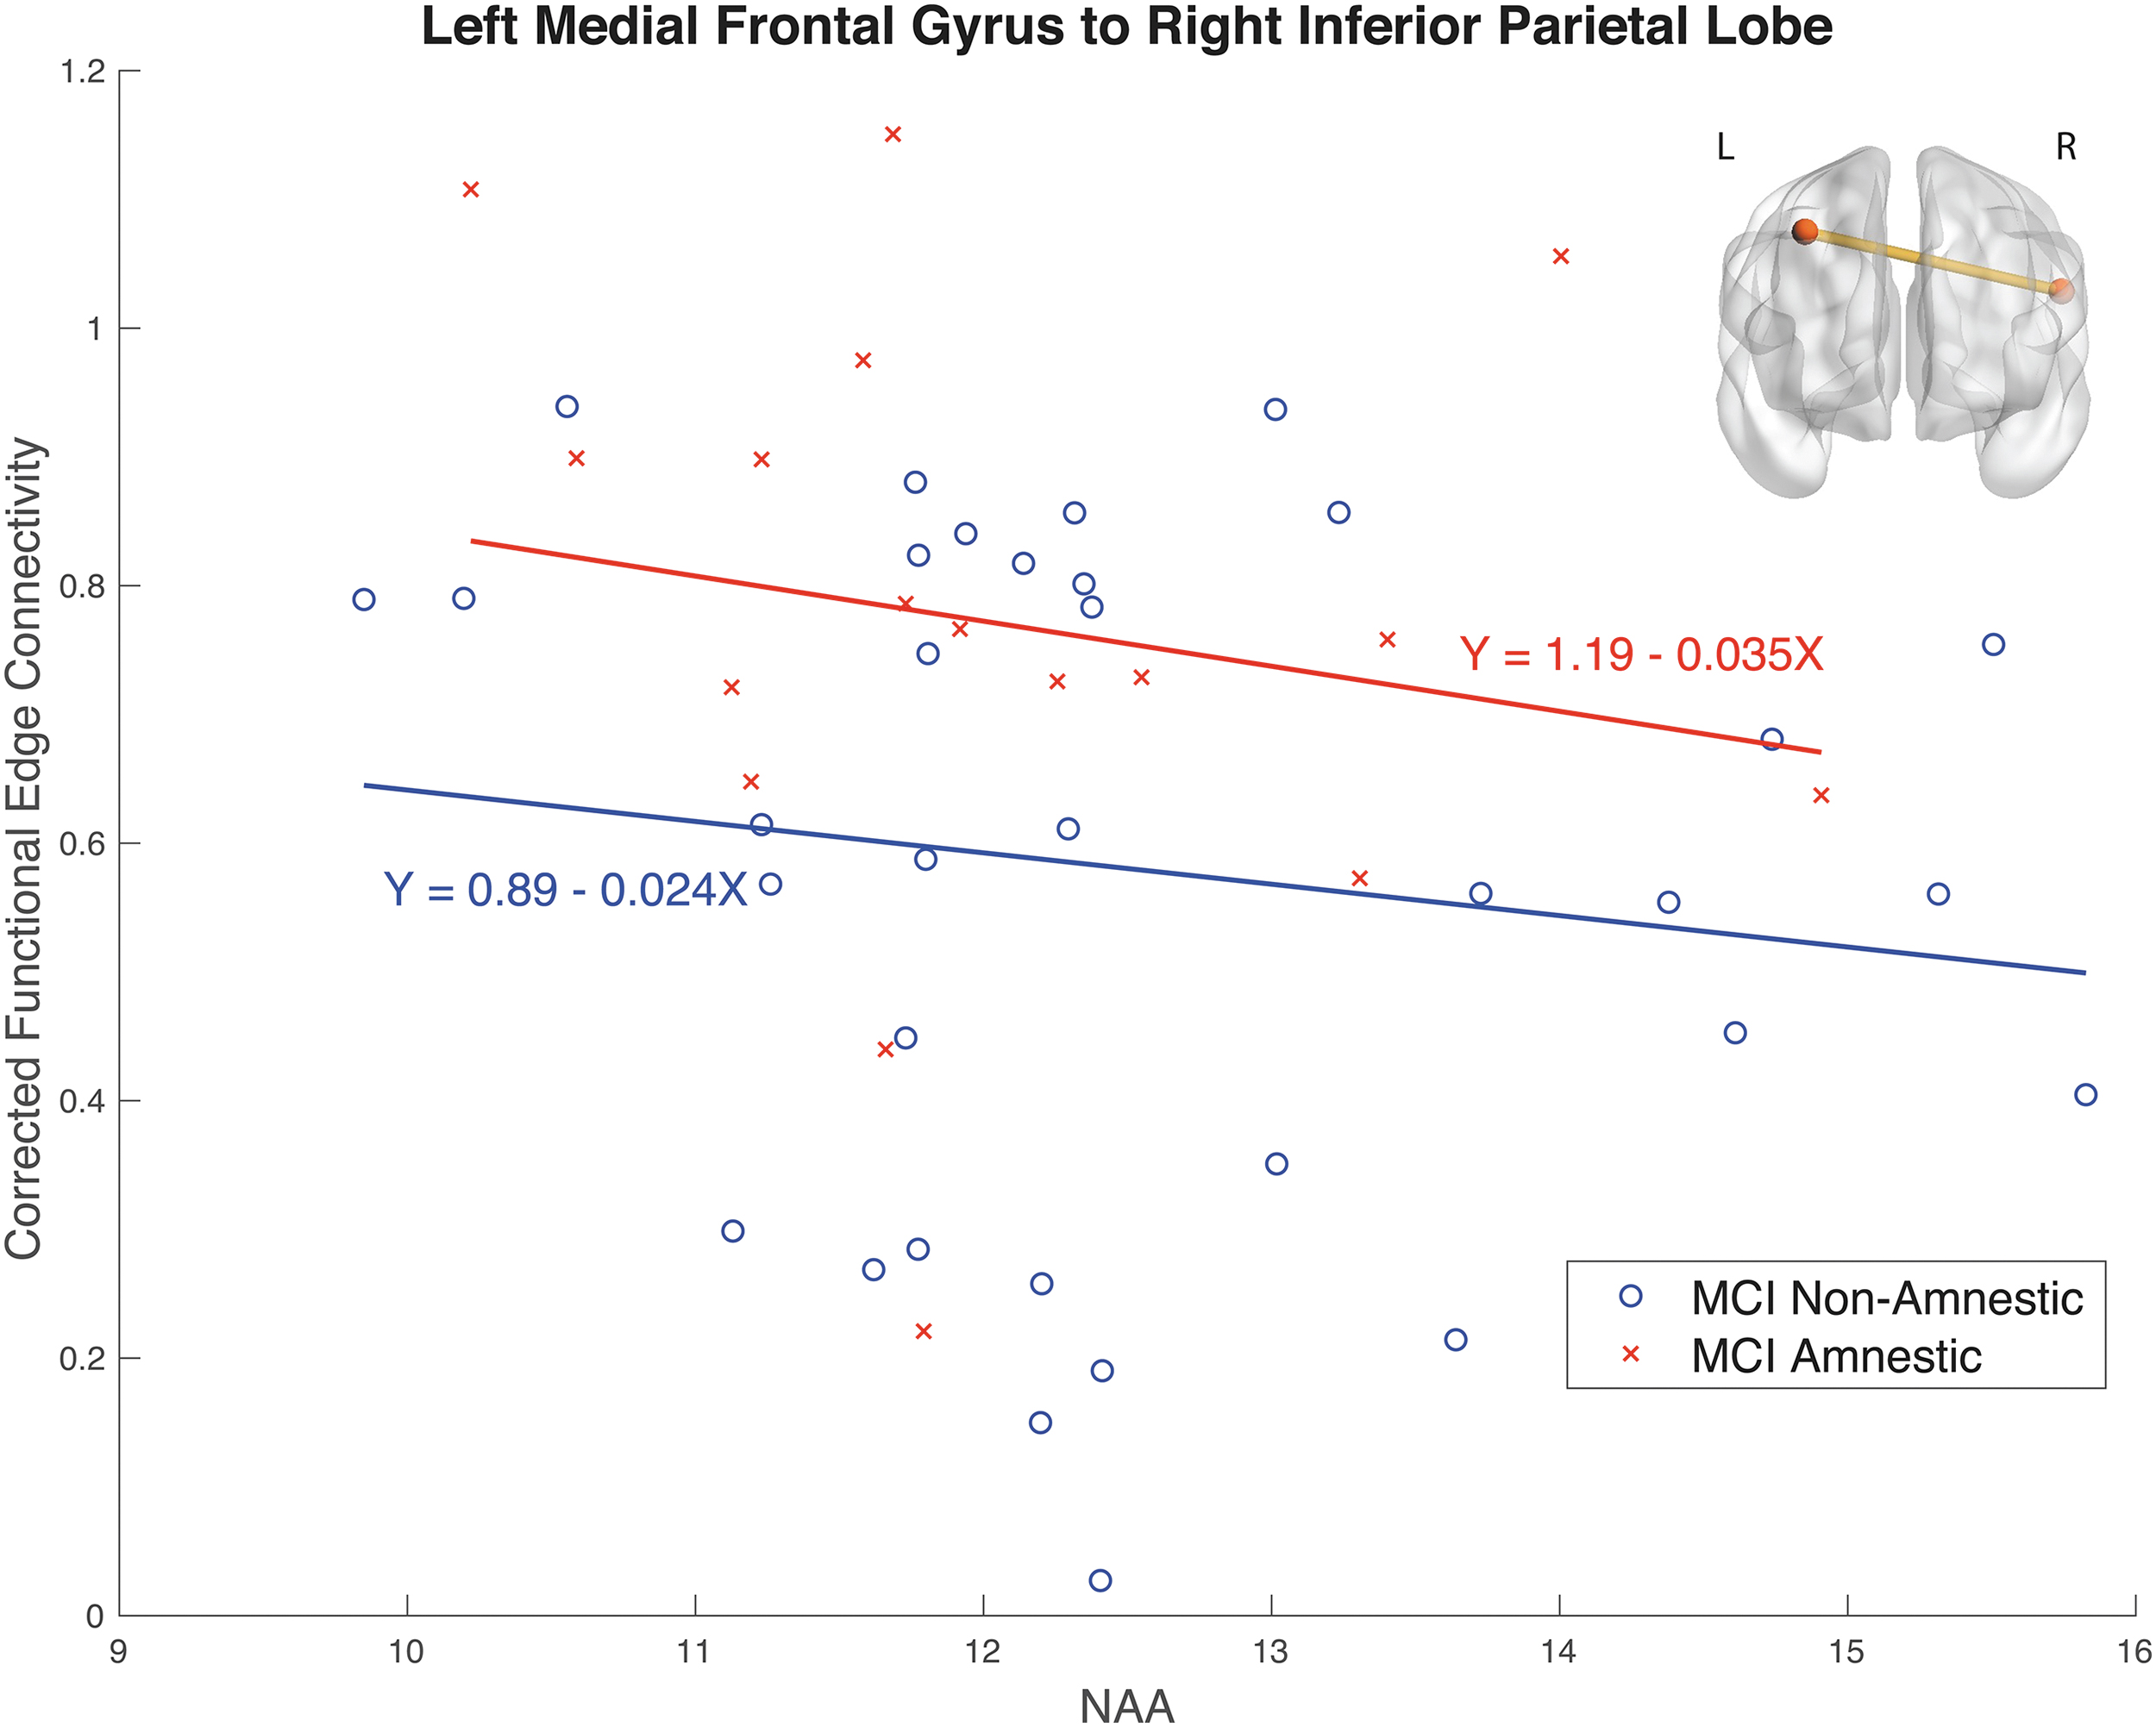
The connectivity between the left medial frontal gyrus and the right inferior parietal lobe for MCI nonamnestic, shown in blue circles, and MCI Amnestic, in red crosses, with the slope described in the adjacent equation. This was the only edge that differed significantly between MCI subtypes.
Effect of depression history
When repeating the same analysis but splitting the MCI group based on the depression history (i.e., no depression history vs. history of depression), there was no significant interaction between depressive history group and NAA.
Association with cognitive performance and vascular risk
The models investigating NAA levels and (average) corrected connectivity from the significant edges as predictors of cognitive performance showed no significant associations (all p > 0.24). Vascular risk was also not significantly associated with either NAA levels or DMN connectivity, nor the interaction (all p > 0.37).
Discussion
This study investigated the association between NAA levels within the left hippocampus and DMN connectivity in participants with MCI, compared with healthy controls. It found 20 connections that showed an inverse relationship, that is, increased DMN connectivity with decreased NAA levels in the MCI group, with no evidence of any associations in the healthy control group. The identification of an interrelationship between two known correlates of MCI (hippocampal NAA levels and DMN connectivity) is an interesting finding, especially given this occurred in the absence of group differences in either of these measures alone. This highlights the potential value of multimodal imaging studies in investigating systems that change in MCI to understand how such factors interact. Furthermore, as the association with NAA was found even when controlling for hippocampal volume, and no influence was found with hippocampal volume alone, it suggests the hippocampal NAA–DMN connectivity patterns precede observed volumetric decline.
Our finding of increased connectivity within the DMN associated with decreased levels of NAA lends support to the hypothesis of the increased DMN connectivity as a compensatory mechanism during early decline. Such changes have been observed in previous rsfMRI studies (Jin et al, 2012; Sohn et al, 2014), with change in the DMN and functional activity within the left medial temporal lobe (which contains the hippocampus), even in the absence of structural changes (Jin et al, 2012). Furthermore, the notion of distinct parts of the DMN being associated with the hippocampus is in line with a recent study, which attempted to disentangle the effects of hippocampal volume and age on the DMN (De Marco et al, 2019). In this recent study, decreased hippocampal volume was associated with lower connectivity in three regions within the right temporal gyrus. This is contrary to our findings that increased hippocampal NAA levels, a proxy for neuronal integrity within the hippocampus, were associated with decreased DMN connectivity, while accounting for age. Possibly, this is reflective of a shift in DMN function with advanced disease stage in the De Marco et al (2019) study.
It may be that once there is observable bilateral hippocampal atrophy, suggestive of a more advanced neurodegenerative state, the DMN is no longer acting in a compensatory way, rather it is showing a decline in connectivity, shifting from an inverse relationship (increasing activity associated with decreased NAA; seen in our study) to a negative relationship (decreased connectivity with decreased volume seen by De Marco et al, 2019). This aligns with previous work linking hippocampal deterioration with behavioral functioning (Nedelska et al, 2012; Sodoma et al, 2021; Wang et al, 2009; Zanchi et al, 2017) and as a predictor of clinical decline (Apostolova et al, 2006; Costafreda et al, 2011; Grundman et al, 2002; Wang et al, 2009). It would be valuable to conduct a follow-up study to examine the prognostic utility of this NAA–DMN link as a biomarker and to investigate right hippocampal NAA associations with DMN connectivity. Understanding how this association plays out in the progression of MCI, and if it could be used to target interventions, would be an immensely valuable practical step in this research.
When investigating the effect of MCI subtype on the relationship between DMN connectivity and NAA levels, only one edge showed significant difference in DMN–NAA slope between MCI-A and MCI-NA. The connection that showed a distinct NAA-connectivity slope was an interhemispheric edge connecting the left medial frontal gyrus to the right inferior parietal lobe. Change within these regions has previously been linked to participants with high genetic risk for Alzheimer's disease conferred by APOE genotype (Chen et al, 2015; Small et al, 2000). Furthermore, the right inferior parietal lobe has been a region suggested to be critical for “cognitive reserve,” where the cognitive performance is higher than would be anticipated based on observable brain atrophy (Robertson, 2014).
In our findings, MCI-A showed higher connectivity between left medial frontal gyrus and right inferior parietal lobe. This is contrary to the hypothesis by Robertson (2014) who proposed that intact connections from the right inferior parietal lobe are protective from cognitive decline. While the differences between MCI subtypes are interesting, it should be interpreted with caution as it would not have withstood correction for multiple comparisons and further studies to replicate this finding are warranted.
It is interesting to examine how these neurophysiological changes relate to cognitive performance. The inverse relationship between DMN and NAA levels did not associate with behavioral metrics. This may reflect its potential utility as an early marker of neuronal dysfunction. It is hypothesized that while the DMN is more active, it acts as compensatory mechanisms, protecting performance in cognitive tasks. It is possible that with time, the compensatory increased activation does not persist, and the cognitive decline becomes more marked. We suggest that if this study was to be repeated in a cohort with diagnosed AD, there would be a positive relationship between NAA levels and DMN connectivity, with decreasing NAA associated with decreased DMN connectivity; as the DMN is unable to maintain its compensatory processing and the decline in neuronal hippocampal integrity becomes greater. It would be valuable to extend this finding longitudinally to understand how this transition might change across time.
These interrelated measures highlight the need to better understand factors that impact these two, related, mechanisms. By understanding protective mechanisms, or risk factors, we can better understand the changes occurring and how to promote healthy aging. For instance, exercise has been shown to have a protective effect on hippocampal volume (Demnitz et al, 2021; Jonasson et al, 2016; Maass et al, 2015; Niemann et al, 2014; Rosano et al, 2017) and higher physical activity levels have been associated with greater DMN connectivity (Soldan et al, 2022).
The directionality of these effects cannot be disentangled here, but it is interesting to note that in a previous study investigating the effect of hippocampal damage on network organization, there was substantial change of functional networks throughout the cortex (Finke et al, 2013). Interestingly, a number of the regions that showed increased activity during a memory task in individuals with hippocampal damage overlap with the nodes included in our study (the posterior cingulate and precuneus). It is possible that the hippocampus is the key influence here, and by targeting interventions to the hippocampus, the DMN may be indirectly influenced.
Limitations/future directions
A key limitation to this study is the lack of data on amyloid status of our participants. As a result, we are unable to determine whether the changes occur relative to amyloid burden. Furthermore, the MCI diagnostic criteria used in this study were based on clinical characterization to capture multiple potential etiologies, rather than research criteria incorporating established biomarkers for a specific neurodegenerative pathology (e.g., the NIA-recommended criteria for MCI due to Alzheimer's disease; Albert et al, 2011).
It is of note that the fMRI data were acquired before current best-practice recommendations for scan length and parameters. This could impact the reliability of connectivity estimates. However, the multimodal imaging protocol in this data set did provide unique opportunity to investigate the association between hippocampal neuronal integrity through NAA levels and functional connectivity in an aging cohort. It is also worth noting that in an aging, at-risk population, with similar parameters, the test–retest measures were reasonable (Orban et al, 2015), suggesting an acceptable reliability of DMN connectivity with these parameters.
Conclusions
This study demonstrated an inverse association between hippocampal NAA levels and DMN connectivity in participants with MCI, with no evidence of any associations in the healthy control group or group differences in either of these measures alone. Our results suggest the possibility that by combining sensitive measures of neurodegeneration (like NAA levels) and changes in functional connectivity, markers obtained from MRI can be more sensitive to early cognitive decline and earlier intervention can be provided.
Footnotes
Acknowledgments
The authors acknowledge the technical assistance provided by Sydney Imaging and the Sydney Informatics Hub, two Core Research Facilities of the University of Sydney.
Authors' Contributions
Conceptualization: M.M.D., S.L.D., J.L., and F.C.; Data curation: M.M.D., S.L.N., and L.M.; Formal analysis: M.M.D., J.L., and A.D.; Funding acquisition: F.C. and S.L.N.; Methodology: M.M.D., J.L., and F.C.; Project administration: M.M.D., S.L.D., S.L.N., and F.C.; Software: J.L. and A.D.; Supervision: J.L., F.C., and S.L.N.; Visualization: M.M.D. and J.L.; Data Interpretation: M.M.D., J.L., S.L.D., L.M., S.L.N., and F.C.; Writing—original draft: M.M.D.; Writing—review and editing: M.M.D., J.L., S.L.D., A.D., L.M., S.L.N., and F.C.
Author Disclosure Statement
No competing financial interests exist.
Funding Information
S.L.N. is supported by an NHMRC Boosting Dementia Fellowship. L.M. is supported by a NHMRC-ARC Dementia Research Development Fellowship (No. 1109618). F.C. is supported by the National Health and Medical Research Council of Australia (APP1091593 and APP1117724), and the Australian Research Council (DP170101815).
Supplementary Material
Supplementary Data
References
Supplementary Material
Please find the following supplemental material available below.
For Open Access articles published under a Creative Commons License, all supplemental material carries the same license as the article it is associated with.
For non-Open Access articles published, all supplemental material carries a non-exclusive license, and permission requests for re-use of supplemental material or any part of supplemental material shall be sent directly to the copyright owner as specified in the copyright notice associated with the article.