
Abstract
Attention-deficit/hyperactivity disorder (ADHD) persistence into adulthood depends on gender, with 60% female and 35% male cases. This study sought to investigate gender differences in dynamic functional network connectivity (FNC) using resting-state functional magnetic resonance imaging data of pediatric ADHD patients (female: N = 24; 11.02 ± 2.60 years, male: N = 20;11.87 ± 2.62 years) and adult ADHD patients (female = 19; 31.11 ± 10.40 years, males: N = 20;32.05 ± 10.10 years). We identified nine and eight networks in pediatrics and adult data, respectively, using group independent component analysis (GICA). Each age group was clustered into four states using K-means. Significant gender differences in the pediatric group were only found in temporal profiles, particularly in “fraction of time” (FOT) and “mean dwell time” (MDT), but not in FNC. FOT spent by the female pediatric group in state 4 showed a negative relationship with hyperactivity severity. Compared with the adult male group, reduced connectivity was observed within the visual network (VN), between the VN and default-mode network (DMN), and frontoparietal network, as well as between the DMN and cerebellum networks in female adult ADHD patients. Significant FOT and MDT differences were observed between the two groups in state 3. Our results imply gender differences in ADHD, especially in the adult group. Furthermore, given the gender differences observed, our work provides insights into the pathophysiology of ADHD subserved by gender.
Impact statement
Attention-deficit/hyperactivity disorder (ADHD) symptoms differ between genders; however, little has been done to determine gender differences in pediatric and adult ADHD patients. The present work presents the first gender-specific dynamic functional network connectivity study for different age groups of ADHD patients and highlights the discrepancies between male and female ADHD patients, particularly in the adult group, which may be due to the persistence of inattentive symptoms in female ADHD patients from childhood into adulthood. Given the gender differences observed in the current study, clinicians could consider treatment strategies that target each gender in each age group. The present work provides further insight into the connectivity patterns of the resting-state network in ADHD and may also serve as a basis for future sex-specific studies in different age groups in other disorders.
Introduction
Attention-deficit/hyperactivity disorder (ADHD) is a neurodevelopmental disorder that mainly affects children but often persists into adulthood (American Psychiatric Association, 2000; Danielson et al, 2018), with an estimated worldwide prevalence of 7.2% in children below 18 years and 4.4% in adults (Kessler et al, 2006; Thomas et al, 2015). The Diagnostic and Statistical Manual of Mental Disorders, Fourth Edition (DSM-IV) divided ADHD into three subtypes, which differ between females and males, namely, hyperactive/impulsive, inattentive, and combined (C) type. ADHD exhibits structural and functional deficits in some brain regions (Konrad and Eickhoff, 2010). Disrupted functional connectivity (FC) of some networks, such as the default mode, executive control, salience, and attention-related networks have been observed in ADHD patients (Bos et al, 2017; Sidlauskaite et al, 2016). These networks are linked to ADHD symptoms, such as impairments in the processing of executive functions and distractibility (Francx et al, 2015a; Zhao et al, 2017).
ADHD persistence into adulthood varies according to gender, with about 60% and 35% for females (Hinshaw et al, 2012) and males (Biederman et al, 2010), respectively. Some studies suggest that females are most likely to show inattentive symptoms, whereas males are most likely to show combined symptoms, with a higher rate of hyperactive and impulsive behaviors (Li et al, 2019; Willcutt, 2012). Inattentive symptoms are purported to persist with time, whereas hyperactive and impulsive symptoms tend to decrease, which might cause differences in ADHD prevalence between females and males during childhood and adulthood (Francx et al, 2015b; Li et al, 2019; Williamson and Johnston, 2015).
Furthermore, for neural changes, ADHD-related sex differences are essential interindividual variables to consider. However, there is a surprising lack of research on gender-based comparisons across all ages. For every girl diagnosed with ADHD, there are two to three boys; that is, the ratio of males to females diagnosed with the disorder is about 2:1 (Ramtekkar et al, 2010), and there are also gender differences in the expression of symptoms. For instance, boys with ADHD show more impulsive behaviors and greater deficits in executive function and social behavior, whereas girls with ADHD have lower average intelligence and show more internalizing (e.g., depressive) symptoms and fewer disruptive behaviors (Gershon, 2002; Rucklidge, 2010). In addition, magnetic resonance imaging (MRI) studies have shown sex differences in children with and without ADHD, as well as structural and functional differences between children with ADHD and those without ADHD (Cao et al, 2014; Konrad and Eickhoff, 2010).
Moreover, there is evidence that boys with ADHD have more significant motor deficits on the behavioral level (Cole et al, 2008; Hasson and Fine, 2012; Seymour et al, 2016), as well as the corresponding neural circuitry (Dirlikov et al, 2015; Mahone et al, 2011). Also, unlike boys, girls with ADHD exhibit comparable or more significant executive dysfunction in neural profiles (Dirlikov et al, 2015; Jacobson et al, 2015). Although the task-based functional, behavioral, and morphological changes comparable between girls and boys have been shown (Patros et al, 2018; Rosch and Mostofsky, 2015; Rosch et al, 2015), the current literature is inadequate to support these findings, especially with respect to resting-state neuroimaging across all age groups.
Resting-state functional MRI (fMRI) is commonly used to evaluate the temporal coherence of activity between different brain areas, usually obtained as a correlation or connectivity matrix. To track connectivity patterns in neurological patients, several key pioneering approaches have been applied; one of these methods is dynamic functional network connectivity (dFNC), which is used to examine functional network connectivity (FNC) patterns over a short period of time. This approach has been applied in several ADHD studies and has yielded fascinating results showing within- and between-network disconnections (Agoalikum et al, 2021; de Lacy and Calhoun, 2018; de Lacy et al, 2017), suggesting that this method can capture the time-varying nature of FNC in ADHD patients.
Given the gender differences in ADHD prevalence during childhood and adulthood and the diverse features between males and females mentioned above, we hypothesize that these differences will manifest in their respective neuroimaging profiles. To this end, we investigate the time-varying FNC differences between female and male ADHD patients during childhood and adulthood using group independent component analysis (GICA), sliding window correlation, and K-means clustering.
Materials and Methods
Data acquisition
Resting-state functional and structural MRI data of ADHD patients (104 subjects) were obtained from the New York University Child Study Center for the ADHD-200 Global Competition and UCLA dataset (Bilder et al, 2016). The NYU dataset (pediatric dataset) is made up of 26 female ADHD patients and 38 male ADHD patients, and the UCLA dataset (adult dataset) is made up of 19 female ADHD patients and 21 male ADHD patients. Both datasets are made openly to researchers online at the ADHD-200 Sample page on the International Neuroimaging Datasharing Initiative website and OpenNeuro website. All participants used in the current study were diagnosed with ADHD, and their scores have been used for the correlation analysis in the present study. Detailed information about the subjects can be found in Table 1.
Data Demographics
ADHD, attention-deficit/hyperactivity disorder; H, hyperactivity severity; IA, inattentive severity; OA, overall severity.
For the adult dataset, MRI data were acquired on one of two 3T Siemens Trio scanners, located at the Ahmanson-Lovelace Brain Mapping Center (Siemens version syngo MR B15) and the Staglin Center for Cognitive Neuroscience (Siemens version syngo MR B17) at UCLA. fMRI data were collected using a T2*-weighted echo-planar imaging (EPI) sequence with the following parameters: slice thickness = 4 mm, slices = 34, repetition time (TR) = 2 sec, time to echo (TE) = 30 ms, flip angle = 90°, matrix 64 × 64, and field of view (FOV) = 192 mm. A T2-weighted matched-bandwidth high-resolution anatomical scan (with the same slice prescription as the fMRI scan) and MPRAGE were also collected. The parameters for the high-resolution scan were: 4 mm slices, TR/TE = 5000/34 ms, four averages, matrix = 128 × 128, and 90° flip angle. The parameters for MPRAGE were the following: TR = 1.9 sec, TE = 2.26 ms, FOV = 250 mm, matrix = 256 × 256, sagittal plane, slice thickness = 1 mm, and 176 slices.
For the pediatric dataset, MRI data were obtained using Siemens Magnetom Allegra Syngo Mr 2004a. fMRI data were collected using an EPI sequence with the following parameters: slice thickness: 4 mm, slices: 33, TR: 2000 ms, TE: 15 ms, rotation = 90°, FOV phase: 80.0%, and FOV read = 240 mm. In addition, T1-weighted images were acquired using the following parameters: Slice thickness = 1.33 ms, TR = 2530 ms, TE = 3.25 ms, rotation = 0°, FOV phase = 100.0%, and FOV read = 256 mm.
Data preprocessing
In the adult dataset, the first 2 time points were removed, leaving final time points of 150. For the pediatric dataset, the first 5 time points were removed leaving final time points of 171. The same preprocessing steps were done for all subjects, including slice time correction, realignment, coregistration of T1 images to corresponding functional images, segmentation, normalization by Diffeomorphic Anatomical Registration using Exponentiated Lie algebra (DARTEL) (Ashburner, 2007), resampling to 3 × 3 × 3 mm3 voxels, nuisance covariates regression using Friston 24 (Friston et al, 1996), and spatial smoothing with a 6 mm full-width half-maximum Gaussian kernel.
Pediatric and adult datasets were preprocessed separately to ensure that the correct templates were generated for normalization. Subjects with a maximum translation >2 mm or rotation >2° were excluded from further analysis, leaving 94 subjects. The final data used for further analysis included 24 female pediatric ADHD patients (11.02 ± 2.60 years), 31 male pediatric ADHD patients (11.87 ± 2.62 years), 19 female adult ADHD patients (31.11 ± 10.40 years), and 20 male adult ADHD patients (32.05 ± 10.10 years).
All preprocessing steps were performed using the data processing assistant for resting-state fMRI, advanced edition (DPARSFA) in the DPABI toolbox (Yan et al, 2016).
Group spatial independent component analysis
Each dataset was separately decomposed into functional networks using a group-level spatial ICA as implemented in the GIFT toolbox. A relatively high model order with 60 components was performed using the Infomax algorithm with a best-run selection from 10 randomly initialized analyses to achieve a functional parcellation of refined cortical and subcortical components corresponding to known anatomical and functional segmentations (de Lacy and Calhoun, 2018; Himberg et al, 2004).
To make sure that all components selected were intrinsic component networks (ICNs), sorting was performed using a combination of visual inspection and quantitative metrics. For each of the 60 components in each dataset, spectral metrics of (1) fractional amplitude of low-frequency fluctuations and (2) dynamic range were generated. Generally, independent components representing brain networks are said to have higher values in these spectral metrics, whereas noise components are said to have lower values (Allen et al, 2012; Allen et al, 2011). Hence, we checked the spectral metrics of each component, and only components with high values in these spectral metrics were retained for further scrutiny.
Components were also visually inspected, and their peak coordinates were used to determine their correspondence with gray matter. Components with poor overlap with the cerebral gray matter or low spectral metrics were discarded. The remaining 55 components for the pediatric group and 45 components for the adult group represented the intrinsic networks (INs) used in this study.
dFNC analysis
The selected components underwent additional postprocessing (linear detrending, despiking, and low-pass filtering with a high-frequency cutoff at 0.15 Hz) to remove any remaining sources of noise. dFNC was estimated based on the sliding window approach. Based on previous studies (Allen et al, 2014; Klugah-Brown et al, 2019), we selected a window width size of 22 TRs = 44 sec and sliding steps of 1 TR for both groups, resulting in 149 and 128 windows for pediatric and adults, respectively. This was obtained for all subjects in each dataset to give a total of 8195 instances (55 subjects × 149 windows) for the pediatric group and a total of 4992 instances for the adult group (39 subjects × 128 windows). For each window, FNC was estimated between ICNs from a regularized inverse covariance matrix using the graphical LASSO method (Friedman et al, 2008). An L1 norm was placed on the inverse covariance matrix to promote sparsity, and the regularization parameter (lambda) was optimized for each subject. The dFNC values were then Fisher-Z transformed.
In brief, the graphical LASSO method is a method used for learning the structure in an undirected Gaussian graphical model, which uses L1 regularization in controlling the number of zeros in the precision matrix Θ = ∑−1. Kindly refer to Banerjee et al, 2008; Meinshausen and Bühlmann, 2006; Yuan and Lin, 2007 for more information.
K-means clustering was used to cluster all dFNC windows based on the correlation distance. Clustering numbers from 2 to 10 were selected, representing cluster states. For each K, the clustering algorithm was repeated 500 times to increase the chances of escaping local minima, with random initialization used to obtain the state cluster centroids. The optimal number of clusters (K) was estimated using the elbow criterion resulting in K = 4 (Supplementary Fig. S1), with subjects well distributed across the four cluster states for each age group and gender. Only the selected ICNs were used in the clustering, resulting in a total of (55 × (55 − 1))/2 = 1485 features for the pediatric group and (45 × (45 − 1))/2 = 990 features for the adult group. These features were then used for the dFNC analysis between females and males in each age group.
FNC, fraction of time (FOT), mean dwell time (MDT), and transition probabilities were compared between females and males in each age group in each cluster state. Correlation analyses were also performed to determine the impact of age, overall ADHD severity, hyperactivity severity, and inattentive severity on FOT and MDT of each gender in each cluster state of each age group. All statistical analyses were performed using MATLAB (Mathworks, Inc.). Age, gender, and mean framewise displacement were used as covariates for statistical analyses. False discovery rate was used for multiple comparison corrections. The data analysis pipeline is shown in Figure 1.
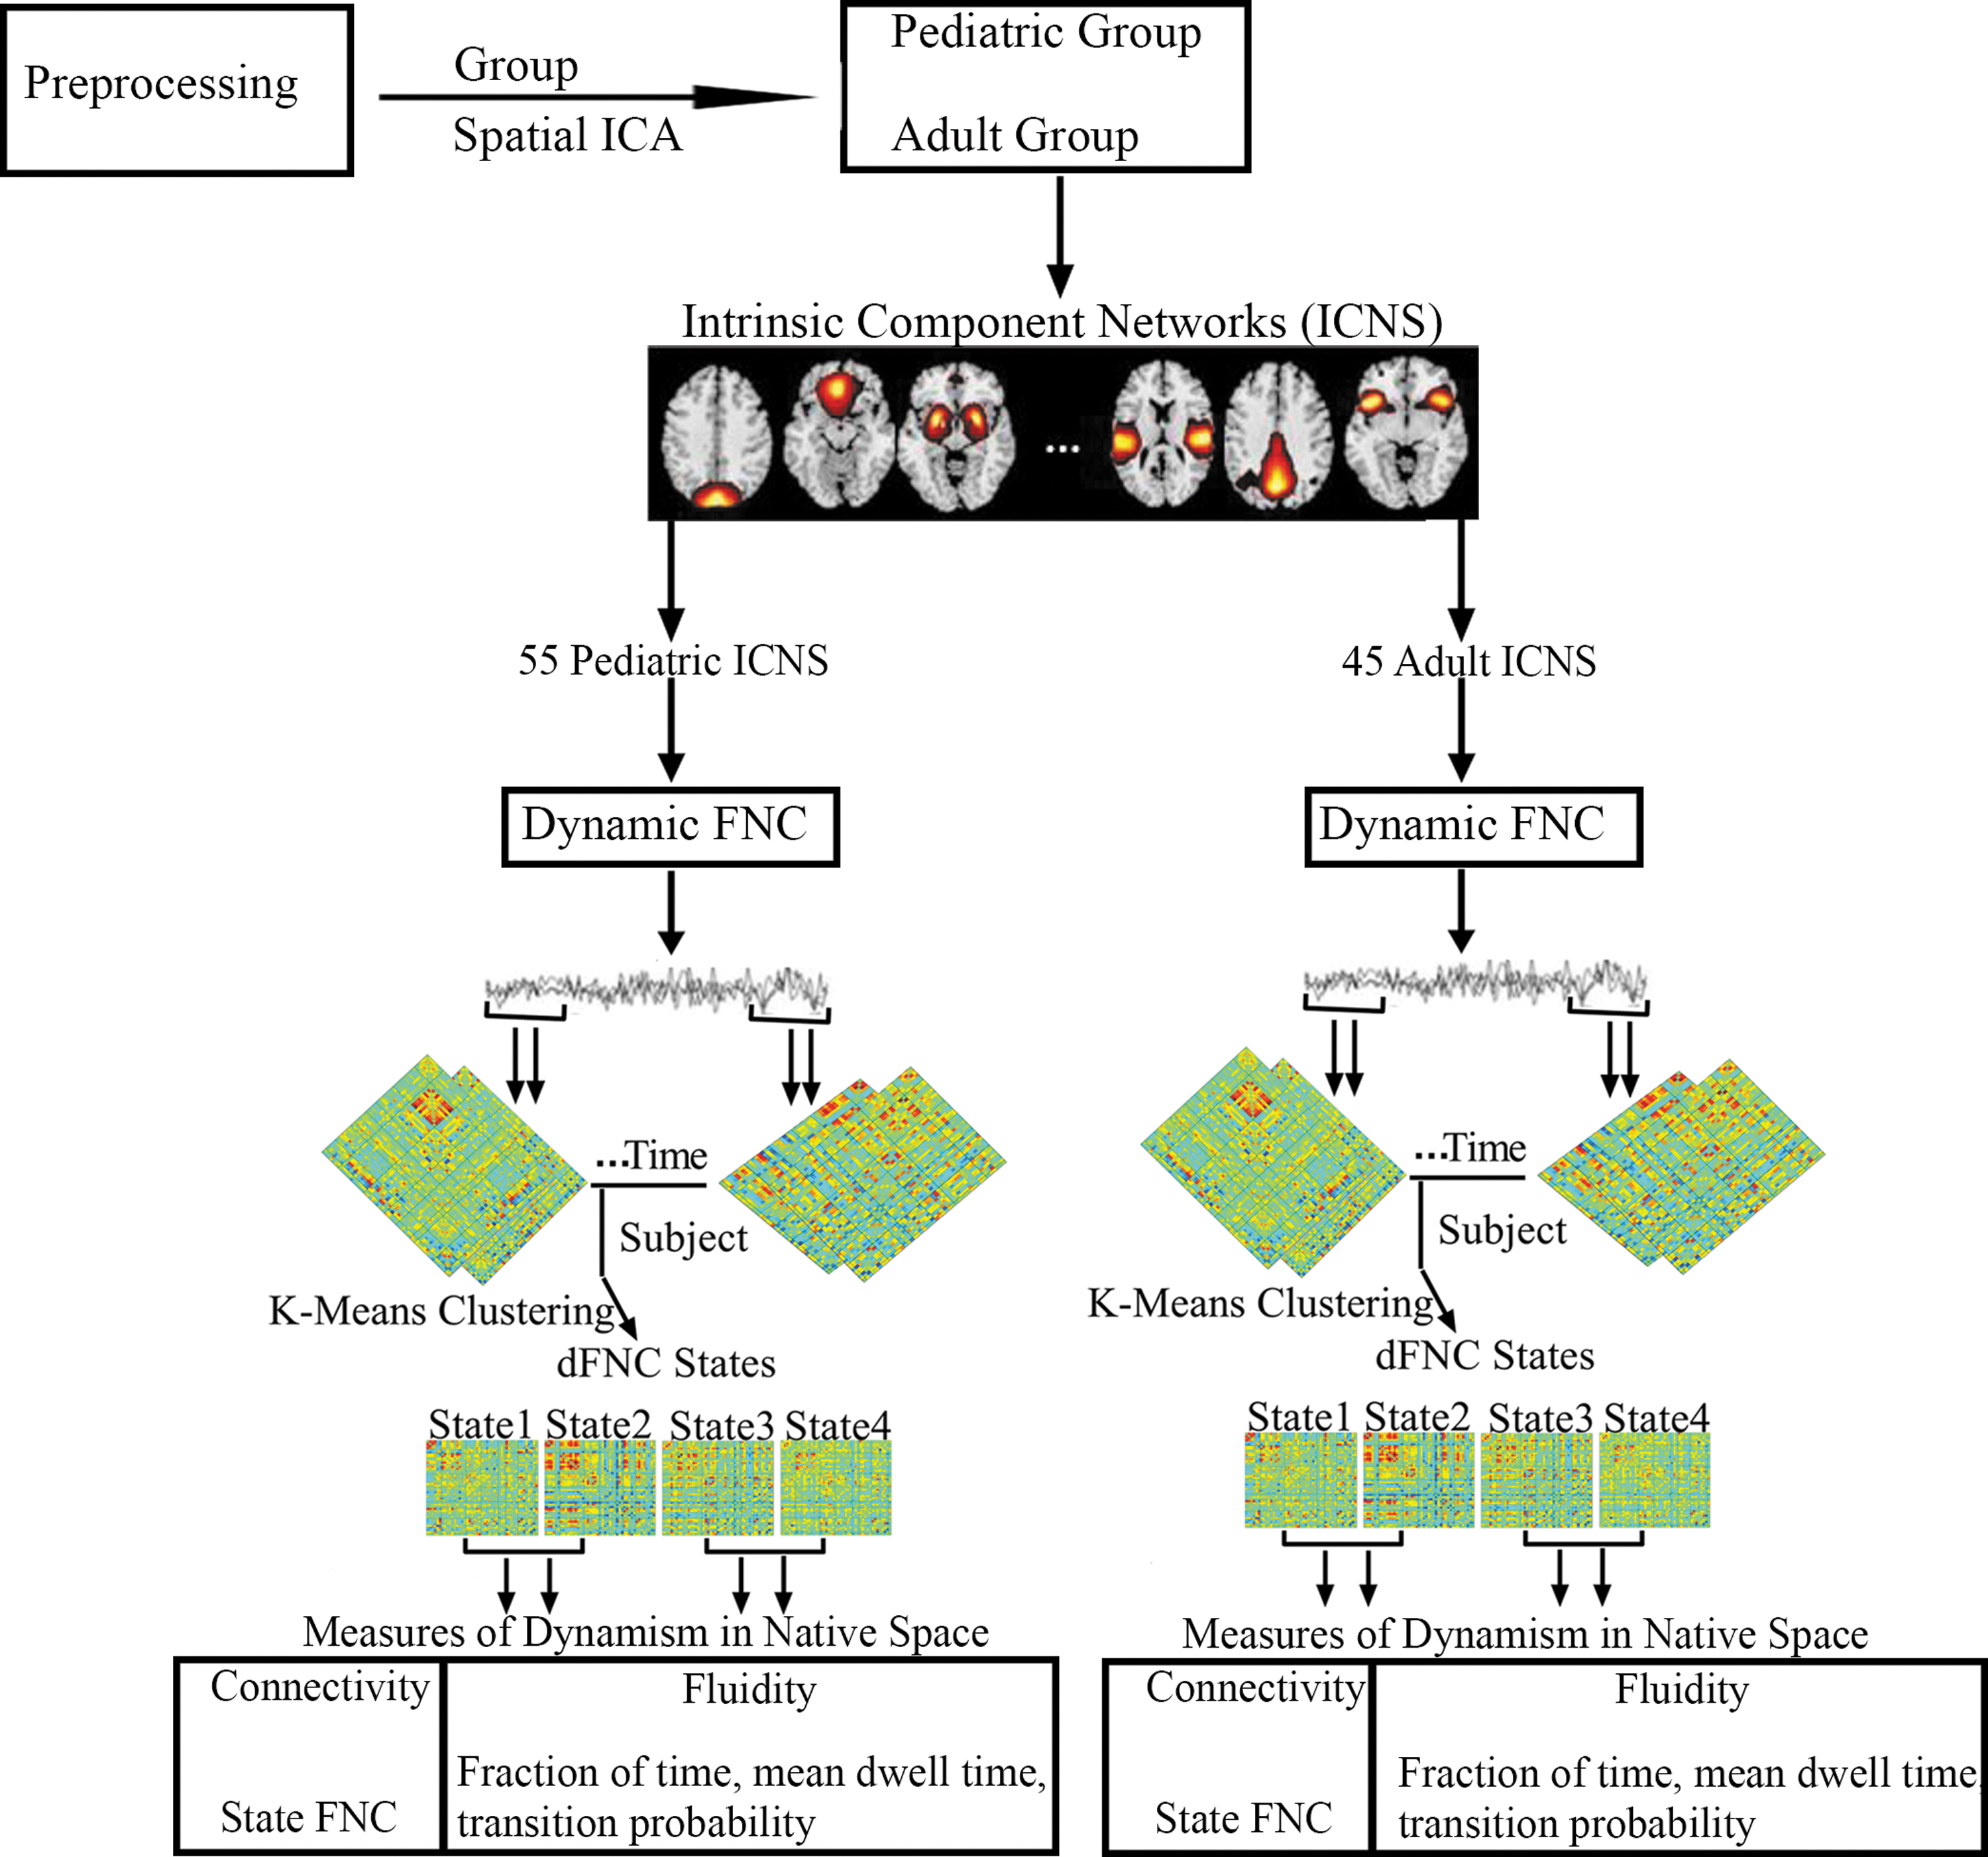
Schematic diagram of the analysis pipeline. rs-fMRI data was preprocessed and subjected to spatial group ICA resulting in 60 ICs for each age group. Intrinsic component networks were selected from the 60 ICs of each age group resulting in 55 ICs for the pediatric group and 45 ICs for the adult group. For dFNC, the sliding window approach was adopted and clustered using K-means to obtain four cluster states for each group. Based on these four cluster states, four measures of dynamism were computed in native space for both age groups. dFNC, dynamic functional network connectivity; IC, independent component; ICA, independent component analysis; rs-fMRI, resting-state functional magnetic resonance imaging.
Results
Spatial ICA and ICNs
Spatial maps of the pediatric group ICNs and their time courses were decomposed using GICA. The selected 55 ICNs were further categorized into 9 networks based on their anatomical and functional properties, including the sensorimotor network (SMN), visual network (VN), default mode network (DMN), central executive network (CEN), cerebellum network (CBN), subcortical network, auditory network (AUD), frontoparietal network (FPN), and salience network (SN). The activation peaks of the identified ICNs primarily fell on the gray matter (Supplementary Fig. S2).
Spatial maps of the adult group ICNs and their time courses were also decomposed using GICA. The selected 45 ICNs were further categorized into 8 networks based on their anatomical and functional properties, including the SMN, VN, DMN, CEN, CBN, AUD, FPN, and SN. The activation peaks of the identified ICNs primarily fell on the gray matter (Supplementary Fig. S3).
dFNC states
Four reoccurring dFNC states over time were identified in the pediatric group using K-means clustering, and the cluster centroids of each dFNC state are shown in Figure 2. Connectivity patterns were relatively similar across the two genders (Supplementary Fig. S4A) Positive connectivity was found within the VN across all four cluster states, with state 2 distinguishing itself from the other states with a strong positive connectivity within the VN. The CBN showed negative connectivity with the other networks in states 1 and 3, with state 3 further differentiating itself with negative connectivity between some ICNs of the AUD and FPN, and the other networks. The DMN generally exhibited positive connectivity across the four cluster states.
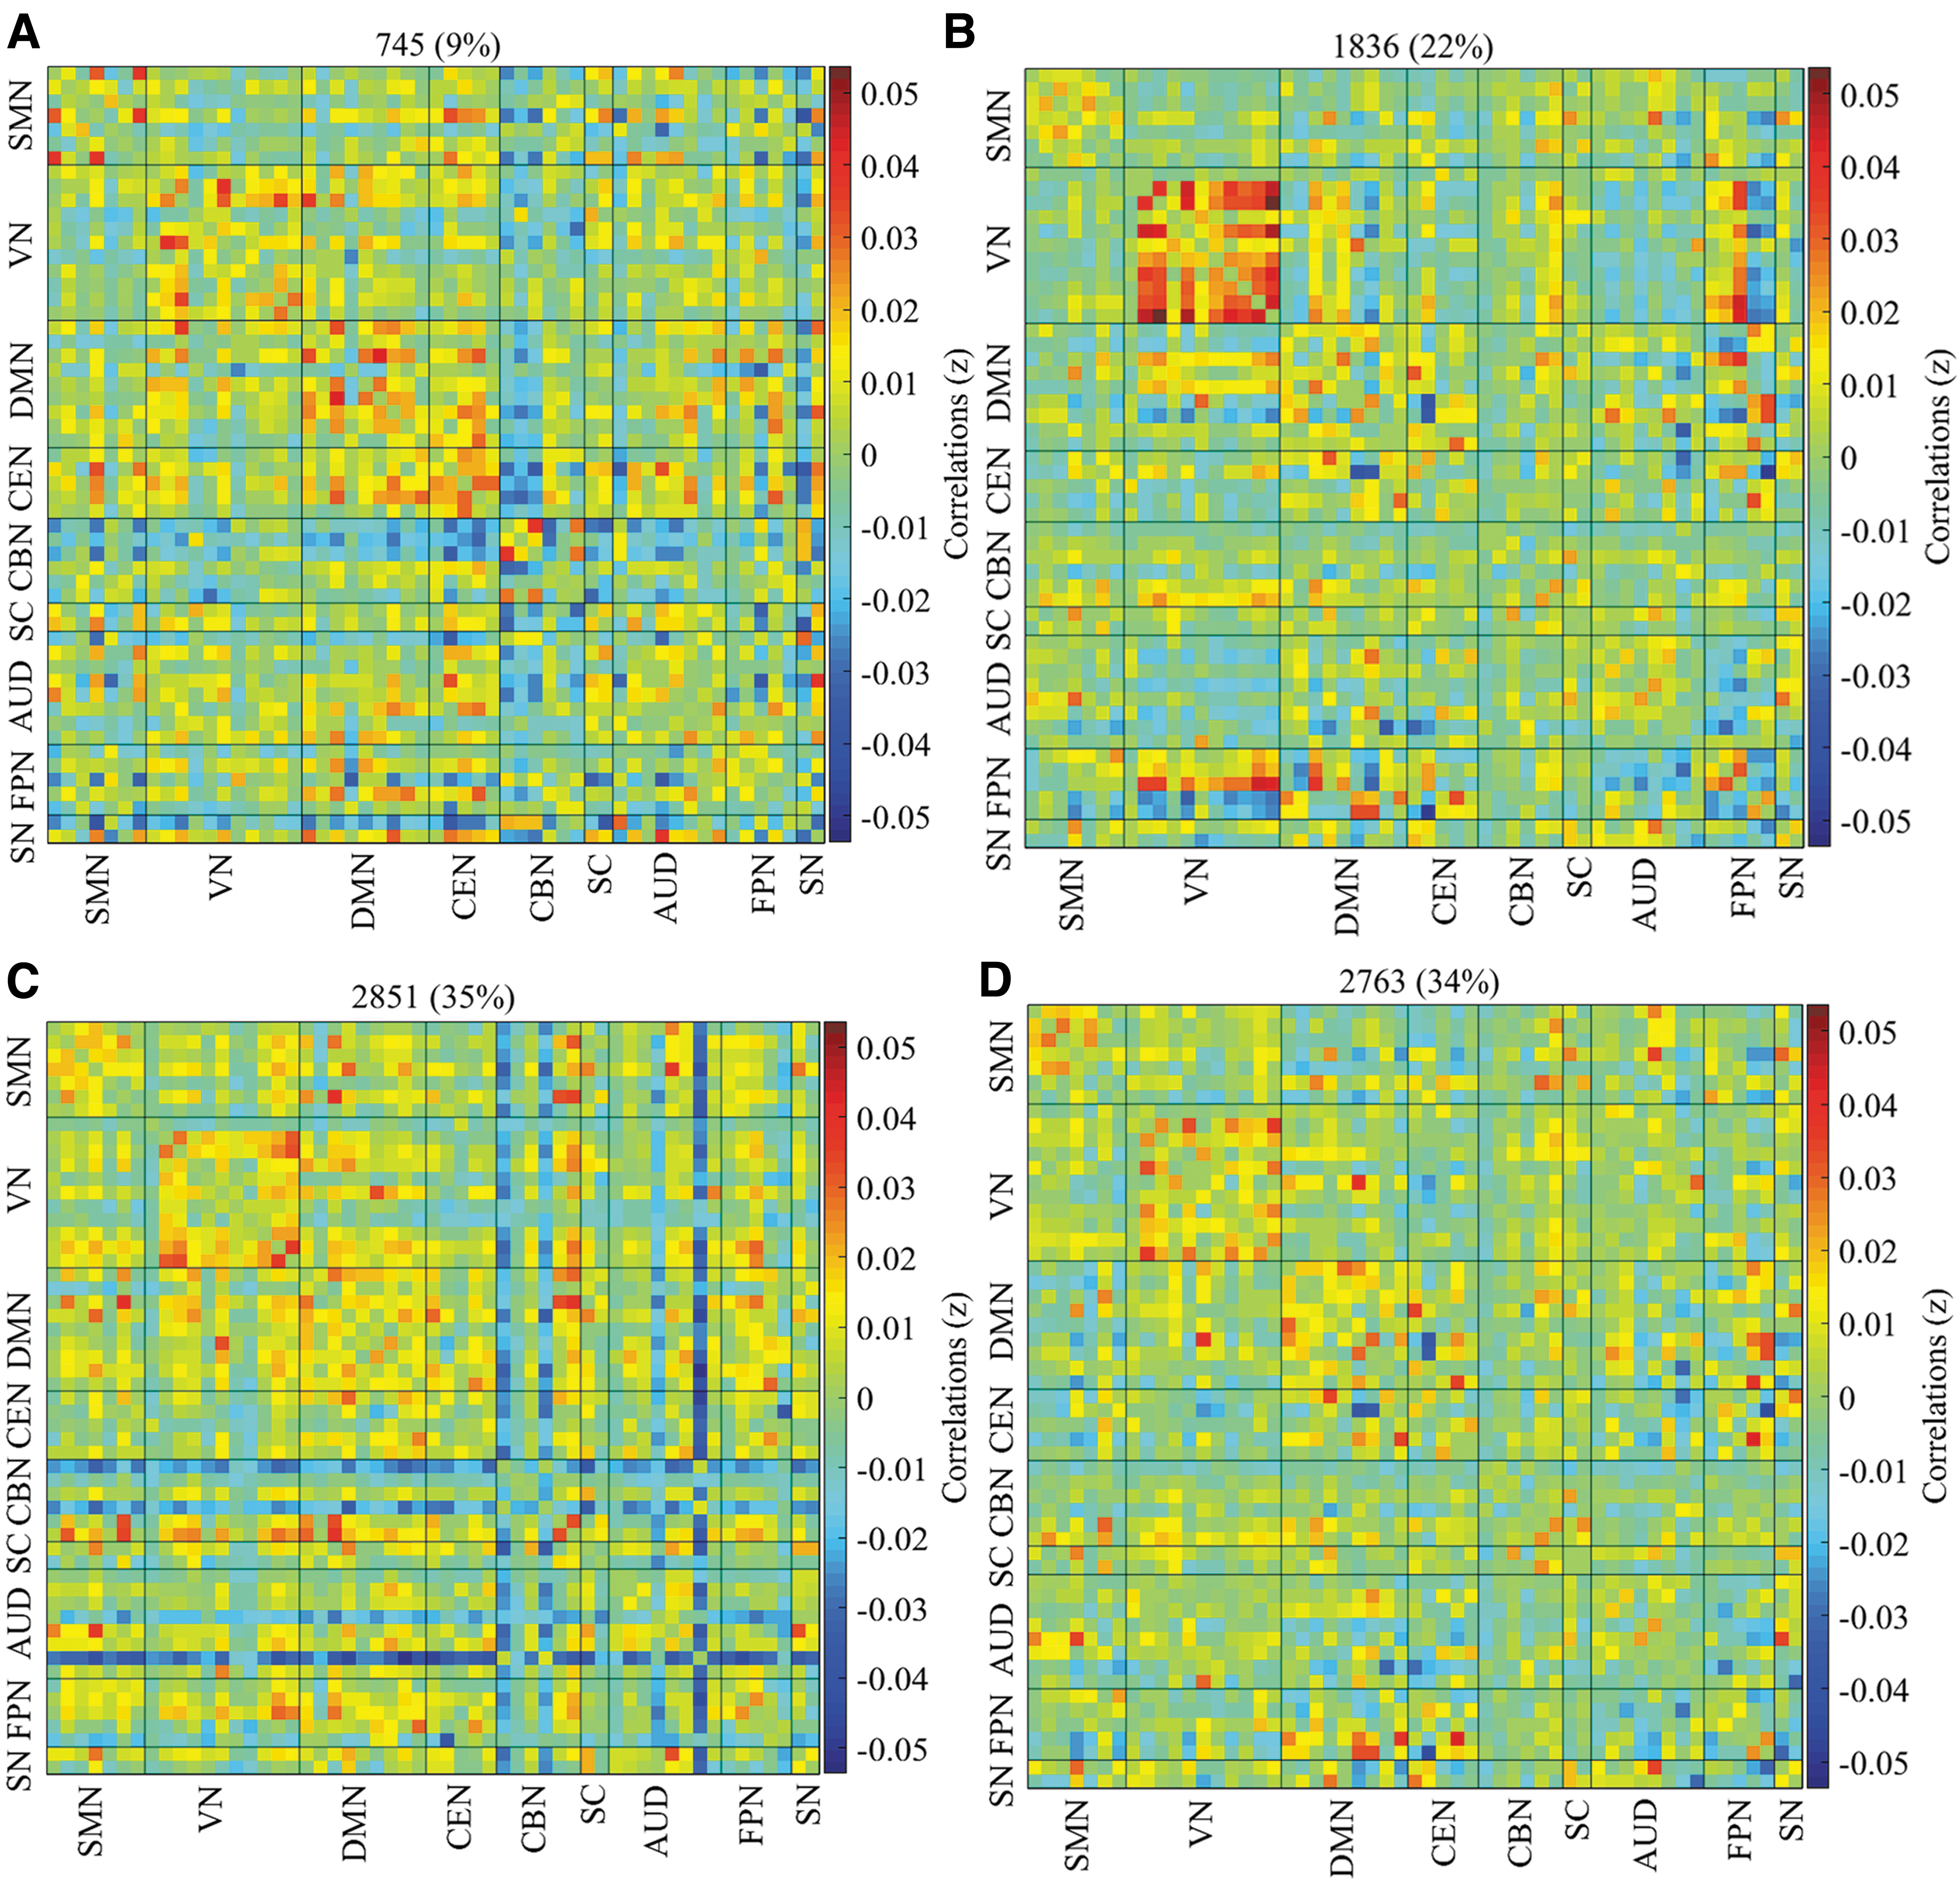
Percentage of occurrence in the pediatric group. The median of all subjects together with the total number and percentage of occurrences are displayed in each state.
For the adult group, four reoccurring dFNC states over time were identified using K-means clustering, and the cluster centroids of each dFNC state are shown in Figure 3. Both female and male adult ADHD patients showed similar connectivity patterns (Supplementary Fig. S4B). The VN exhibited positive within-network connectivity across the four cluster states, with state 2 showing strong positive connectivity within the VN than the other states. Negative connectivity was observed between some ICNs in the CBN, CEN, AUD, and FPN and the other networks in states 2 and 3, but the connectivity was stronger in state 2 than state 3. The SMN also showed positive connectivity across the four states with strong positive connectivity in states 1 and 2, and weak positive connectivity in states 3 and 4.
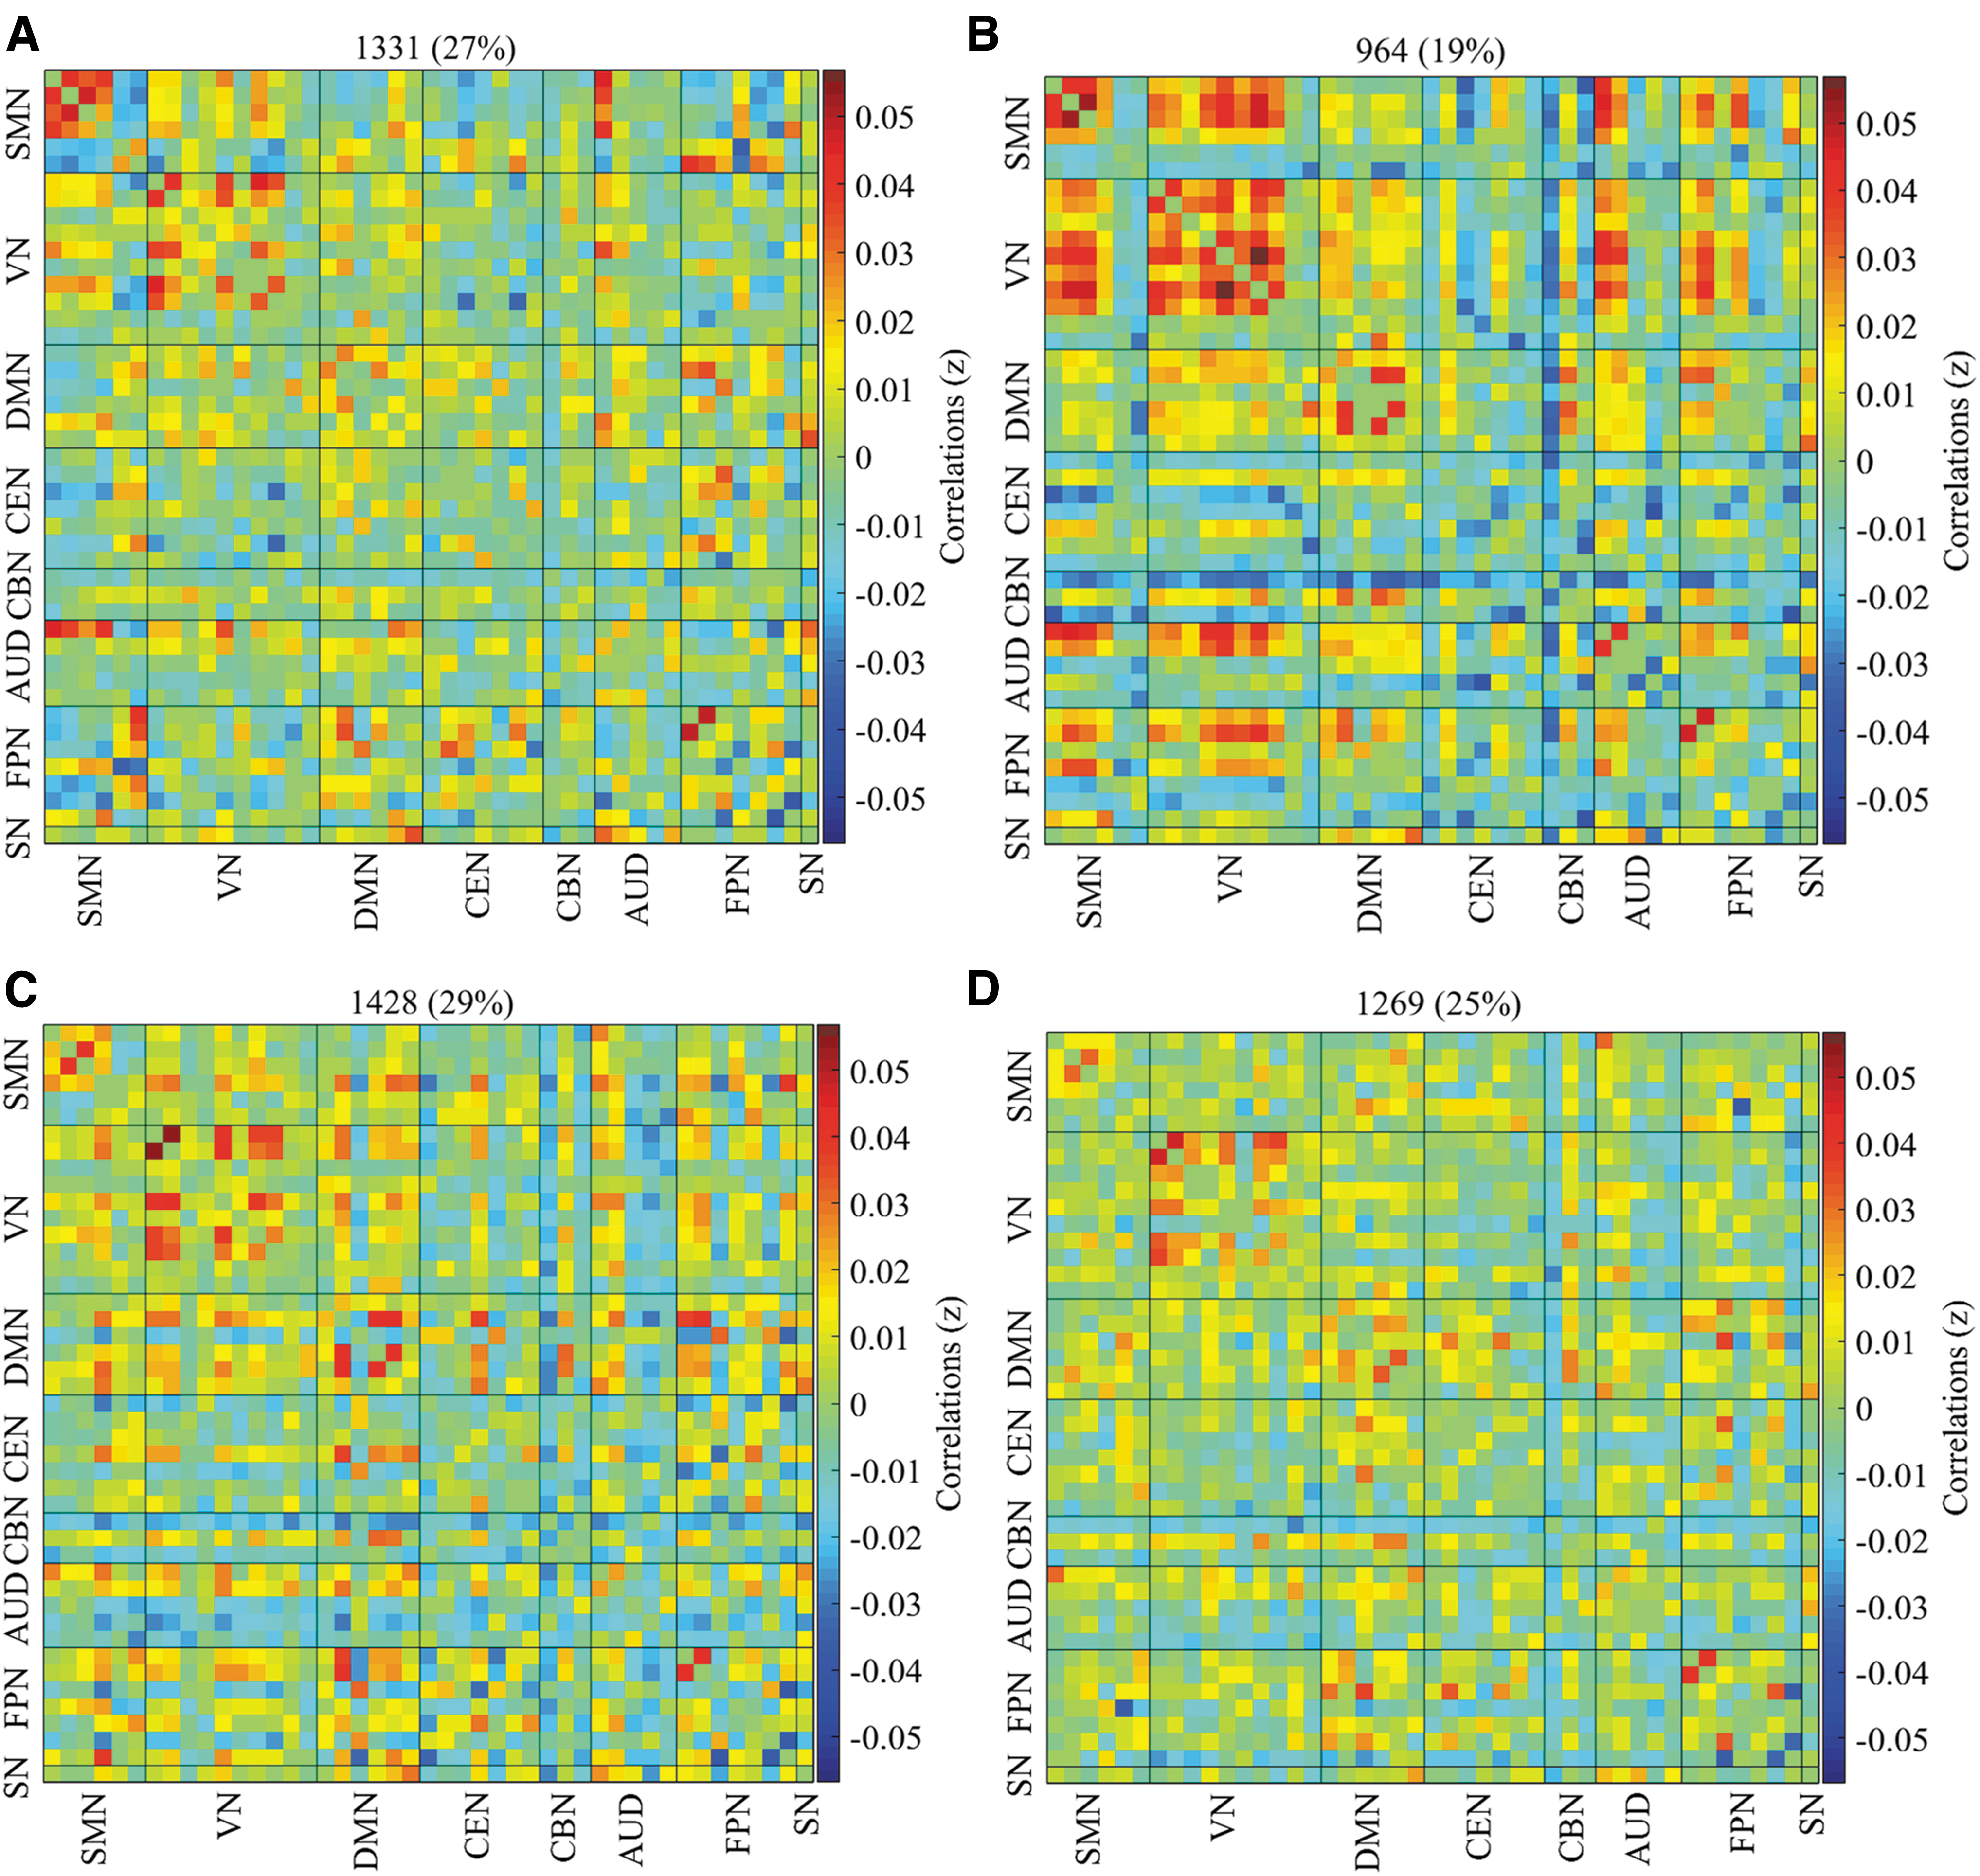
Percentage of occurrence in the adult group. The median of all subjects together with the total number and percentage of occurrences are displayed in each state.
Group differences in dFNC states
Two-sample t-tests were used to determine significant gender differences in both pediatric and adult ADHD patients.
Female pediatric ADHD versus male pediatric ADHD
No significant FNC differences were found between female and male pediatric ADHD patients.
Female adult ADHD versus male adult ADHD
Relative to male adult ADHD patients, reduced network connectivity within the VN, between the VN and DMN, VN and FPN, and between the DMN and CBN were observed in female ADHD patients. All significant network connectivity differences between the two groups were reduced in the female group compared with the male group (Fig. 4).
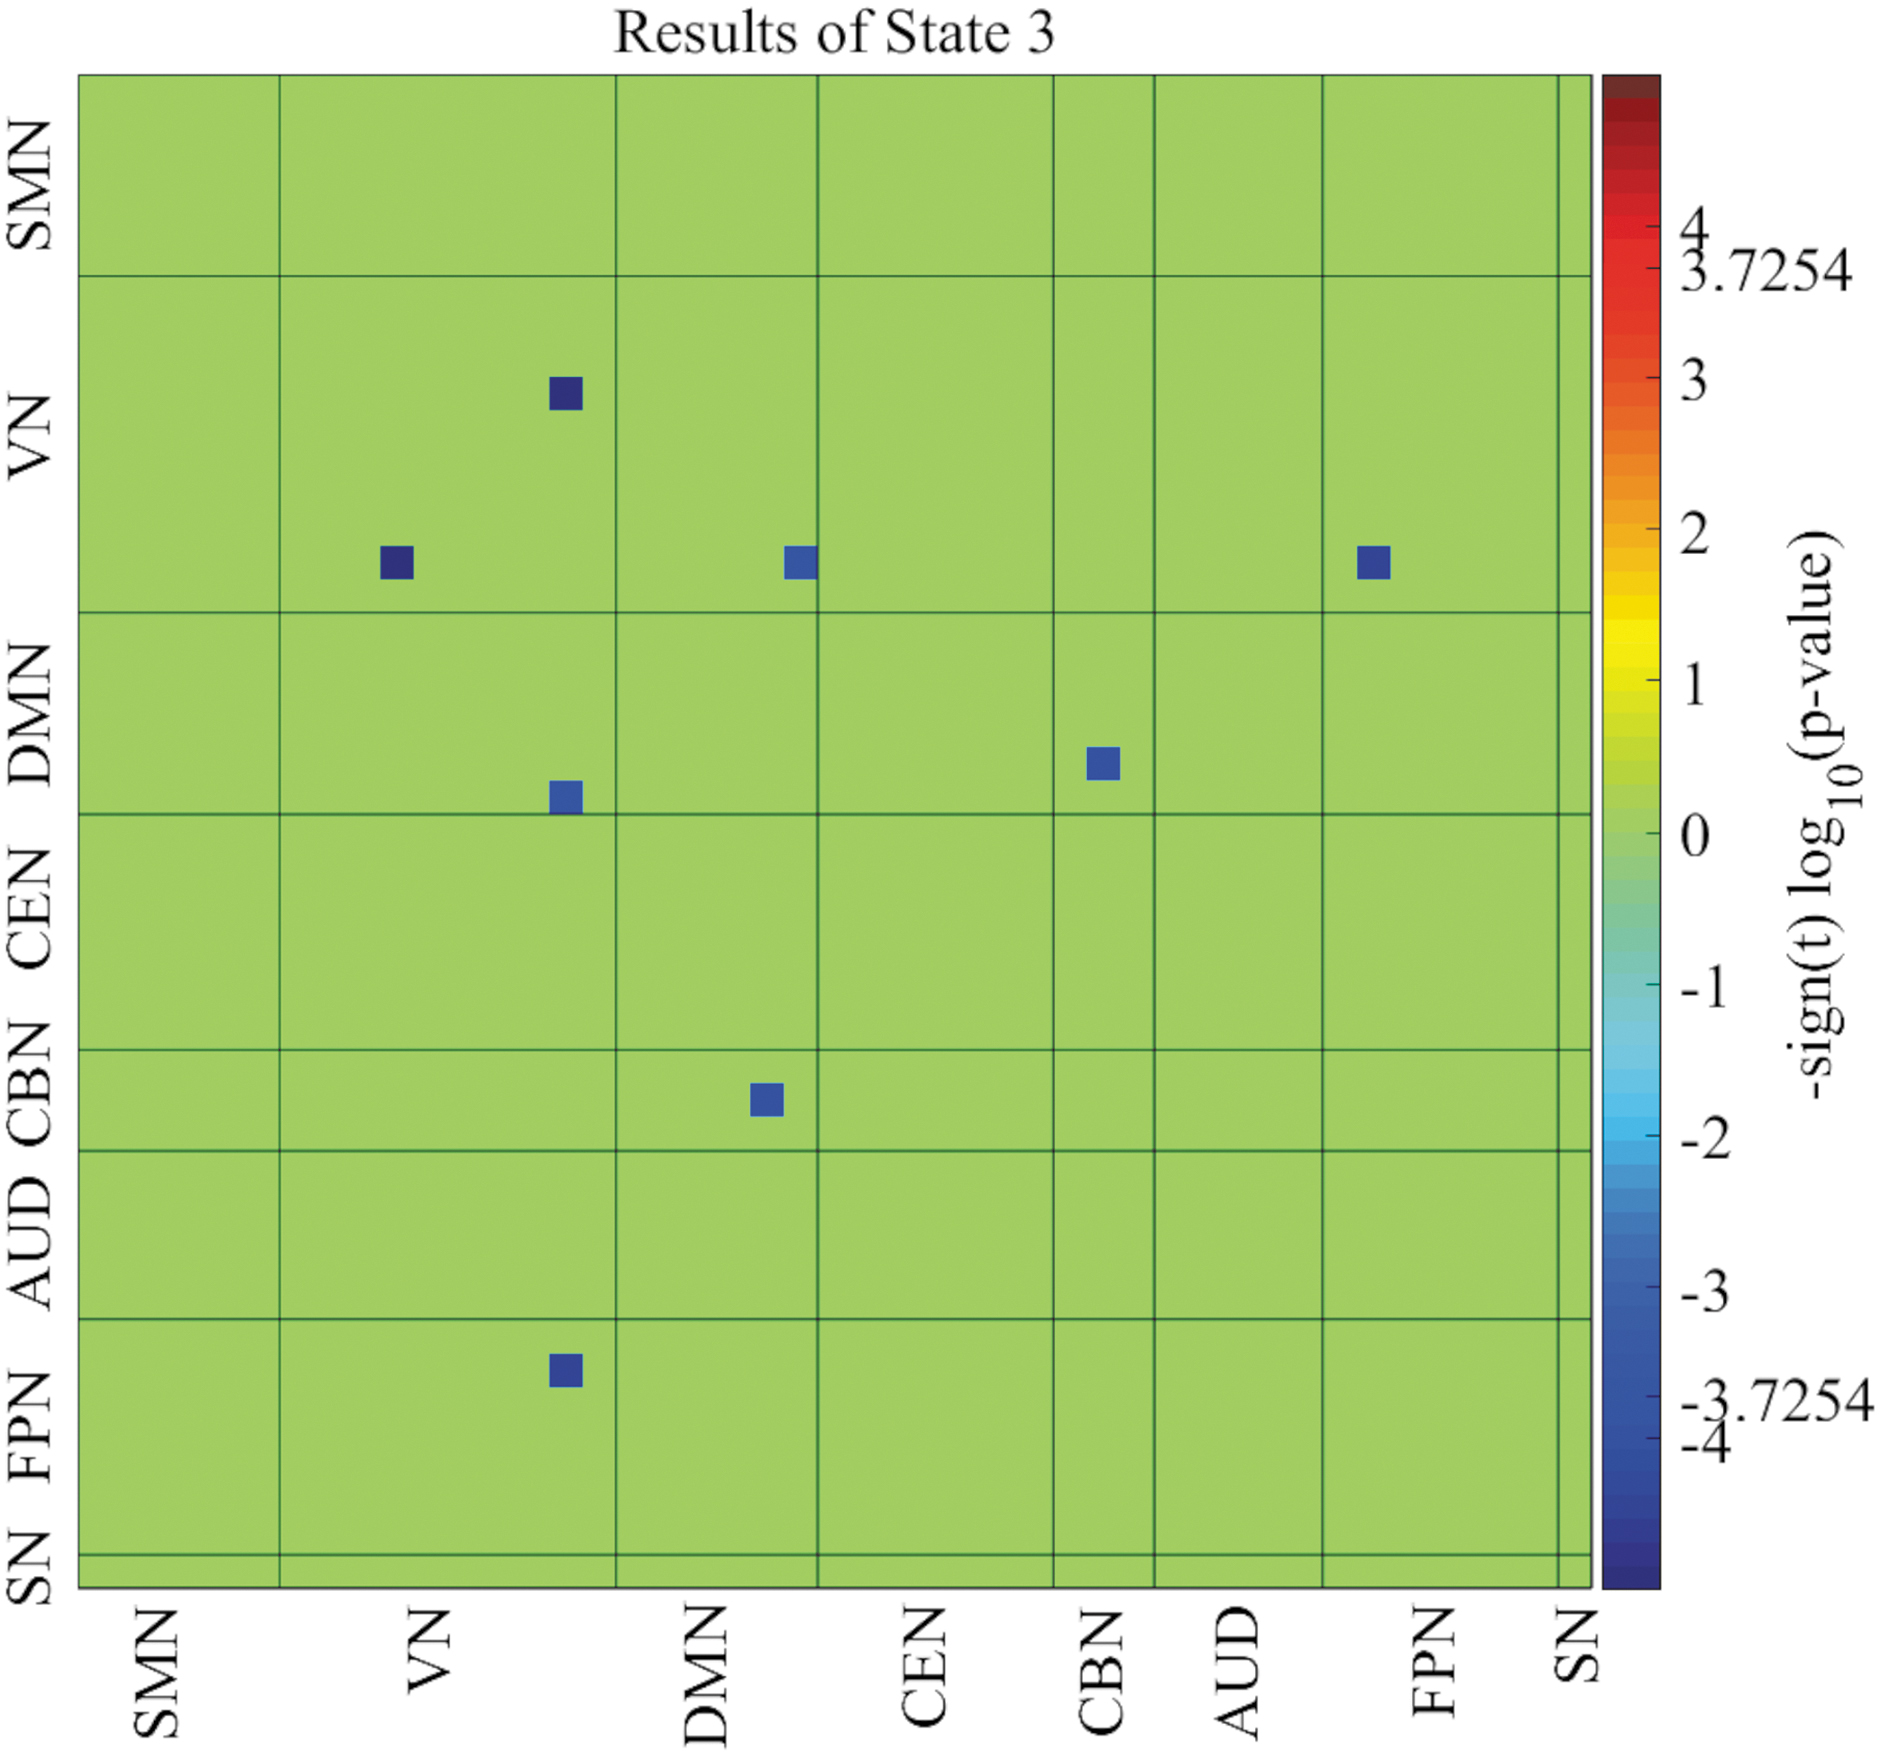
Network connectivity differences between female and male adult ADHD patients. Significant network connectivity differences between the two groups were observed in only state 3 (p < 0.05, FDR corrected). ADHD, attention-deficit/hyperactivity disorder; FDR, false discovery rate.
Fluidity measures
Two-sample t-tests were used to compare the FOT spent by each gender in each cluster state and the MDT each gender dwell in each of the four cluster states in both pediatric and adult groups (Fig. 5). Significant FOT differences were observed between female and male pediatric ADHD patients in states 3 and 4. Females showed the highest FOT in state 3 whiles males showed the highest FOT in state 4 (Fig. 5A). From Figure 5B, significant MDT differences were observed between the two groups in only state 4, with males showing a higher MDT in this state than their female counterparts. For the adult group, significant FOT differences were observed between female and male adult ADHD patients in state 3 (Fig. 5C). Also, significant MDT differences were observed between the two groups in only state 3 (Fig. 5D). Male adult ADHD patients showed high FOT and MDT in this state than female adult ADHD patients.
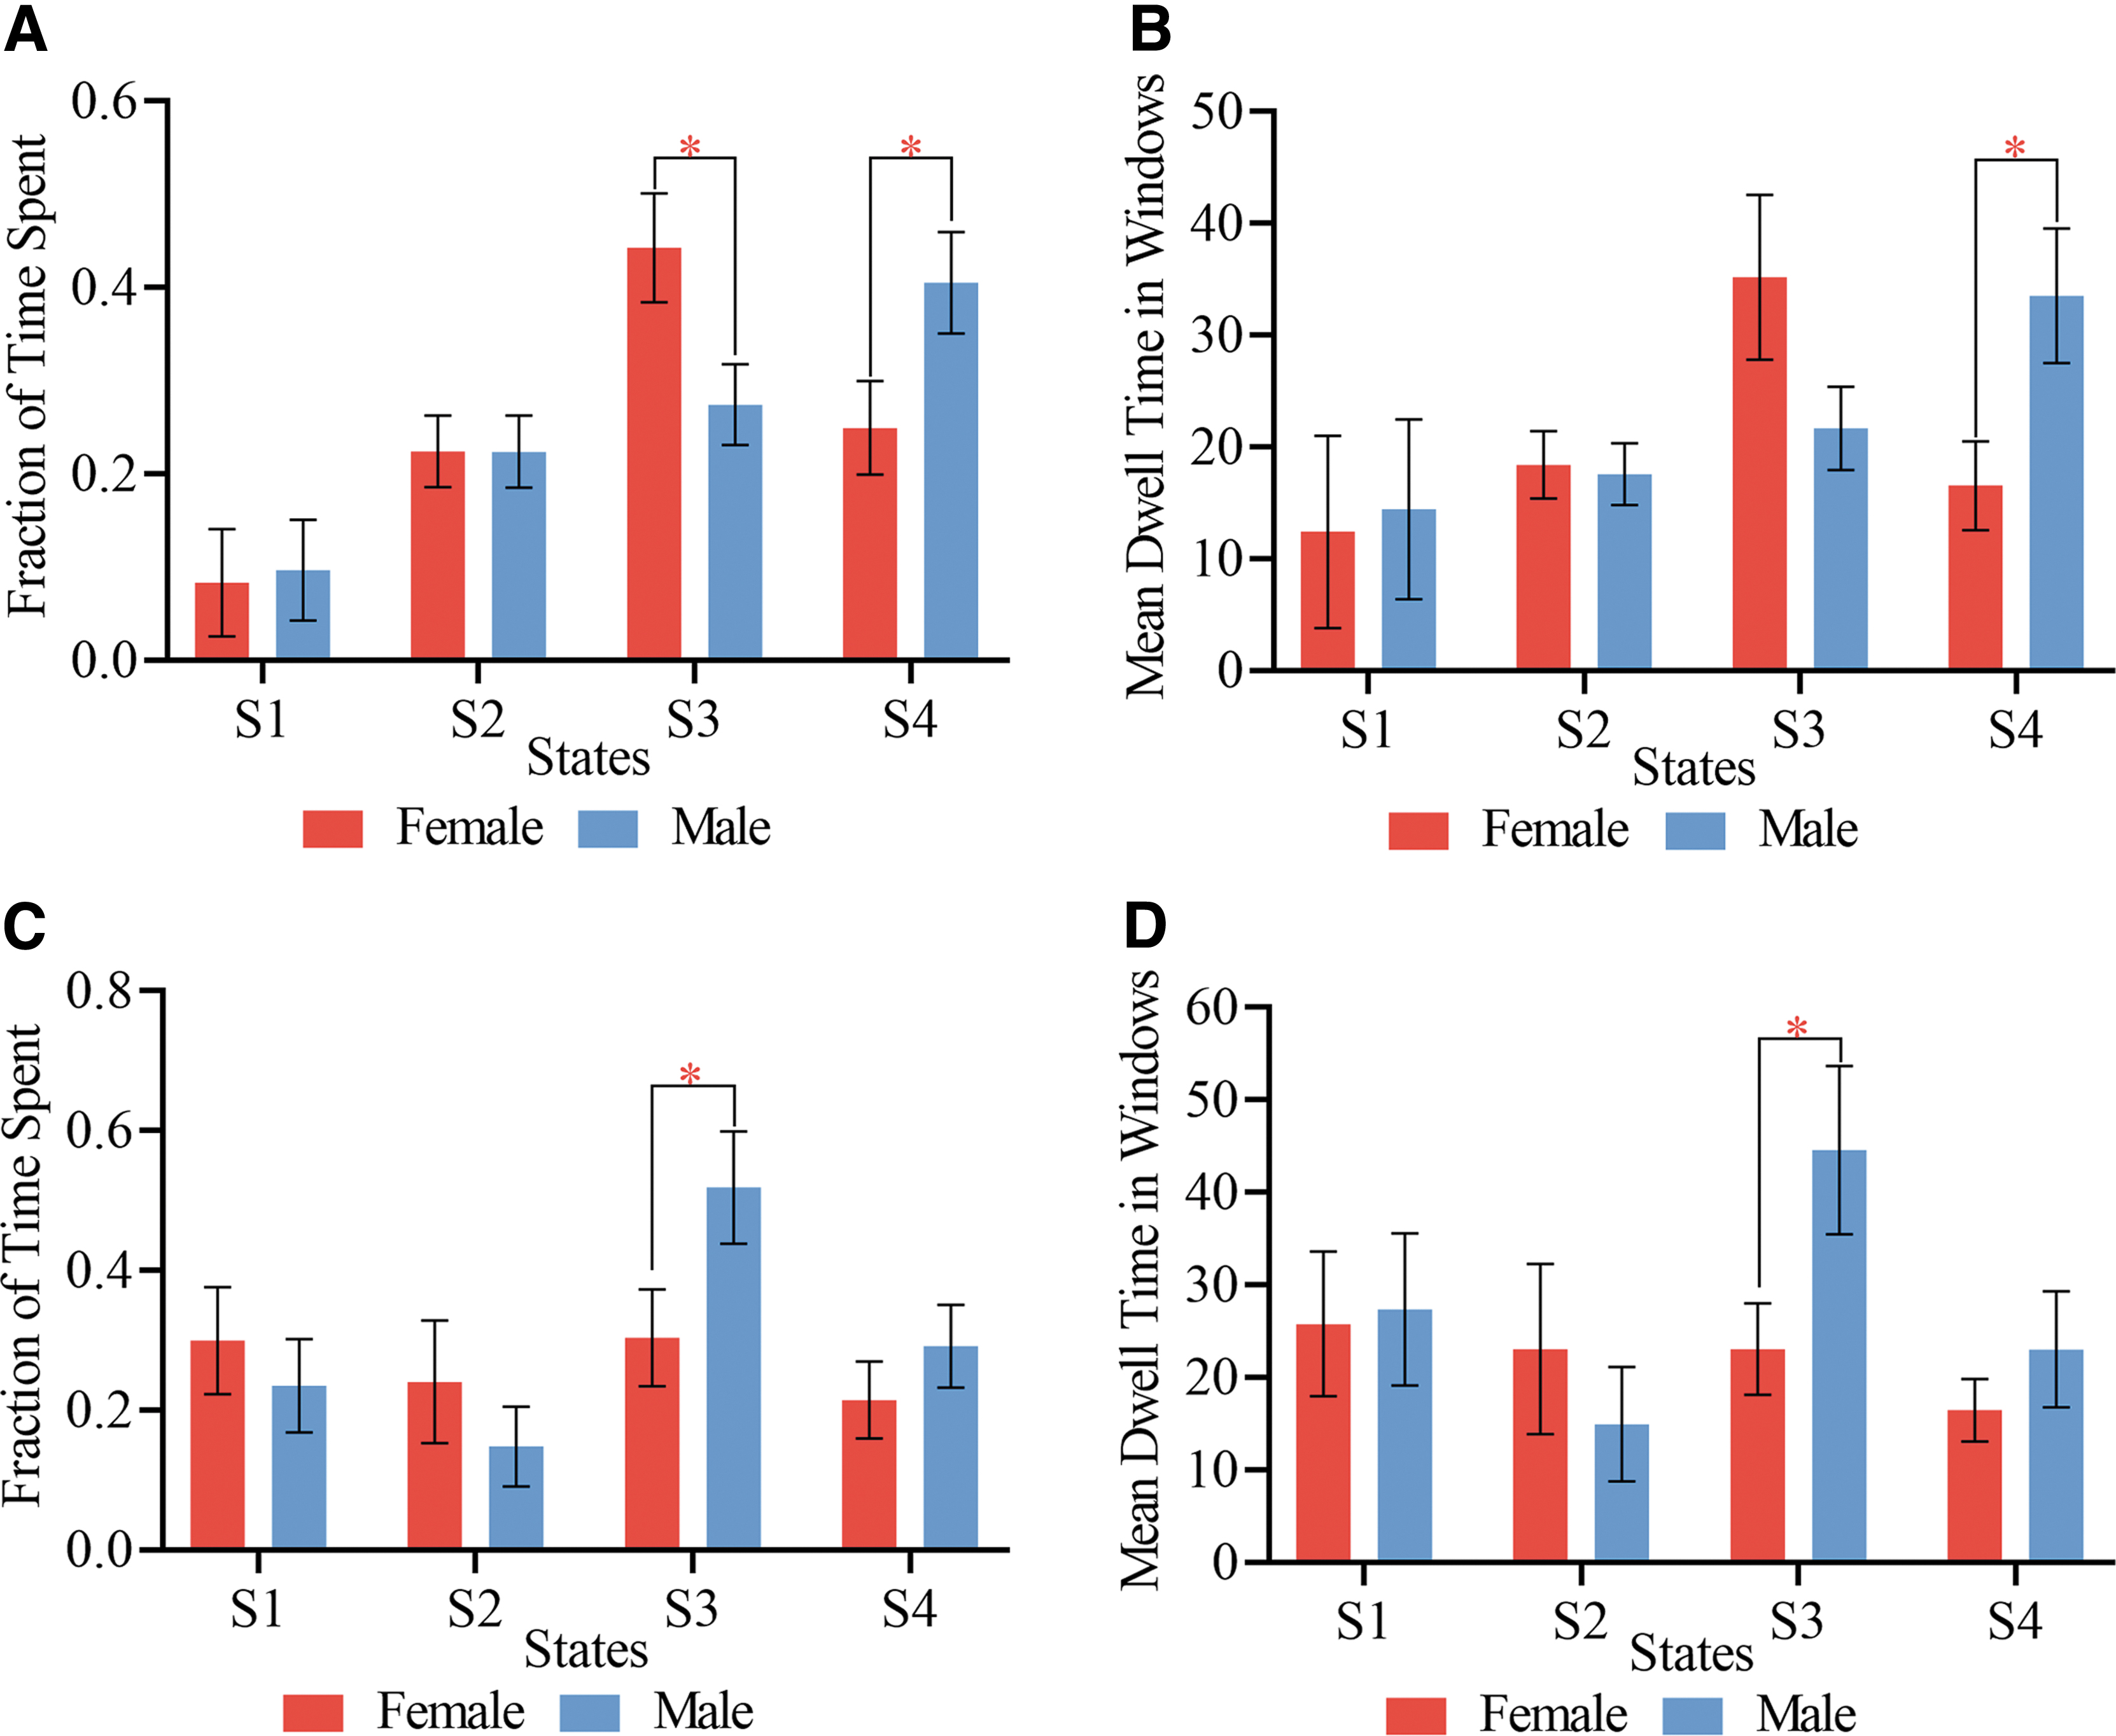
State vectors for temporal analysis.
The average transition matrices and transition probabilities of each gender in each age group are shown in Figure 6, reflecting the probability of moving from one state to another. The red squares along the main diagonals represent a high probability of remaining in a given state, that is, the lighter the red square, the higher the probability of remaining in a given state. The blue squares represent the probability of switching between states, that is, the lighter the blue square, the higher the probability of subjects switching between states. The deep red square in condition 1 (Fig. 6A, B) indicates a higher likelihood of both female and male pediatric subjects remaining in that particular condition. The light blue squares in the columns of states 4, 3, and 2 and the row of state 2 (Fig. 6A) indicate a high likelihood that female pediatric subjects will switch between these three states, with states 2 and 4 switching primarily to state 3. The light blue squares in the columns of states 3 and 4 and the row of state 2 (Fig. 6B) signify a high likelihood of male pediatric patients moving between these three states, moving mainly from states 2 and 3 to state 4.
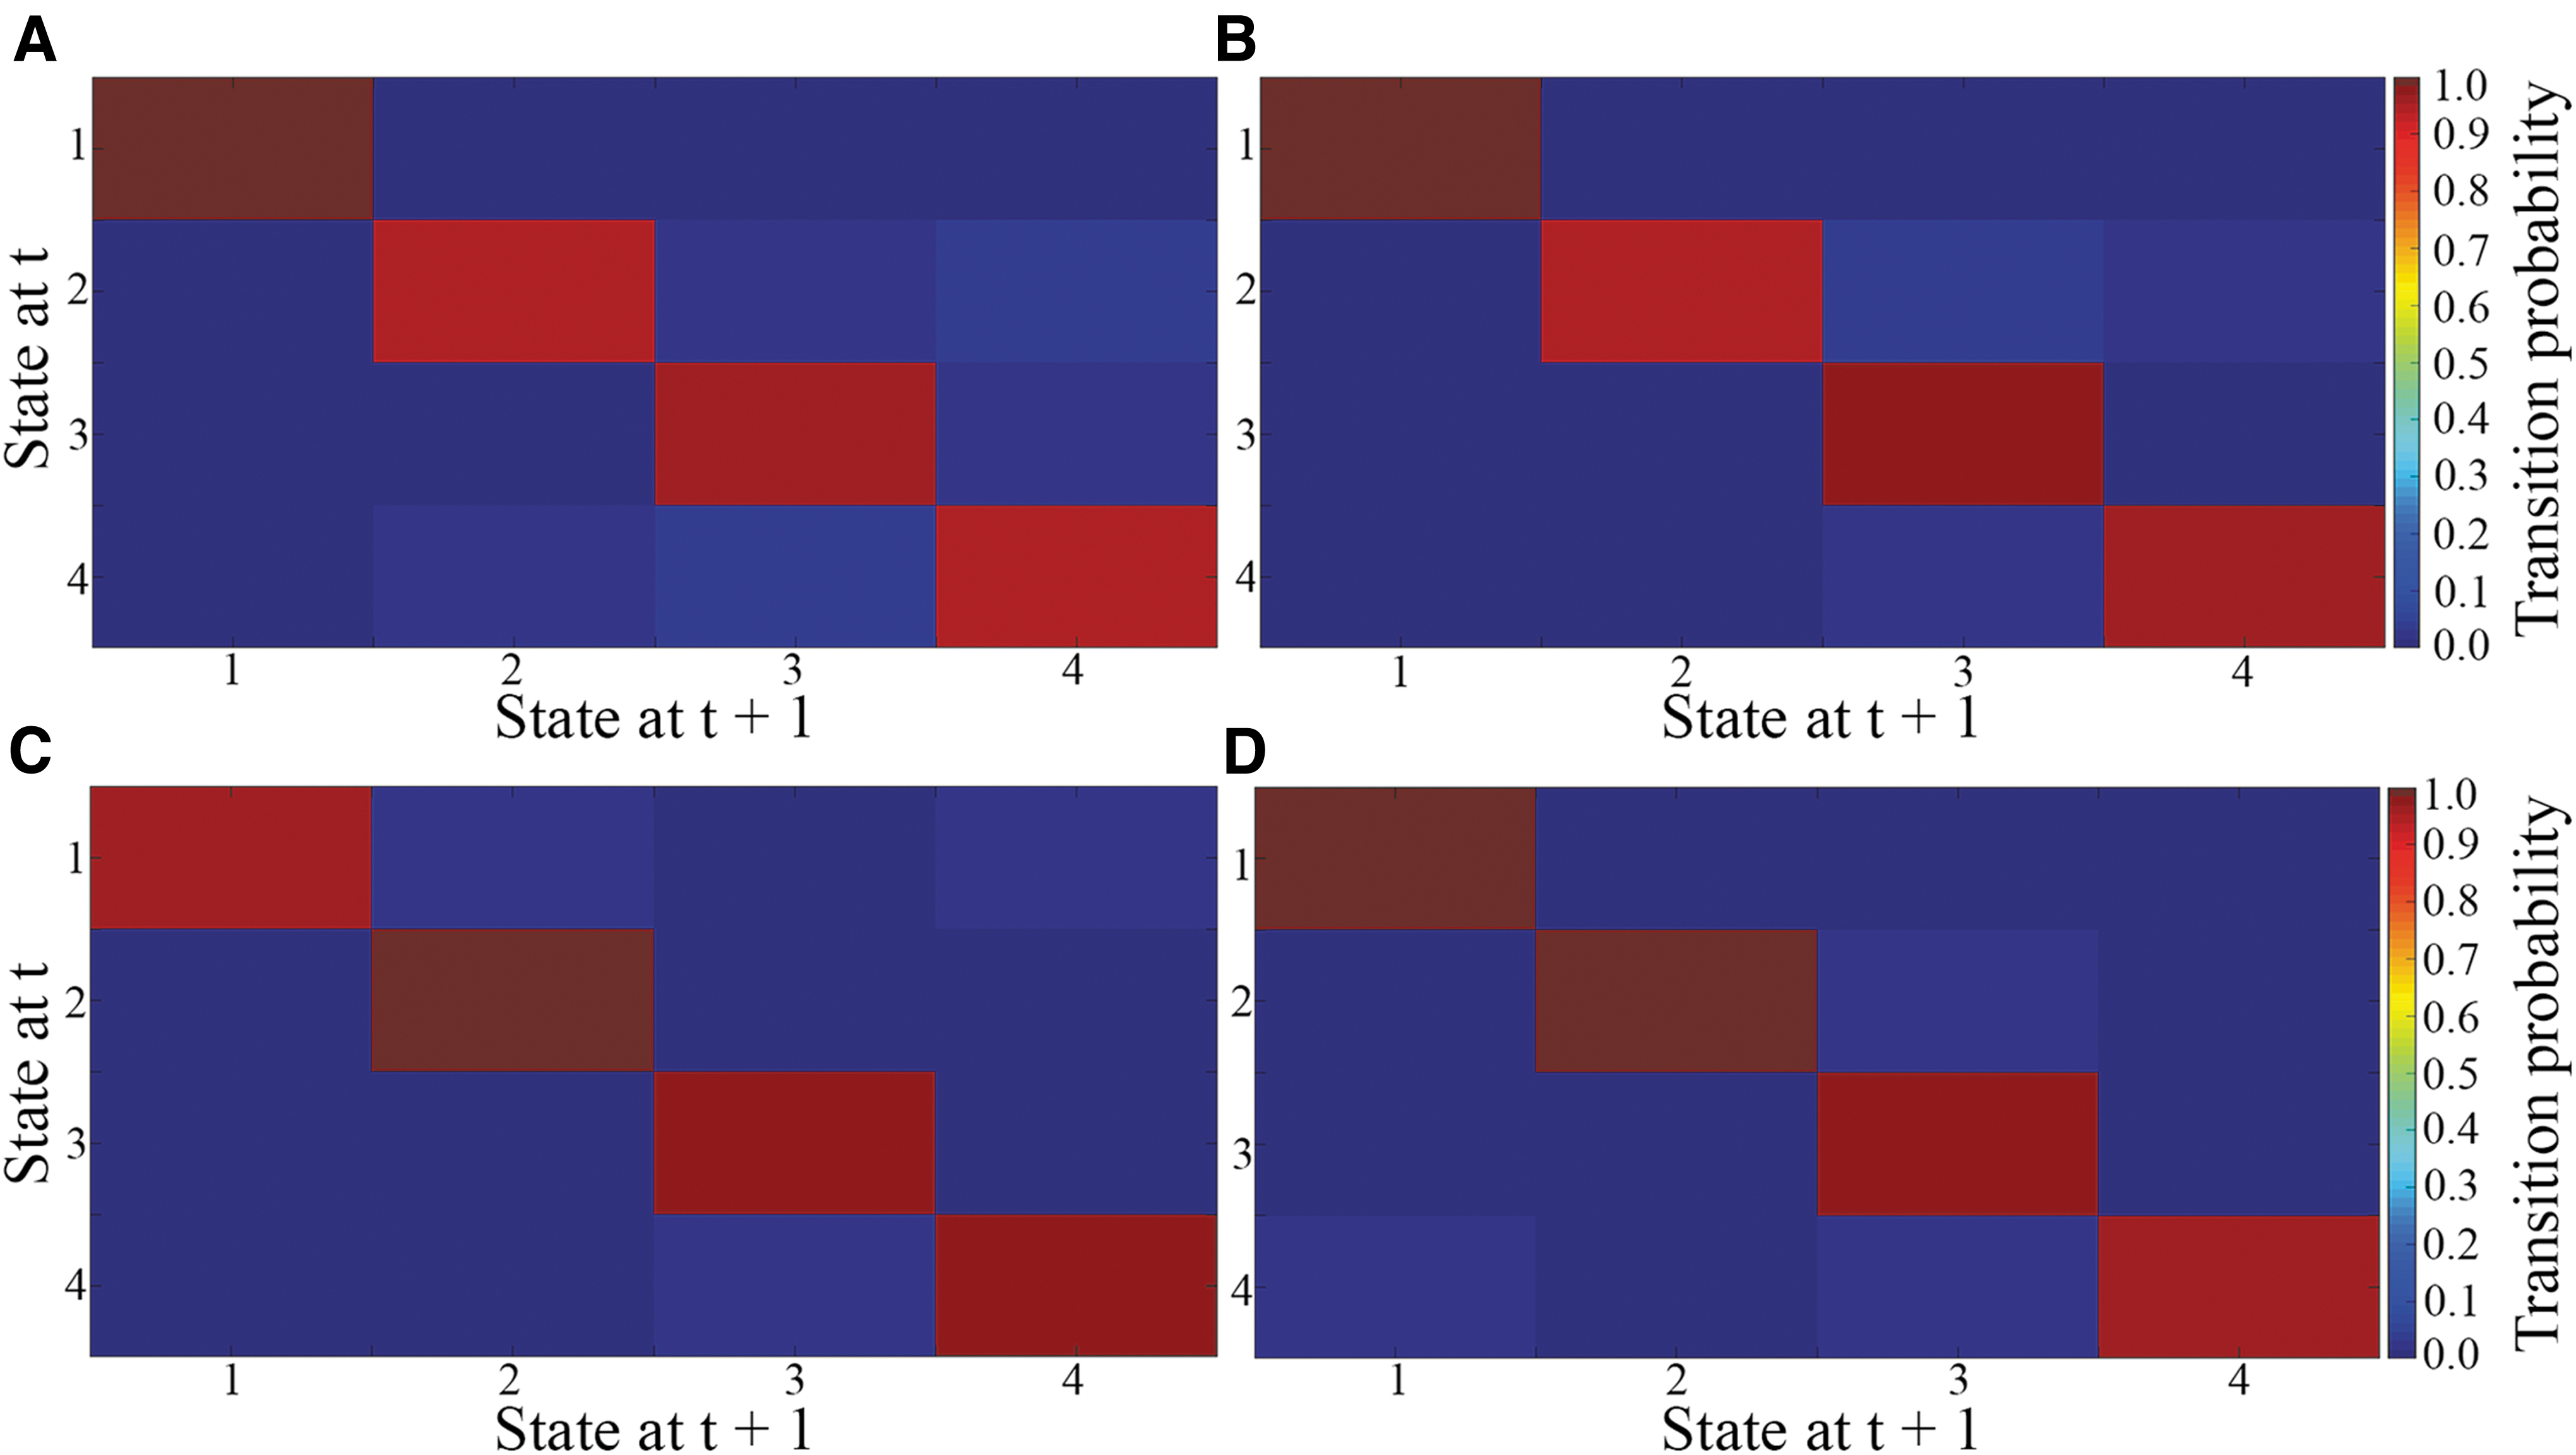
The average transition matrix and transition probabilities of each gender in each age group.
Female adult patients spent more time in states 1 and 3, with movement to these two states mainly from states 2 and 4 (Fig. 6C). The light blue squares in the column of state 3 and the row of state 2 indicate that adult male patients moved between these states, moving mainly from other states to state 3 (Fig. 6D).
Correlation analysis
To further investigate the impact of disease severity on FOT and MDT, we performed correlation analyses between these state vectors for each group in each state and overall ADHD severity, hyperactivity severity, and inattentive severity. Significant correlations were only found between FOT in state 4 and hyperactivity severity of the female pediatric group (Fig. 7).

Partial correlation between FOT spent in state 4 and hyperactivity severity in the female pediatric group.
Discussion
We investigated gender differences in time-varying FNC in pediatric and adult ADHD patients, respectively. Our results showed that: (1) there were significant gender network connectivity differences within the adult ADHD group; (2) males and females in both age groups showed similar dFNC states; however, for temporal state vectors, the pediatric group exhibited varying durations in states 3 and 4, in contrast to the adult group (state 3); and (3) FOT in state 4 of the female pediatric group associated significantly with hyperactivity severity.
Altogether, with previous findings (Agoalikum et al, 2021; Allen et al, 2014; Klugah-Brown et al, 2019), our findings provide complementary evidence of dFNC as a method to capture the time-varying characteristics of resting-state profiles of the brain. In the current study, connectivity within the VN was more robust in state 2 compared with the other three states in both age groups (Figs. 2B and 3B). Strong positive connectivity between the VN and SMN/DMN was found only in state 2 of the adult group (Fig. 3B), representing a link between lower-order networks. In a predictive study, Ritchie et al (2018) used multivariate pattern analysis to identify salient profiles, which showed sex differences in adult ADHD, particularly in both SMN and DMN. In this study, the connectivity between the VN and SMN/DMN may indicate the differences involved in attention between the sexes in the adult group.
There were no significant network connectivity differences between male and female ADHD patients across the four cluster states for the pediatric group. However, state vector analysis revealed significant differences between the two groups in FOT within states 3 and 4, and MDT in only state 4 (Fig. 5A, B). The female group mainly spent a significantly high FOT in state 3, while the male group spent significantly higher time in state 4 in both FOT and MDT. FOT in state 4 was negatively correlated with hyperactivity severity in the female group, signifying that the lesser the FOT spent in this state, the higher the hyperactivity severity (Fig. 7). The lack of significant differences in FNC also resonates with previous studies (Gaub and Carlson, 1997) and suggests developmental similarities among the sexes in the pediatric group. Moreover, in one study, the author used a continuous performance test to examine impulsivity and inattention between males and females with pediatric ADHD (Hasson and Fine, 2012); they found that while males exhibited more impulsiveness than females, there were no differences in inattention.
This suggests that the common underlying feature profound to both males and females is inattention, with specificity being impulsiveness, and reflects the pattern observed in this current work.
In contrast to female adults, we observed significant anticorrelation (Fig. 4), primarily between the lower-order and higher-order networks. This pattern suggested the dysfunctionality among these networks and reflects the core differences that existed between the genders in adult ADHD, which unlike in the children's group, there are underlying functional differences during the recovery stages in adulthood. Moreover, in an fMRI study, Valera et al (2010) investigated the brain activity of adult ADHD patients as they completed working memory tasks. Compared with same-sex controls, ADHD males showed lower brain activity than females. Furthermore, they found negative connections between hyperactive symptoms in men and inattentive symptoms in females, indicating that the sexes present differently (Valera et al, 2010).
Generally, these patterns were observed in the resting state as shown in the current study and may be an essential feature of adult ADHD. Functional studies have shown that the VN is an essential network of ADHD (Agoalikum et al, 2021; Benli et al, 2018); hence the reduced connectivity within the VN also suggests impaired visual attention in female adult ADHD patients relative to male adult ADHD patients.
Reduced associations of the VN with networks such as the DMN have been reported in a previous study (Sigi Hale et al, 2014). Atypical associations between DMN and inattentive ADHD symptoms were also demonstrated (Sigi Hale et al, 2014), suggesting that the reduced connectivity between the VN and DMN in the current study was potentially due to inattentive severity in the adult female ADHD group. Problem-solving, active maintenance and processing of information in working memory, and goal-directed behavior decisions are all controlled by the FPN (Menon, 2011). Decreased network connectivity between the VN and FPN suggests dysfunctional regulation in attentional and executive functioning in female adult ADHD patients. Relative to male adult ADHD patients, decreased network connectivity was observed between the DMN and CBN. The DMN is involved in decision making, episodic memory, social cognition, and emotional processing and has been disrupted (see the following studies Cortese et al, 2012; Hart et al, 2013). The CBN is involved in motor control (D'Angelo, 2011).
Several studies have shown the involvement of the cerebellum in ADHD, which is part of the cerebellar network (Agoalikum et al, 2021; Goetz et al, 2014). ADHD patients with higher inattention have been revealed to have a higher FC between cerebellar areas of the DMN (CerDMN) and regions of the visual and dorsal attention networks (Kucyi et al, 2015). Considering the functions of these two networks, the reduced FNC between them might imply disruptions in cognitive control and attentional mechanisms in ADHD patients, with these disruptions varying between female and male adult ADHD patients.
State vector analysis between male and female adult ADHD patients revealed significant differences between the two groups in FOT and MDT in state 3 (Fig. 5C, D), with the male group spending significantly higher time in both instances than the female group. Compared with the other cluster states in the adult group, state 3 had the highest percentage of occurrence and also showed significant FNC and state vector differences between the two groups suggesting that this state is related to gender differences in adult ADHD and associated with inattentive symptom severity as demonstrated in female ADHD patients (Li et al, 2019; Willcutt, 2012).
Overall, female ADHD patients dwelled significantly longer in state 3, whereas males spent much longer in state 4 of the pediatric group. Interestingly the pattern in the male pediatric group repeated in the adult group of state 4. Although not fully clear, this pattern suggests that male brain alteration and symptoms may persist longer than female from childhood into adulthood. Furthermore, linking the state vectors to the FNC, the anticorrelation resonated with the time spent in state 3 involving the VN and the DMN/FPN and could indicate the gradual switch of FPN and DMN, which might cause sex variations with respect to attention (Johnson and Bouchard, 2007).
Also, performance on attention-demanding activities would be controlled by the persistence of attention-related networks but are exhibited in a different state through their transitions, especially in the female group. This pattern may be responsible for male pediatrics showing patterns similar to adult males in state 4 of the state vectors. Moreover, the time spent in females is significantly associated with hyperactivity severity, but patterns were not consistent in both groups; this might indicate less persistence into adulthood comparable to male ADHD patients.
Even though we presented gender differences in dFNC among pediatric and adult ADHD patients, the result should be carefully interpreted. First, the sample size was a limitation in this study, as connectivity tends to be more stable with a more significant number of participants. Therefore, we suggest that future studies use larger sample sizes to determine dFNC gender differences among ADHD age groups. Second, child and adolescent ADHD patients were combined as pediatric in the current study due to insufficient female data. However, we could not determine whether one group is influencing the results or not; therefore, future gender studies should consider separating these two age groups to determine their gender differences.
Conclusion
In sum, this study investigated the dFNC of female and male ADHD patients using pediatric and adult fMRI datasets. Significant pediatric gender differences were found in only the state vectors (FOT and MDT). Reduced network connectivity within the VN, between the VN and DMN, VN and FPN, and between the DMN and CBN were observed in female adult ADHD patients relative to the adult male group. Also, significant FOT and MDT differences were observed between female and male adult ADHD patients in state 3. The findings in the current study imply abnormal dFNC in ADHD with respect to a broader age category. However, these abnormalities differ between male and female ADHD, especially in the adult group. Also, these differences might be due to the persistence of inattentive symptoms of female ADHD patients from childhood into adulthood. Overall, the present work highlighted the brain's dynamic properties captured through sliding window correlations. Given the dFNC gender differences observed among the two age groups, our work further provides insights into the resting-state network connectivity patterns in ADHD.
Footnotes
Acknowledgments
The authors would like to acknowledge Mr. Chen Shuai and all members of the brain connectivity laboratory for their support.
Authors' Contributions
H.W. and J.J. organized and preprocessed the data. E.A. performed the analysis. E.A. and B.K.-B. performed the statistical analysis and worked on the figures. E.A. wrote the first draft of the article. B.K.-B. and B.B. revised and wrote sections of the article. All authors read, contributed to the revision of the article, and approved the submitted version.
Author Disclosure Statement
No competing financial interests exist.
Funding Information
This work was supported by the National Natural Science Foundation of China (NSFC61871420, NSFC8221101268).
Supplementary Material
Supplementary Figure S1
Supplementary Figure S2
Supplementary Figure S3
Supplementary Figure S4
References
Supplementary Material
Please find the following supplemental material available below.
For Open Access articles published under a Creative Commons License, all supplemental material carries the same license as the article it is associated with.
For non-Open Access articles published, all supplemental material carries a non-exclusive license, and permission requests for re-use of supplemental material or any part of supplemental material shall be sent directly to the copyright owner as specified in the copyright notice associated with the article.