
Abstract
Introduction:
We are constantly estimating how much time has passed, and yet know little about the brain mechanisms through which this process occurs. In this pilot study, we evaluated so-called subjective time estimation with the temporal bisection task, while recording brain activity from electroencephalography (EEG).
Methods:
Nine adult participants were trained to distinguish between two durations of visual stimuli as either “short” (400 msec) or “long” (1600 msec). They were then presented with stimulus durations in between the long and short stimuli. EEG data from 128 electrodes were examined with a novel analytical method that identifies segments of sustained cortical activity during the task.
Results:
Participants tended to categorize intermediate durations as “long” more frequently than “short” and were thus experiencing time as moving faster while overestimating the amount of time passing. Their mean bisection point (during which frequency of selecting short vs. long is equal) was closer to the geometric mean of task stimuli (800 msec) rather than the arithmetic mean (1000 msec). In contrast, sustained brain activity occurred closer to the arithmetic mean. The recurrence rate of this activity was highly related to the bisection point, especially when analyzed within naturally occurring theta oscillations (4–8 Hz) (r = −0.90).
Discussion:
Sustained activity across the cortex within the theta range may reflect temporal durations, whereas its repeated appearance relates to the subjective feeling of time passing.
Impact statement
In this study, we identify sustained and recurring cortical activity while evaluating the amount of time passing. These findings enhance our understanding of neural processes we use to calculate and estimate how much time we feel has passed.
Introduction
Our brains are constantly traveling in time, either when thinking about the past or predicting the future, as well as when bringing back memories of our life (e.g., Eichenbaum, 2014; Tulving 1983). As such, we are always estimating time, both real (i.e., objective) time and the amount of time we feel has elapsed. The later form, referred to as “subjective” time, is more fluid than real time and changes with internal states. For example, time can feel as if it is moving slower while paying attention (Liu et al., 2015), when depressed (Angrilli et al., 1997; Droit-Volet and Gil, 2009; Droit-Volet and Meck, 2007; Droit-Volet et al., 2013), or when comparing memories from the distant past (Levy et al., 2015).
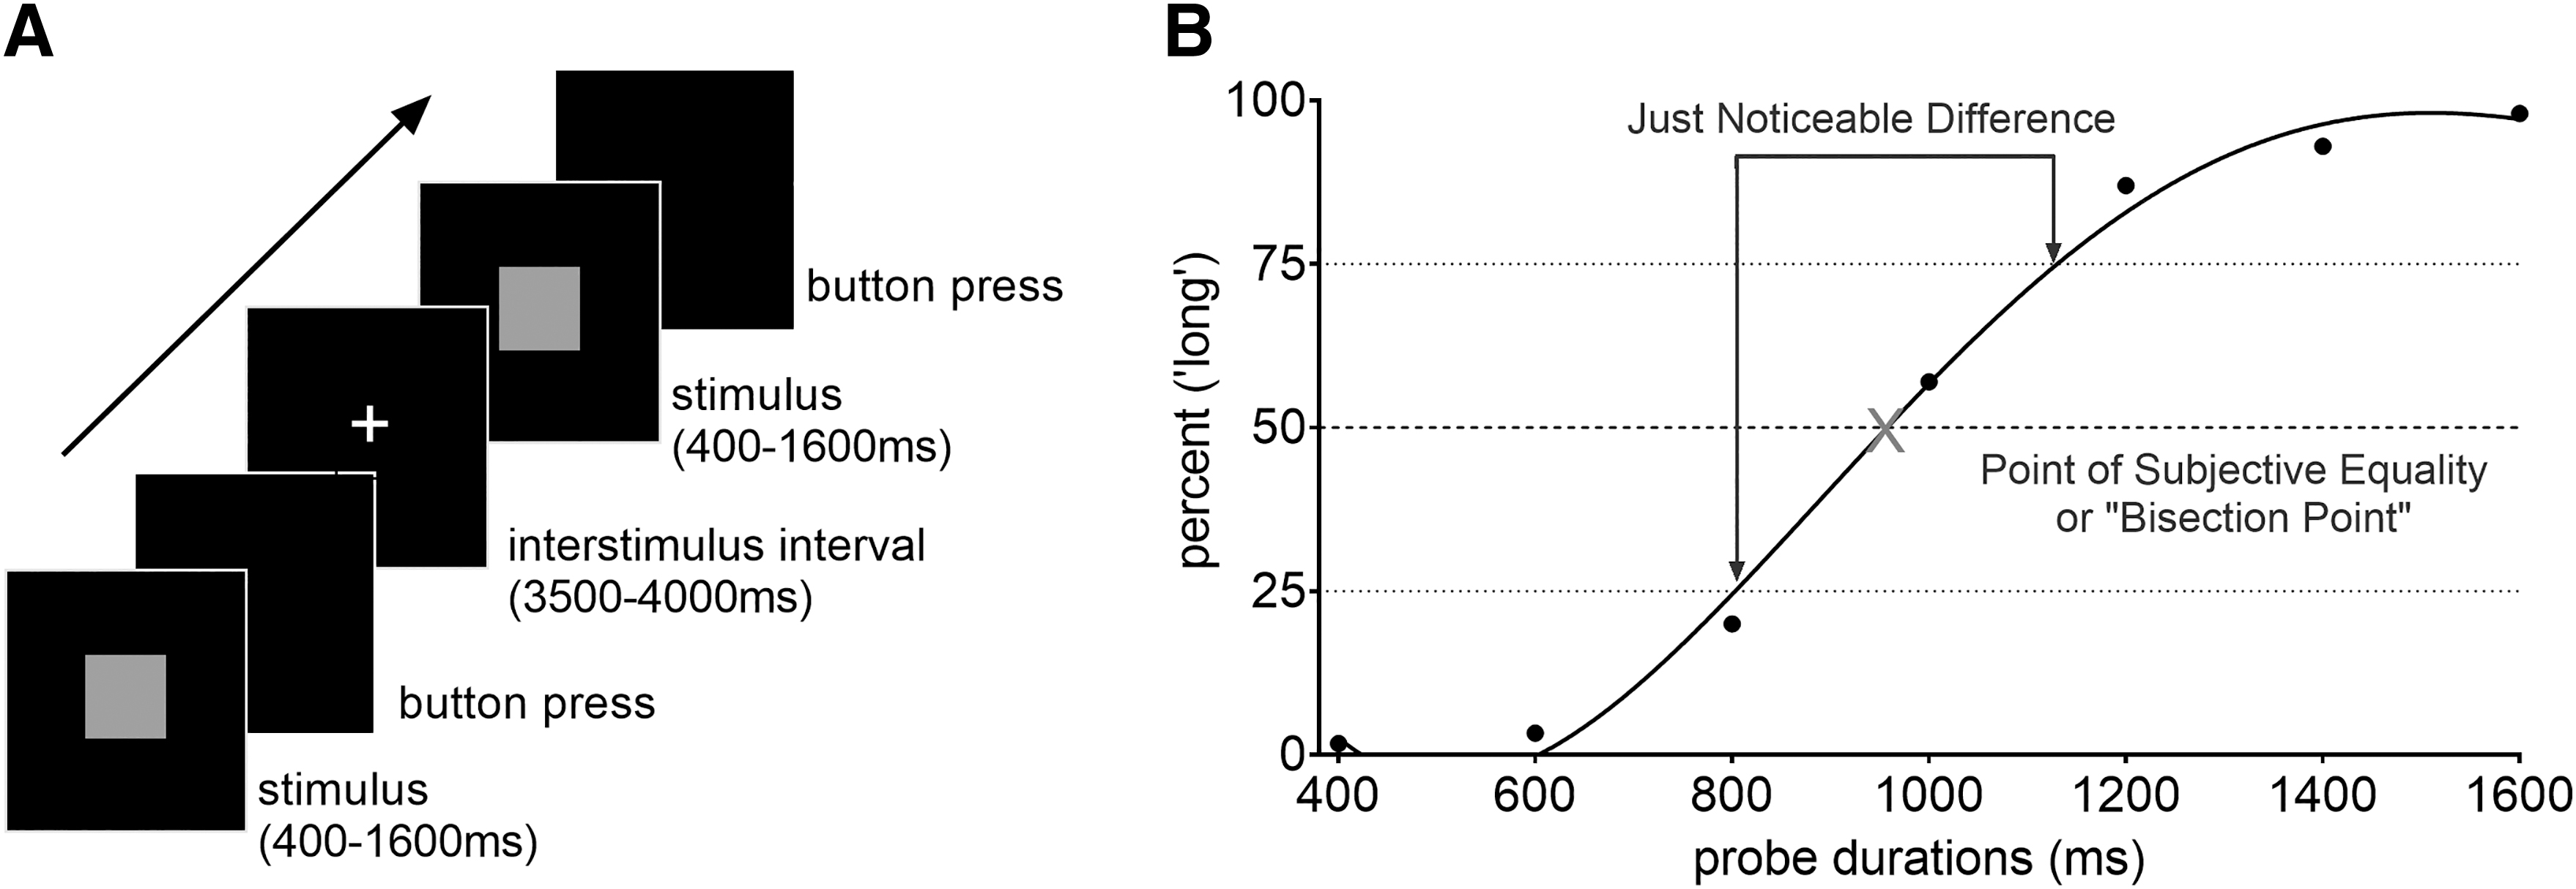
Subjective time estimation is often examined with the temporal bisection task (Allan and Gibbon, 1991). In a typical experiment, participants are presented with two anchor stimuli (which can be auditory or visual) that differ in temporal duration and are easily perceived as distinct. After learning to distinguish the two anchor durations as “short” or “long,” participants are then presented with probes at durations in between the anchors as well as the anchors themselves, and asked to classify each probe stimulus as “short” or “long” with a button press (Fig. 1). As the probes become closer together in time, it is more difficult to tell them apart.
Subjective time is inferred from the point of subjective equality or “bisection point,” which is the duration when a person is responding “short” or “long” with equal frequency. This point varies across individuals but is presumed to correspond to a person's internal clock, as described by various models of timing (Ghaderi et al., 2018; Gibbon, 1977; Karmarkar and Buonomano, 2007).
In this study, we present a novel procedure for analyzing electroencephalography (EEG) data during the temporal bisection task. This procedure, known as temporal segmentation, relies on a source-informed segmentation algorithm to detect changes in the spatial distribution of cortical activity, using information acquired from all EEG channels simultaneously (Haddad and Najafizadeh, 2019). It is hypothesized that changes in sustained activity reflect changes in functional networks across brain regions. The procedure segments the EEG data into time intervals during which the spatial distribution of cortical activity remains quasistationary. Importantly, this procedure does not detect changes in specific regions, but rather identifies changes within and across the cortex.
We hypothesized that sustained neurophysiological activity would relate to the subjective sense of time passing, as estimated by an individual's bisection point. We further hypothesized that sustained activity would occur most often when it was most difficult to categorize the probe stimuli as either short or long.
Endogenous oscillations are implicated in mechanisms of time estimation (e.g., Buhusi and Meck, 2005; Buzsáki, 2006; Gu et al., 2015) although not necessarily the feeling of time passing. In this pilot study, we analyzed sustained activities from the EEG response in different frequency bands and then related those changes to an individual's subjective estimation of time, as measured with the temporal bisection task. We selected theta and delta bands because both are associated with learning temporal characteristics and stimulus order (Crivelli-Decker et al., 2018; Fuentemilla et al., 2014; Johnson et al., 2019; Ranganath and Hsieh, 2016; Roberts et al., 2018; Roberts et al., 2013).
Beta oscillations are associated with the estimation of temporal durations in the minutes range (Ghaderi et al., 2018), but because our stimuli were much shorter, we did not include them in our analyses. Alpha waves (8–12 Hz) have not been associated with the subjective estimation of time, at least to our knowledge and as such, were used to determine the selectivity of one range versus another.
Materials and Methods
Participants
Twelve right-handed young adult women were recruited for the research study (n = 12, M age = 22 years, range 18–33 years). Data from three subjects were omitted due to noise, leaving a final sample size of nine for analyses. After providing informed consent, participants completed the temporal bisection task during EEG recordings. The study was carried out in accordance with the Declaration of Helsinki and approved by the Institutional Review Board at Rutgers University. Experiments were undertaken with the understanding and written consent of each participant.
Behavioral bisection point task
The temporal bisection task was constructed in E-Prime (Psychology Software Tools, USA). Participants were trained to discriminate between two different time durations presented as a bright blue square on a black computer screen (Fig. 1A). The durations were “short” (400 msec) or “long” (1600 msec), and the participants were instructed to press “z” or “m,” respectively, following each presentation. (The letter is irrelevant and purposely meaningless.) Each button press was followed by feedback as to whether the choice was correct. There were 12 training trials, 6 per anchor. After learning to distinguish the intervals, 54 randomized trials were presented of intermediate probe durations (600, 800, 1000, 1200, and 1400 msec) and the short and long anchors for 11 blocks or 594 total test trials. (Three participants were presented with 540 test trials during a prior version of the experimental procedure.)
The anchor stimuli were presented 12 times along with 6 presentations of each intermediate probe duration per block. The interstimulus interval was generated randomly between 3 and 4.5 sec. Participants were not informed about the length of the probes and did not receive feedback during test trials.
Behavioral analyses
Individual behavioral data from the temporal bisection task were plotted as the proportion of long responses (y-axis) across stimuli durations (400–1600 msec, on the x-axis) and fitted to a fourth-degree polynomial curve. A prior pilot study (n = 99) of the temporal bisection task indicated that the fourth-degree polynomial curve was the best fit as determined by minimum mean squared error (data unpublished). Each person's point of subjective equality (or bisection point) and just noticeable difference (measure of temporal sensitivity) were calculated from the curve of best fit (see Fig. 1B for representational data from one participant). The bisection point was calculated as the time when a person responded “short” (closer in time to 400 msec) or “long” (closer in time to 1600 msec) with equal frequency, that is, 50% (Wearden, 1991).
The geometric mean of the stimulus durations was 800 msec and the arithmetic mean was 1000 msec with the probe trials spaced every 200 msec between 400 and 1600 msec. The just noticeable difference was computed according to Weber's ratio as the proportion of long responses at 75% minus the proportion of long responses at 25% over the proportion of long responses at 50% (bisection point). Smaller difference thresholds indicate greater temporal sensitivity.
EEG data acquisition and preprocessing
EEG data were collected at a sampling rate of 1000 samples/sec, with a 128-channel ActiCap (Brain Vision, Morrisville, NC, USA) arranged in accordance with an extended version of the 10–20 international system. Electrically conductive gel was applied to 128 electrodes attached to a skull cap fitted to the participant's head circumference. Before analysis, the raw signal was processed using EEGLAB (Delorme and Makeig, 2004). EEG data were downsampled to 500 samples/sec and filtered using a band-pass finite impulse response filter with low and high cutoff frequencies of 1 and 50 Hz, respectively. EEG trials were then epoched by extracting [0–2000] msec poststimulus onset intervals. Major artifacts related to eye blinks and muscle activities were removed using independent component analysis (Hyvarinen and Inki, 2002). Noisy channels were visually identified and their activity was substituted by spatial interpolations of the neighboring channels using EEGLAB.
Each EEG signal was decomposed into frequency bands of delta (0.5–4 Hz), theta (4–8 Hz), and alpha (8–16 Hz) with 6-level stationary wavelet transform and reconstructed in the three lowest bands. We used the orthogonal Daubechies tap 4 (Db4) kernel to best-tune the wavelet decomposition to the underlying cortical activity patterns, while permitting perfect subband reconstruction (Glassman, 2005). In addition, we probed the brain response captured by the nondecomposed EEG data, spanning the entire 0.5–50 Hz spectrum.
EEG data processing
EEG trials were temporally segmented using the source-informed segmentation algorithm, separately for each frequency band, as well as for the nondecomposed signal (Haddad and Najafizadeh, 2019). Briefly, the source-informed segmentation algorithm identifies segments in EEG data during which the spatial distribution of cortical activity remains quasistationary. We begin with the known EEG model,
where
where
The algorithm monitors the changes in the most significant left singular space of the EEG data matrix,
Segmentation analyses
The source-informed segmentation was applied to EEG data for each participant, which yielded temporal segments for each stimulus and each trial. This was achieved using the Source-Informed Segmentation Plugin for Brainstorm (Haddad, 2020). The algorithm identifies segments in EEG data during which the spatial distribution of cortical activity remains quasistationary. We hypothesized that theta and delta, but not alpha, would correlate with behavioral indices of time estimation (measured as the bisection point).
To test these hypotheses, first, we identified when in time the segments occurred for each stimulus presentation in the absence of stimulus change (i.e., following stimulus onset and before stimulus offset). Second, we identified the longest segments of sustained activity. Third, we determined the extent to which the longest segments were recurrent across trials (defined here as the recurrence rate). Finally, we measured the association between the timing and recurrence rate of the longest segments with respect to the behavioral bisection point.
The timing (onset and midpoint) and duration of the segments were calculated to determine whether the longest segments related to subjective timing within individual participants. In addition, we assessed the stability of those responses across trials for each stimulus presentation. The EEG response during the 1200 msec stimulus was chosen for further analyses because it was not contaminated by the visually evoked response to the offset of the stimulus, which would occur with the shorter stimuli. A time window of 500 to 1500 msec, again only for trials of the 1200 msec stimulus, captured a range of segments across stimulus presentations. The segments varied in length, with the boundaries of the segments occurring across time and representing shifts in the brain's functional state.
The recurrence rates of the onset and the midpoint of the longest segment across all trials were calculated as the number of times a segment onset or midpoint, respectively, occurred within a specific time bin over total number of trials. These rates were calculated for the nondecomposed signal as well as for each frequency band. The recurrence rate was normalized and represented as a percentage. Recurrence rates of the onset and midpoint of the longest segment corresponding to the 1200 msec stimulus for the nondecomposed signal, as well as for each frequency band individually, were plotted as histograms.
Statistical analyses
The Shapiro–Wilk test for normality is recommended for small sample sizes (Patrício et al., 2016; Shapiro and Wilk, 1965). Results from this test indicated that data on the bisection point (p = 0.48) and just noticeable difference (p = 0.58) were not significantly different from normality, nor were recurrence rates for 600 msec (p = 0.83), 1000 msec (p = 0.94), or 1400 msec (p = 0.92) significantly different from normality. Thus, parametric tests were considered appropriate.
Statistical tests were performed using IBM SPSS Statistics. Pearson's correlations were performed between the behavioral bisection point and the segment characteristics (onset, midpoint, and duration). Analyses of variance (ANOVAs) were performed with the recurrence rate as the dependent variable and time bin and frequency band (alpha, theta, and delta) as independent variables. ANOVAs were applied to data from three time bins: 500–700 msec (centered on 600 msec), 900–1100 msec (centered on 1000 msec), and 1300–1500 msec (centered on 1400 msec). In this way, we were able to estimate the number of times that the longest segments (indicating a longer state of sustained activity) occurred during the time intervals: around the task midpoint (1000 msec) compared with the beginning (600 msec) or end (1400 msec) of the intermediate stimulus durations.
A corrected alpha threshold of 0.003 (0.05/15) was applied to account for multiple comparisons across time bins and frequency bands.
Results
Behavioral measures of subjective timing
The bisection point was estimated by calculating the time point when a participant indicated the stimulus was “long” for 50% and “short” for the other 50% of the trials. The mean bisection point was 784 msec (SE = 48 msec, n = 9), and ranged from 579 to 985 msec. It was thus closer to the geometric mean of the stimulus durations (i.e., 800 msec) than the arithmetic mean (i.e., 1000 msec), suggesting a tendency to respond “long” rather than “short” (Kopec and Brody, 2010). Participants with a bisection point shorter than 800 msec (the geometric mean) overestimated the length of temporal durations more frequently (responding “long” more than “short”) compared with participants with a bisection point longer than 800 msec, who experienced time as moving slower. Means and standard errors of temporal estimates were calculated for each probe duration.
Coefficients of variation (ratio of standard deviation to the mean) were calculated to determine the relative standard deviation of estimates for each probe duration. Coefficients of variation ranged from 1.40 for 400 msec to 0.18 for 1000 msec to 0.03 for 1600 msec, indicating a greater degree of relative variability at shorter versus longer durations. Participants were highly likely to categorize the longer durations as “long” (mean: 96%, standard error: 1%) and fairly likely to categorize the shorter durations as “short” (mean: 78%, standard error: 5%). As expected, variance was highest for the intermediate durations (600, 800, and 1000 msec) because these were more difficult to discriminate as either “short” or “long.”
The mean just noticeable difference, which is a measure of temporal sensitivity, was 451 msec (SE = 20 msec) and ranged between 361 and 534 msec. That is, on average, the minimum duration of time necessary for participants to perceive two durations as distinct was 451 msec. The bisection point did not relate to the just noticeable difference thresholds within individuals, p > 0.05, indicating that subjective time was not associated with temporal sensitivity.
Neural correlates of subjective timing
EEG data were segmented into intervals of sustained spatial patterns of cortical activity (Fig. 2). The onset, midpoint, and duration of the longest segments were calculated for each participant, focusing on the 66 trials of the 1200 msec stimuli. The mean onset of the longest segments was 916 msec (SD = 26 msec), the midpoint was 999 msec (SD = 26 msec), and the duration was 166 msec (SD = 19 msec). Pearson correlations were performed between the onset and midpoint of the longest segment (in milliseconds) and behavioral bisection point. Neither the onset nor the midpoint of the long segment correlated with the behavioral bisection point across individuals, p > 0.05.

Representative data from three subjects indicating individual differences in temporal segmentation of ERPs for theta oscillations during the 1200 msec stimulus of the temporal bisection task during the longest identified segment (shaded in gray) (at left), and corresponding brain maps of segment-wise average activity during the longest segment (at right). At the center, behavioral data plotted as the proportion of long responses (calculated as a percentage) by stimulus duration (400–1600 msec).
We tested whether the longest segments were more likely to occur around the arithmetic mean (1000 msec) compared with earlier (600 msec) or later (1400 msec) time bins, and concurrently, whether the timing of the long segment was recurrent across trials using ANOVAs. There was a significant main effect of time, F(2,48) = 96.52, p < 0.0001, which indicated the recurrence rates at 600, 1000, and 1400 msec for the nondecomposed signal differed from one another (Fig. 3A). Post hoc analyses revealed that the recurrence rate at 1000 msec (M = 15.96, SE = 0.50) significantly differed from the recurrence rate at 600 msec (M = 8.30, SE = 0.47, p < 0.001) and the recurrence rate at 1400 msec (M = 7.19, SE = 0.40, p < 0.001). Recurrence rates at 600 and 1400 msec did not significantly differ from each other (p > 0.05).

These results suggest that the longest segment of cortical activity arose ∼1000 msec after stimulus onset, which was the midpoint of all stimulus durations (arithmetic mean).
Endogenous oscillations and behavioral bisection point
We tested for interactions between subjective time estimation (the bisection point) and sustained activity during three frequency bands. A significant interaction [F(4,48) = 16.63, p < 0.0001] suggested that the recurrence rate across time depended on the frequency band. Post hoc analyses revealed that within the theta band, the recurrence rate around 1000 msec significantly differed from both the recurrence rate around 600 msec (p < 0.001) and the recurrence rate around 1400 msec (p < 0.001) (Fig. 3C). Within the alpha band, the recurrence rate around 1000 msec also significantly differed from the recurrence rate around 1400 msec (p = 0.001), but not from the recurrence rate around 600 msec (p = 0.05). Within the delta band, the recurrence rate around 1000 msec significantly differed from both the recurrence rate around 600 msec (p < 0.001) and the recurrence rate around 1400 msec (p < 0.001).
Analyses indicated a main effect of frequency band, F(2,24) = 7.95, p < 0.01. Post hoc analyses revealed that the recurrence rate in the delta band (M = 9.19, SE = 0.40) significantly differed from the recurrence rate in the alpha (M = 11.15, SE = 0.40, p < 0.01) and theta (M = 11.11, SE = 0.40, p < 0.01) bands, regardless of the temporal duration of the stimulus. The recurrence rate for alpha and theta bands did not significantly differ from each other (p > 0.05).
The bisection point was highly correlated with the recurrence rate of the longest segments at the midpoint (1000 msec) within theta frequencies r = −0.90, p = 0.001 (Fig. 3B). These data suggest that individuals who had shorter bisection points and were overestimating the duration of the stimuli produced more long EEG segments around the arithmetic mean (1000 msec) and these segments were associated with theta rhythms. In contrast, the behavioral bisection point did not correlate with the recurrence rates of the longest segments around 600 or 1400 msec, p > 0.05. Moreover, the bisection point did not correlate significantly with the recurrence rate of the longest segment at the midpoint within alpha (r = −0.43, p > 0.05) or delta (r = −0.20, p > 0.05) frequencies.
Just noticeable difference values and the recurrence rates at 600, 1000, and 1400 msec across all three oscillatory bands (alpha, theta, and delta) were also analyzed. None of the relationships was significant (p > 0.05), indicating that temporal sensitivity did not relate to the segmentation properties of oscillatory responses. The relationship between just noticeable difference values and the recurrence rate within the alpha band at 1000 msec approached significance but did not meet corrected threshold criteria, 0.003 (r = 0.67, p = 0.05).
Discussion
In this pilot study, we identified a potential neural marker for both objective and subjective time estimations. Participants were presented with stimuli of varying lengths and asked to estimate the durations as “long” or “short” while we recorded cortical EEG activity with 128 electrodes. In general, participants tended to have relatively short bisection points and thus tended to overestimate how much time had passed.
The mean bisection point was 784 msec, which was closer to the geometric mean of task stimuli (800 msec) than to the arithmetic mean (1000 msec). It is reported that humans tend to bisect closer to the geometric mean with logarithmically spaced probes, while bisecting closer to the arithmetic mean with linearly spaced probes (Allan and Gibbon, 1991; Grondin, 2012; Wearden et al., 2008). Even so, the probes used here were spaced every 200 msec. However, it is also reported that humans tend to bisect closer to the geometric mean when the anchors are close together in time (Kopec and Brody, 2010) as ours were (i.e., spread over milliseconds rather than seconds).
There was no relationship between the just noticeable difference values and the bisection point, and thus, temporal sensitivity did not relate to subjective timing. As expected, coefficients of variation (ratio of standard deviation to the mean) indicated that participants had more difficulty estimating the duration of the intermediate probes, and the shorter durations in particular.
Neural correlates of subjective time
The EEG data were analyzed with temporal segmentation, a novel method that can identify time points when the spatial distribution of cortical activity remains quasistationary. This procedure was initially developed for a modified oddball task, during which three stimuli (one being the target or oddball) are presented with different frequencies. During this task, the “oddball” typically elicits a slow positive-going evoked response around 300 msec after stimulus onset, known as the P300. The segmentation approach identified sustained activity in the parietal and frontal cortices during the 230–360 msec segment (Haddad and Najafizadeh, 2019). These segment boundaries thus corresponded to the canonical P300 wave in parietal and frontal cortical regions, suggesting that the source-informed segmentation algorithm can detect relevant network activity while engaging in a cognitive task.
For the temporal bisection task used here, we focused on sustained activity during the 1200 msec probe trial stimulus. We chose this temporal duration because participants find it difficult to decide whether this stimulus is short or long and because the corresponding EEG signal was less likely to be contaminated by stimulus offset or other perceptual responses. Sustained activity during the 1200 msec stimulus was most evident around 1000 msec, which corresponded to the arithmetic mean of all stimuli in the task (halfway between 400 and 1600 msec). The sustained responses did not reflect the response to stimulus offset, which can be observed in Figure 3 as a large peak in the waveform around 1200 msec. Importantly, sustained activity around the midpoint was observed across participants and thus could reflect an objective response the brain uses to determine whether the probe trials are longer or shorter than the midpoint.
Individuals who tended to overestimate time had a shorter bisection point and their brains tended to elicit more and longer segments of sustained activity, especially concentrated around 1000 msec and especially within theta oscillations (Fig. 3B). Specifically, the recurrence of these segments of activity were highly correlated (r = 0.90) with the bisection point. Thus, individuals who were overestimating the duration of the stimuli produced more long segments of cortical activity around the arithmetic mean of all stimuli (1000 msec). One might predict that segments of sustained activity would occur closer to the bisection point (∼784 msec). However, the onset and midpoint of the longest segments were not directly associated with the bisection point within individuals; rather the timing of recurrent sustained segments was associated with the bisection point.
Sustained activity at the arithmetic mean might be one way the brain monitors stimulus duration. Once the probe interval passes the midpoint in duration, the person can estimate and in many cases, simply guess that the 1200 msec stimulus duration is “long.” Those participants who were overestimating how much time had passed were producing more of these sustained activities, suggesting that they were relying more on this information to make the decision about whether the stimulus was short or long. Figure 2 illustrates the striking differences among participants, first with an overestimator (579 msec), who felt as if time were moving faster, compared with an underestimator (922 msec), who felt as if time were moving slower. We also present a participant who was in between and bisected closer to the geometric mean (800 msec). Sustained EEG activity occurred frequently and early in time for the overestimator (Fig. 2A), while occurring more often later in time for the underestimator (Fig. 2C).
The algorithm detects segments in EEG data during which the spatial distribution of cortical activity remains relatively stable. It is “source-informed,” meaning theoretically, segment boundaries in EEG are determined based on the shifts in the location of activities that take place in the cortex (i.e., the source). These sustained activities, although consistent across participants, did not consistently appear in one region of the cortex versus another. For example, subject 1 (Fig. 2A) expressed sustained activity across midline cortical regions, whereas subject 2 (Fig. 2B) expressed sustained activity across temporal and frontal lobes, and subject 3 (Fig. 2C) expressed activity in a combination of cortical regions. Because the recurrence of these segments corresponded to subjective time estimation, we presume that they reflect different networks used by one person versus another when they are trying to estimate how much time has passed. These differences depend not only on task parameters but also on previous experience, memories, and mood, to name a few (e.g., Droit-Volet and Meck, 2007).
Endogenous oscillations and subjective time
Temporal information is often associated with naturally occurring brain oscillations. As just discussed, recurrence rates of the longest EEG segments were highly related to the bisection point. This relationship was especially evident for activity that occurred in the theta range (4–8 Hz), but not delta (1–4 Hz) or alpha (8–16 Hz) (Fig. 3B). Recurrence rates that occurred around 1000 msec were statistically different from those around 600 and 1400 msec (Fig. 3C). These data suggest that the recurrence rate is driven, in part, by endogenous oscillations between 4 and 8 Hz. Indeed, it is possible that theta oscillations were used to calculate the onset and offset of each stimulus while comparing it to the anchor durations held in memory.
It is perhaps not a coincidence that the frequencies inherent to theta rhythms (4–8 Hz) coincide with the temporal spacing of durations presented in the bisection task (5 Hz or 200 msec). Thus, it is possible that the stimuli entrain the brain into theta rhythms, or perhaps theta is inherently suited to pick up stimuli durations in this range. Alternatively, the segmentation process may capture characteristics specific to one frequency versus another. For example, lower frequency bands (such as theta or delta) may result in longer segments because the signals vary at a slower rate (Haddad and Najafizadeh, 2020). Nevertheless, the present data suggest that the recurrence rate of sustained neural activity occurs preferentially during theta activity and is highly associated with the subjective estimation of time.
These data are consistent with numerous studies implicating theta oscillations in sequence learning (Wallenstein and Hasselmo, 1997) as well as holding temporal information in working memory (Cutsuridis and Hasselmo, 2012). One group observed that theta power was enhanced during the early anticipation of temporal stimuli (Cravo et al., 2011). Thus, the power of theta oscillations may increase during stimulus onset and then decrease as the brain processes temporal durations. In the present study, we did not assess power; however, sustained and recurrent neural responses in the theta band were related to shorter bisection points (i.e., overestimation of time). Overall, these data indicate that theta oscillations potentially modulate the expectation and estimation of temporal information in the millisecond range, potentially serving as an endogenous time-keeping mechanism.
Limitations
This pilot study focused on identifying sustained activity while humans were estimating the feeling of time passing. As such, we did not assess other psychological states that could impinge on EEG activity. For example, we did not assess changes in attention that were likely to occur in participants presented with multiple stimuli in a relatively short period of time. We also did not localize segmented activity to discrete regions in the cortex. This new method is data-driven and thus does not depend upon a priori hypotheses about the locations of active regions. Finally, the sample size was relatively small, as reflected to some extent in the variability of the responses.
Conclusion
This study establishes a novel method for identifying segment boundaries in EEG recordings of underlying cortical activity, without the need for source localization. This method revealed a period of sustained cortical activity that may be used to estimate the amount of time that has elapsed, which may in turn contribute to a feeling of time passing.
Footnotes
Authors' Contributions
E.M.M.: Conceptualization, formal analysis, investigation, methodology, and writing—original draft, review and editing. A.E.H.: Conceptualization, formal analysis, methodology, and writing—review and editing. H.Y.M.C.: Investigation, methodology, and writing—review and editing. L.N.: Conceptualization, methodology, supervision, funding acquisition, and writing—review and editing. T.J.S.: Conceptualization, funding acquisition, methodology, supervision, and writing—review and editing.
Author Disclosure Statement
No competing financial interests exist.
Funding Information
This work was supported by the Brain Health Institute at Rutgers University (Grant No. 205605) and the National Science Foundation (Award No. 2319518).