
Abstract
Background/Purpose:
To examine the influence of interpulse interval duration on knee extensor corticospinal excitability.
Methods:
Seventeen college-aged males and females participated in a single laboratory visit, during which 25 single transcranial magnetic stimulation pulses were delivered to the motor cortex with interpulse intervals of 5, 10, 15, and 20 sec. Surface electromyographic signals were detected from the dominant vastus lateralis and rectus femoris. Motor evoked potential amplitude was compared across the four conditions.
Results:
For the vastus lateralis, the Friedman test indicated significant differences among conditions (chi-squared [3] = 7.80, p = 0.050); however, there were no pairwise differences (p ≥ 0.094) and small effect sizes (d ≤ 0.269). For the rectus femoris, the Friedman test results showed no significant differences among conditions (chi-squared [3] = 2.44, p = 0.487). Across all muscles and conditions, low intraclass correlation coefficients and high standard errors of measurement were suggestive of poor reliability.
Conclusion:
Unlike resting hand muscles, interpulse interval duration has little influence on corticospinal excitability for the knee extensors during active contractions.
Impact statement
Transcranial magnetic stimulation (TMS) data vary both within and across participants. When designing TMS studies, one variable that is rarely considered is the time between pulses, or the interpulse interval. Previous studies conducted in resting hand muscles show that longer interpulse intervals are associated with greater corticospinal excitability. We compared interpulse intervals of 5, 10, 15, and 20 sec on corticospinal excitability of the knee extensors during active contractions. Unlike previous studies, our findings suggest that interpulse interval duration has little influence on corticospinal excitability. TMS researchers studying the knee extensors should select an interpulse interval that suits their needs and be consistent.
Introduction
Originally introduced by Barker et al. (1985), transcranial magnetic stimulation (TMS) is a noninvasive technique commonly used to stimulate various brain regions. TMS has been widely used in research to investigate the motor system (Lefaucheur, 2019). To conduct these studies, a magnetic coil is used to deliver TMS pulses over the motor cortex (M1) to depolarize neurons controlling the desired target muscles. Surface electromyography (EMG) is used to record motor evoked potentials (MEPs), providing insights into the excitability and/or inhibition of the corticospinal tract. While TMS offers hope for exciting new discoveries, the methodology used by researchers has been inconsistent or poorly described, leading to nonreproducible findings. In a comprehensive survey of 47 well-established TMS researchers, Héroux et al. (2015) identified several questionable research practices that limit the reproducibility of published TMS findings. For example, roughly 50% of respondents reported that they were unable to replicate previously published protocols. Other problems identified in the survey included the use of small sample sizes, removing data from results without proper justification, vague descriptions of research methodology, and difficulty in publishing negative findings (i.e., file drawer problem). Based on their findings, Héroux et al. (2015) urged investigators using TMS to be more thorough and transparent to ensure greater reproducibility and confidence in the published literature.
By measuring the peak-to-peak amplitude of TMS-induced MEPs, investigators can examine the excitability of the corticospinal tract. While corticospinal excitability is commonly reported in the TMS literature, it can be highly variable both within and between individuals (Maeda et al., 2002; Schmidt et al., 2009). To mitigate this, TMS research protocols typically involve multiple pulses, rather than one, and the mean value is ultimately reported. Among the many methodological factors that may influence corticospinal excitability is the time duration between successive TMS pulses, or the interpulse interval. Several studies have sought to determine the extent to which variability in corticospinal excitability can be minimized by altering TMS interpulse intervals (Hassanzahraee et al., 2019; Möller et al., 2009; Vaseghi et al., 2015). Möller et al. (2009) reported that TMS protocols with an interpulse interval of 20 sec elicited larger MEPs compared with 5 sec. Greater MEP amplitude and reduced variability were also reported with longer interpulse intervals by Vaseghi et al. (2015) and Hassanzahraee et al. (2019), respectively. While the exact mechanism to explain these findings was not explored, the delivery of a single TMS pulse over M1 acutely alters cortical Hb concentrations (Mochizuki et al., 2006) and may cause cerebral vasoconstriction and reduced blood flow, with these effects lasting at least 8 sec (Thomson et al., 2012). Unfortunately, many TMS research studies do not provide details about the interpulse interval used, making it difficult to compare approaches utilized among laboratories. The variability in corticospinal excitability induced by using short and/or randomly timed interpulse intervals has implications for clinical trial design. Specifically, if controlling for interpulse interval variability removes a source of error variance from corticospinal excitability data, this could help investigators detect small but clinically meaningful changes in response to neurorehabilitation interventions.
Studies that have compared corticospinal excitability for different interpulse intervals have primarily studied hand muscles at rest (Cash et al., 2017; Chen et al., 1997; Julkunen et al., 2012; Pitkänen et al., 2017). To the best of our knowledge, there has only been one study that has compared corticospinal excitability for various interpulse intervals on both active and resting muscles (Matilainen et al., 2022). Matilainen et al. (2022) compared the effects of 2, 5, and 10 sec interpulse intervals during both resting and active conditions for the first dorsal interosseous muscle. They found that interpulse interval duration had a significant influence on MEP amplitude at rest, but not during active contractions. As such, it is unclear if findings observed during resting conditions can be applied to studying active contractions in the lower limbs. It should be noted that using TMS to study the lower limbs presents several challenges (Kesar et al., 2018). Among these challenges is the fact that the M1 cortical representations of lower limb muscles spanning multiple joints lie in close proximity to each other. Given the lack of focality that TMS-induced currents produce, it is difficult, if not impossible, to isolate and consistently target an individual lower limb muscle. Kesar et al. (2018) demonstrated that a single TMS pulse produces bilateral MEPs across multiple joints (see their figure 2). Moreover, lower limb muscles are less dexterous compared with those of the upper limb and have a higher proportion of motor units that are driven by larger motor neurons with higher activation thresholds (Brasil-Neto et al., 1992; Smith et al., 2017). Furthermore, variability in sulci and gyri shape and size can result in difficulties in finding hot spot locations and motor thresholds (Weiss et al., 2013). These challenges collectively necessitate higher TMS intensities and/or active contractions to be able to produce reliable MEPs (Smith et al., 2017). For these reasons, the methods from upper limb TMS studies conducted at rest may not be applicable for investigators wishing to study important functional outcomes, such as gait, balance, and lower extremity injuries.
Given these gaps in knowledge, the purpose of the present study was to investigate the effects of different interpulse intervals of single-pulse TMS on MEP amplitude and reliability in knee extensor muscles. To provide consistency within the TMS literature, we replicated aspects of the design and interpulse intervals utilized by Hassanzahraee et al. (2019). We hypothesized that longer interpulse intervals would produce greater MEP amplitude and minimize pulse-to-pulse variability. The results from this study have important implications for investigators seeking to minimize variability in corticospinal excitability when conducting single-pulse TMS studies involving active lower limb muscles.
Methods
Experimental design
All participants engaged in a single data collection session at the University of Central Florida Neuromuscular Plasticity Laboratory. Each data collection session involved single-pulse TMS assessments under four experimental conditions. As conducted by Hassanzahraee et al. (2019), 25 single TMS pulses were delivered at interpulse intervals of 5, 10, 15, and 20 sec. The order of the four interpulse interval conditions was predetermined with a Balanced Latin Squares approach (Richardson, 2018). Given that TMS assessments of the lower limbs require active contractions and therefore may induce fatigue, 10 min of quiet rest was provided between each of the experimental conditions. Participants were provided videos to watch of TMS assessments before data collection to become familiar with the experimental procedures. To control for variation, participants were asked to not consume any caffeine, alcohol, drugs, or to exercise 24 h before participation. This was confirmed via questionnaires upon arrival to the laboratory for testing. All testing was conducted between 8:00 am and 6:00 pm Eastern Daylight Time.
Participants
Seventeen participants (eight males, age = 23 ± 3 years, height = 178.5 ± 6.4 cm, mass = 82.6 ± 10.2 kg; nine females, age = 22 ± 3 years, height = 162.3 ± 5.3 cm, mass = 68.6 ± 9.1 kg) between the ages of 18–30 years participated in this study. Exclusion criteria included major neuromuscular/metabolic disease, history of concussions, stroke, cancer, heart attacks, lower body musculoskeletal injury or surgery within the previous 6 months, and current use of pain medication/alcohol. All 17 participants signed informed consents, completed the physical activity readiness questionnaire (2019 PAR-Q+), and underwent thorough TMS screening (Rossi et al., 2021; Rossi et al., 2009). Participants completed the International Physical Activity Questionnaire–Short Form (IPAQ-SF), which has seven open-ended questions concerning their recall of physical activity over the last 7 days. Based on the IPAQ-SF, four (23.5%), nine (52.9%), and four (23.5%) participants reported high, moderate, and low physical activity, respectively. Each participant was compensated for their time with $20 Target gift cards. The study was approved by the University of Central Florida Institutional Review Board (Study #4377).
Surface EMG and isometric torque
All testing was conducted on the dominant knee extensors (based on kicking preference) with participants seated on a Biodex System 4 Isokinetic Dynamometer (Biodex Medical Systems, Inc., Shirley, NY, USA). Straps were placed around each participant's chest, waist, and dominant thigh to limit extraneous movements. The knee and hip joint angles were set at 110° and 95°, respectively (180° = full extension). Visual feedback was provided to the participants on a monitor. Following a brief submaximal warm-up, all participants performed three, 5-sec unilateral, isometric maximal voluntary contractions (MVCs) of the knee extensors. The single highest peak torque value was designated as their MVC (Nm). Throughout TMS testing, a horizontal line representing 10% of their MVC peak torque was displayed on a monitor for participants to follow with knee extension torque. The line remained at 10% MVC throughout the protocol, and participants were required to increase their torque output from a resting level to the horizontal line between pulses.
Bipolar surface EMG signals were recorded from the dominant vastus lateralis and rectus femoris. In accordance with the recommendations from the Surface EMG for Non-Invasive Assessment of Muscle project (Hermens et al., 2000), the vastus lateralis EMG sensor was placed at two thirds of the distance between the greater trochanter and the superolateral border of the patella, whereas the rectus femoris EMG sensor (Trigno™ EMG; Delsys, Inc., Natick, MA, USA; interelectrode distance = 10 mm, 20–450 Hz) was placed at one half on the line from the anterior spina iliaca superior to the superior border of the patella. The skin over the belly of each muscle was prepared before testing by shaving and cleaning with rubbing alcohol. We inspected the signals for low baseline noise before data collection, and additional skin preparation was conducted as needed. EMG works acquisition software (version 4.7.6; Delsys, Inc.) was used to record the EMG and torque signals in-sync at a sampling rate of 2000 Hz.
Single-pulse TMS
Single-pulse TMS was performed utilizing a Magstim®2002 (The Magstim, Whitland, United Kingdom) stimulator device. A double-cone coil (The Magstim) was used for stimulation over M1. The participants wore a Lycra cap throughout testing. All testing was conducted with participants performing isometric knee extension contractions at 10% of their MVC torque. The hot spot was located by identifying the location over M1, which elicited the highest vastus lateralis MEP peak-to-peak amplitude. Specifically, five single pulses were delivered over M1, with the coil moved in 1 cm increments. The location over M1 with the highest mean MEP amplitude across the five pulses was designated as the hot spot and marked on the Lycra cap with a permanent marker. To ensure consistent coil placement throughout testing, the location of the windings that corresponded the M1 hot spot was also marked on the Lycra cap with a permanent marker. The same investigator (J.P.B.) held the TMS coil throughout the entire study. TMS data for the rectus femoris served as a secondary outcome measured that was collected in conjunction with the vastus lateralis data; however, hot spot determination and isolated measures for the rectus femoris were not explored.
After hot spot determination, active motor threshold (AMT) testing was conducted, again with participants performing isometric knee extension contractions at 10% of their MVC torque. AMT was defined as the lowest stimulator output (%SO) that elicited a vastus lateralis MEP with a peak-to-peak amplitude ≥double the EMG activity during the 10% MVC. A relative value was used rather than an absolute threshold (e.g., 50 μV) because of the numerous factors that influence EMG amplitude during voluntary contractions (De Luca, 1997). Following AMT determination, 25 single TMS pulses were delivered at a %SO corresponding to 130% of AMT delivered at interpulse intervals of 5, 10, 15, and 20 sec while participants performed an isometric contraction corresponding to 10% of their MVC peak torque. Participants were able to relax between TMS pulses, but brought their torque to 10% MVC before TMS pulse delivery. Specifically, the investigator (J.P.B.) delivered the TMS pulse to M1 when the participant maintained 10% MVC peak torque for 2 sec. A countdown timer was displayed on the monitor, which informed the participants of when to contract and relax. The results from a two-way repeated-measures analysis of variance (ANOVA) confirmed that each participant maintained the desired 10% MVC torque level at the timing of pulse delivery, with no differences in torque across conditions or pulses (interaction and main effects p ≥ 0.697). They remained seated and strapped in the dynamometer during the 10-min rest periods between conditions. To determine if the research protocol was fatiguing, participants performed an additional MVC at the conclusion of the TMS assessments. MEP peak-to-peak amplitude for the vastus lateralis and rectus femoris was quantified for each condition using the custom LabVIEW software (NI LabVIEW 17.0; National Instruments, Austin, TX, USA). The same investigator (K.S.K.) performed all TMS analyses in LabVIEW. For each participant and condition, the mean MEP value across the 25 pulses represented the dependent variable.
Statistical analyses
Statistical analyses were conducted with two approaches: (1) examination of mean differences across conditions and (2) examination of reliability across 25 pulses for each of the four conditions. These approaches were used for both the vastus lateralis and the rectus femoris. Before examining the mean differences across conditions, assessments of normality were conducted with the Shapiro–Wilk test. When data were distributed normally, differences in mean MEP amplitude across the four experimental conditions were examined with separate one-way repeated-measures ANOVA. In the event of a significant ANOVA, follow-up analyses included Bonferroni post hoc comparisons. The partial eta squared (ή 2) statistic was computed as a measure of effect size associated with each ANOVA, with 0.01, 0.06, and 0.14 representing small, medium, and large effects, respectively (Cohen, 1988). In the event of non-normal distributions, the Friedman test was conducted as the nonparametric alternative. Kendall's w statistics was used to evaluate effect sizes of the Friedman test, with 0.00 ≤ w < 0.20, 0.20 ≤ w < 0.40, 0.40 ≤ w < 0.60, 0.60 ≤ w < 0.80, and w ≥ 0.80 representing slight agreement, fair agreement, moderate agreement, substantial agreement, and almost perfect agreement, respectively (Landis and Koch, 1977). In the event of the significant Friedman test, follow-up analyses included Conover's post hoc tests. Cohen's d effect sizes were used to evaluate effect sizes of pairwise comparisons, with 0.20, 0.50, and 0.80 representing small, medium, and large effects, respectively (Cohen, 1988). An alpha level of 0.05 was used for all comparisons. To examine reliability in MEP amplitude across the 25 TMS pulses, for each condition and muscle, we examined the results for a one-way repeated-measures ANOVA, intraclass correlation coefficients (ICCs, model 3,1), the standard error of measurement (SEM [expressed both in absolute units and as a percentage of the mean]), and the minimal difference needed for a change to be considered real (MD) (Weir, 2005). MD was calculated as: SEM × 1.96 × √2 (Weir, 2005). Finally, to determine pre–post changes in MVC peak torque, a paired samples t-test was conducted. JASP software (JASP 16.0; University of Amsterdam, Amsterdam, NL, USA) was used to conduct the one-way repeated-measures ANOVAs, Friedman's tests, and the paired samples t-test, whereas the custom LabVIEW program (version 17.0; National Instruments, Inc., Austin, TX, USA) was used to calculate ICCs, SEMs, and MDs.
Results
Vastus lateralis: Differences among conditions
Examination of normality assumptions indicated that each of the four conditions showed non-normal distributions (Shapiro–Wilk p ≤ 0.014). As shown in Table 1 and Figure 1, the highest values are shown for the 5 sec condition. The results from the Friedman test indicated that there were significant differences among conditions (chi-squared [3] = 7.80, p = 0.050). Kendall's W = 0.153, indicating that there was a slight association. Conover's tests revealed that all pairwise comparisons were not statistically significant (p ≥ 0.094). Evaluation of effect sizes for pairwise comparisons indicated that all differences among conditions could be considered small (d ≤ 0.269).
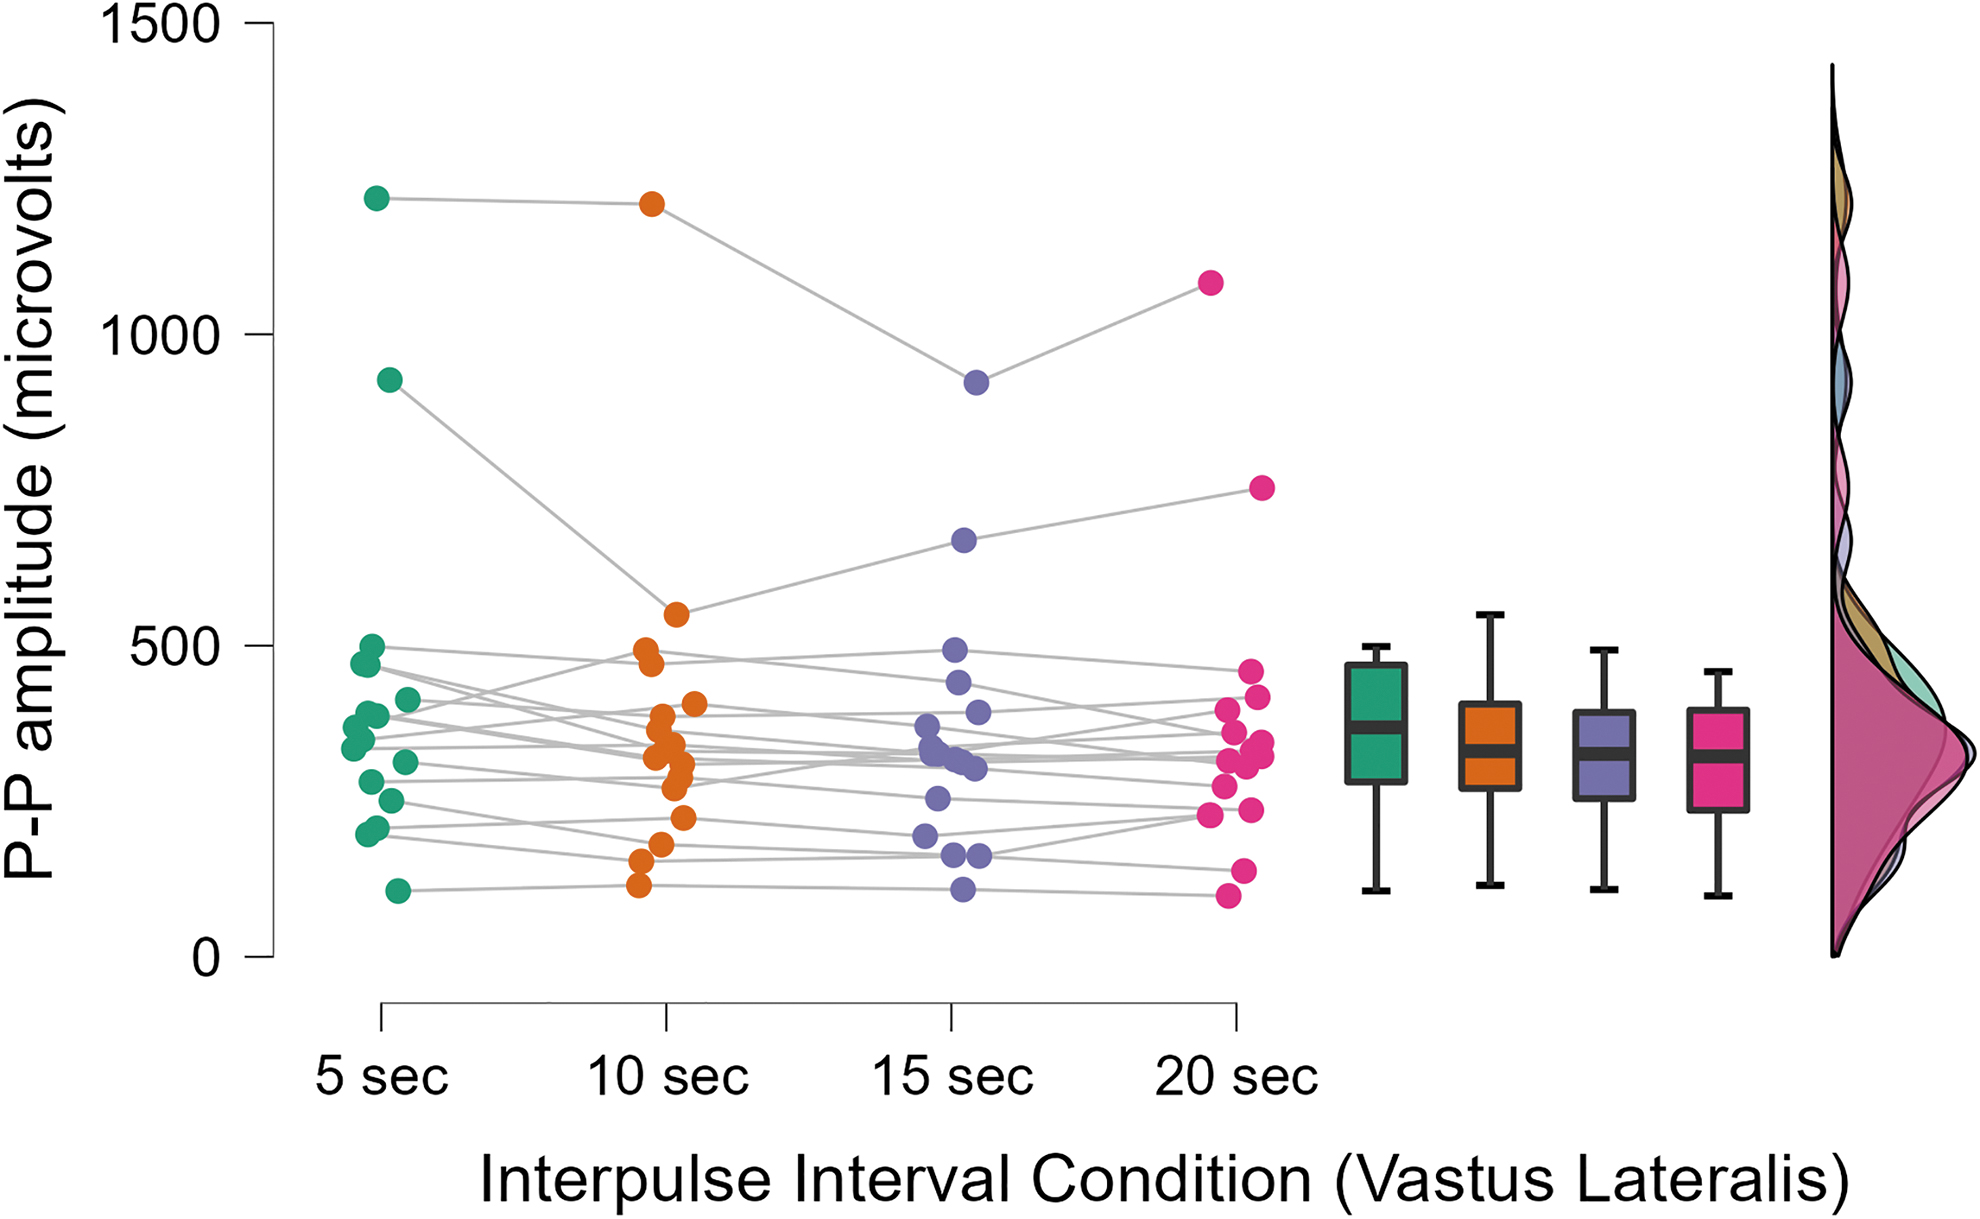
A JASP raincloud plot for the vastus lateralis muscle across the four conditions. P–P = peak-to-peak.
Measures of Central Tendency, Variance, and Normality for Corticospinal Excitability, Quantified as the Peak-to-Peak Amplitude of Each Motor Evoked Potential
The mean values represent the mean across the 25 pulses for each condition.
Statistically significant.
Rectus femoris: Differences among conditions
Examination of normality assumptions indicated that each of the four conditions showed non-normal distributions (Shapiro–Wilk p ≤ 0.046). The Friedman test results indicated that there were no significant differences among conditions (chi-squared [3] = 2.44, p = 0.487). Kendall's W = 0.048, indicating that there was a slight association. Evaluation of effect sizes for pairwise comparisons indicated that all differences among conditions could be considered small (d ≤ 0.066). These findings are highlighted in Figure 2.
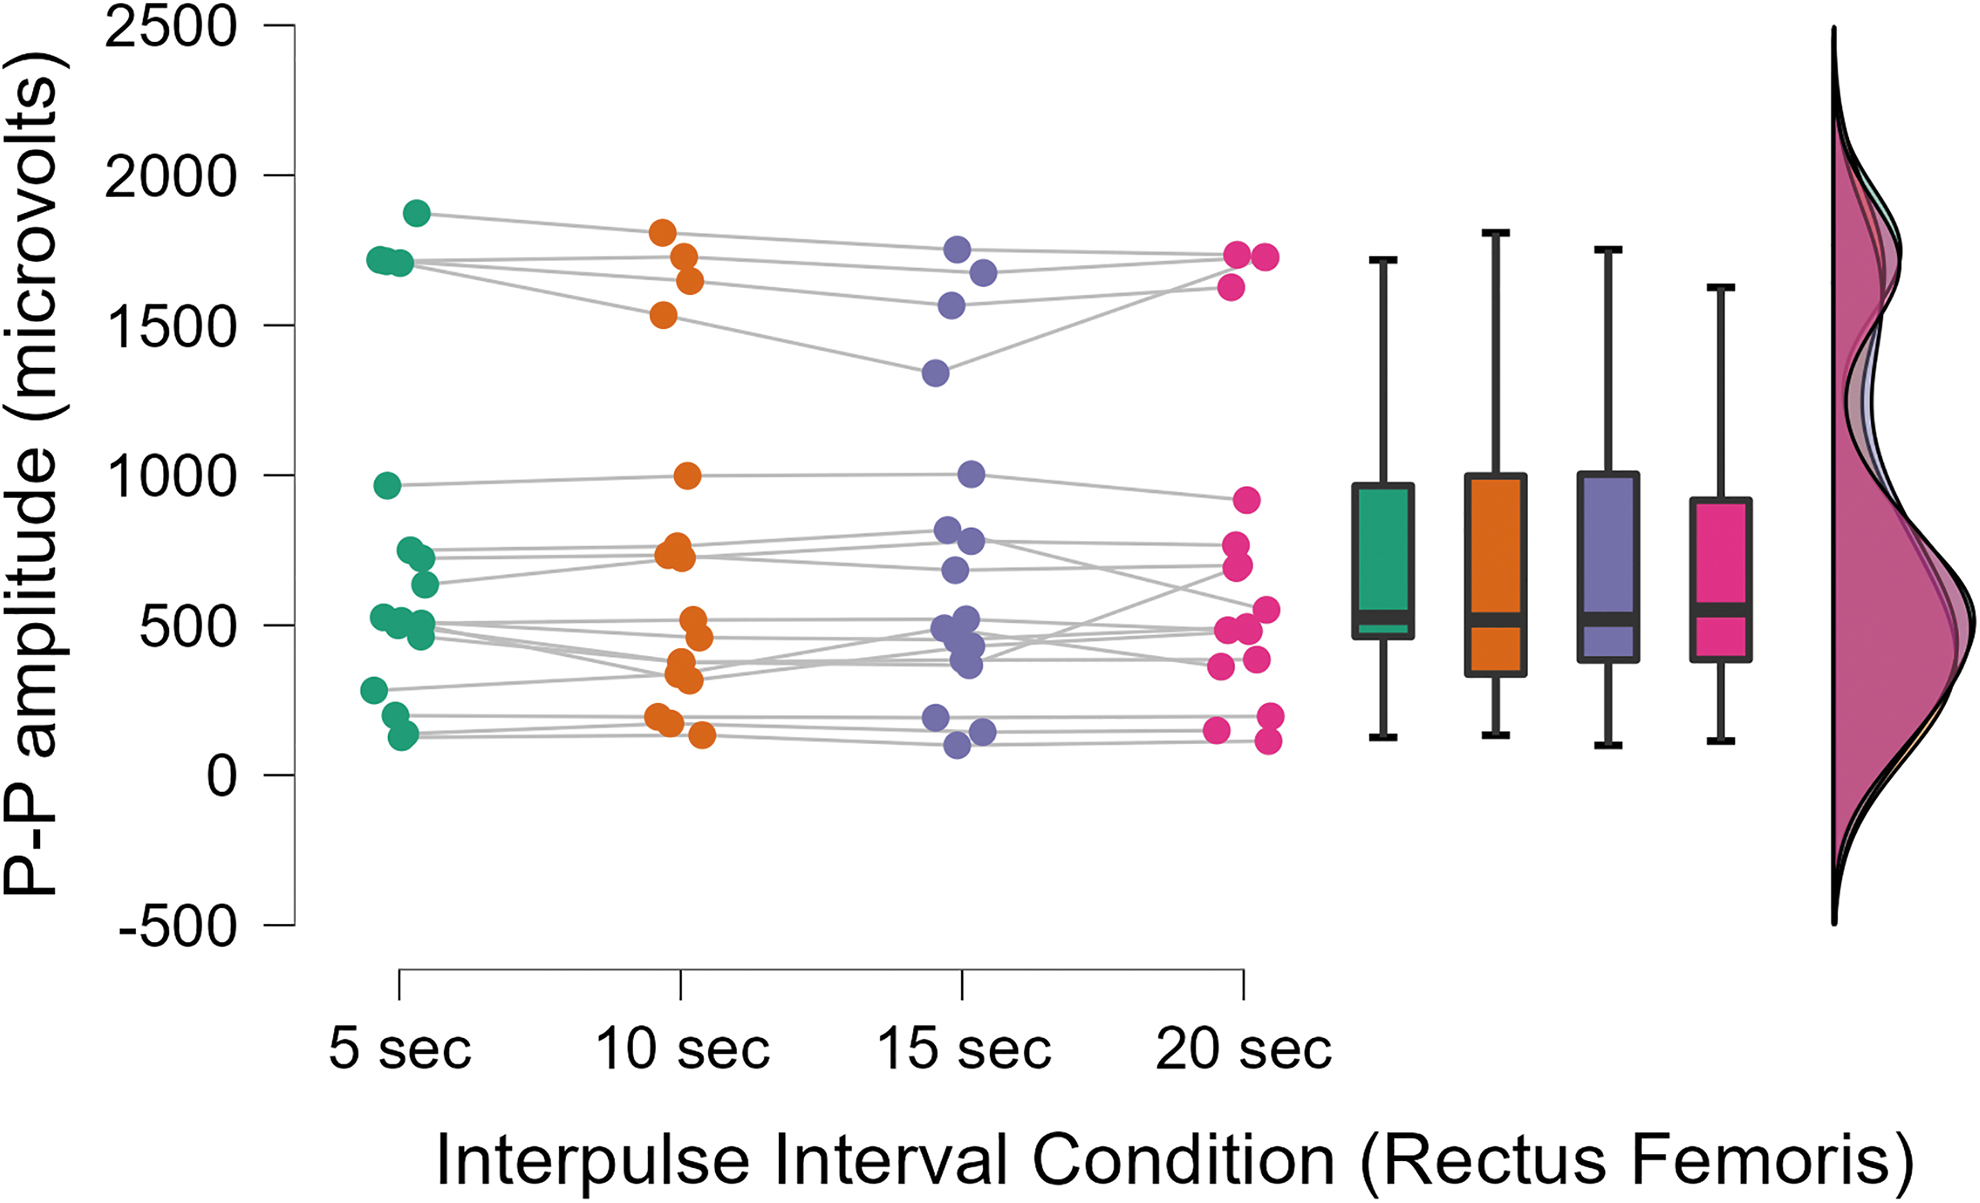
A JASP raincloud plot for the rectus femoris muscle across the four conditions. P–P amplitude = peak-to-peak amplitude.
Vastus lateralis and rectus femoris: Reliability across pulses
Table 2 displays test–retest reliability statistics for the 25 pulses across each of the four conditions and for each muscle. As these data were normally distributed (Shapiro–Wilk p ≥ 0.05), repeated-measures ANOVA were utilized. For each condition and muscle, there were no significant differences (p ≥ 0.05). The SEMs were high and ICCs were low, suggesting poor reliability across the TMS pulses.
Test–Retest Reliability Statistics for Corticospinal Excitability Across the 25 Pulses
ICC, intraclass correlation coefficients; MD, the minimal difference needed to be considered real; SEM, standard error of measurement.
Pretest–post-test MVC changes
The results from the paired samples t-test indicated that was a significant decrease in MVC peak torque (pretest MVC = 165.4 ± 61.7 Nm, post-test MVC = 156.2 ± 65.7 Nm; p = 0.014, d = 0.667). These findings are highlighted in Figure 3.

A JASP raincloud plot highlighting individual participant MVC responses. Positive values represent a decrease in MVC peak torque, whereas negative values represent an increase. The mean decrease was 9.2 Nm, which represented a 5.5% change. MVC, maximal voluntary contraction.
Discussion
TMS-derived corticospinal excitability is known to be highly variable across individuals (Maeda et al., 2002; Schmidt et al., 2009). One methodological issue that has rarely been considered in lower limb TMS studies is the duration between single pulses, or the interpulse interval. Studies conducted on hand muscles at rest have shown that corticospinal excitability is influenced by the interpulse interval, with longer durations associated with greater excitability (Cash et al., 2017; Julkunen et al., 2012; Pitkänen et al., 2017). Based on these findings, we hypothesized that longer interpulse intervals would lead to greater mean MEP amplitude and reduce pulse-to-pulse variability when testing the vastus lateralis and rectus femoris during active contractions. Our findings indicated that there were no significant differences in the mean MEP amplitude across interpulse interval durations of 5, 10, 15, and 20 sec. While a 5 sec interpulse interval showed the highest MEP amplitude for the vastus lateralis, all effect sizes were small. Furthermore, for each condition and muscle, the test–retest reliability results showed poor reliability across the 25 pulses. These findings suggest that, unlike resting muscles of the hand, interpulse interval duration has little influence on corticospinal excitability for the knee extensors during active contractions.
Previous studies showed that MEP amplitude increased as interpulse intervals increased from 5 sec up to 20 sec (Cash et al., 2017; Chen et al., 1997; Julkunen et al., 2012; Möller et al., 2009). One other study found that MEP amplitude was not affect by intervals of 2, 3, and 10 sec during active contractions of the muscles of the hand (Matilainen et al., 2022). The implications of these previous findings have been that researchers can utilize longer interpulse intervals to observe greater MEP amplitude in resting muscles of the hand but can utilize shorter intervals when examining active muscles of the hand. While the exact mechanism has not been determined, studies have found that a single TMS pulse delivered over the motor cortex can acutely alter cortical Hb concentrations and cause cerebral vasoconstriction and reduce blood flow to the brain (Mochizuki et al., 2006). These effects are thought to last up to 8–10 sec (Thomson et al., 2012). However, these studies have only been conducted involving muscles in the hand. As our study design did not allow for the analysis of specific mechanisms, it is difficult to reconcile the differences in our findings versus those conducted in the hand. We offer two potential explanations. First, challenges related to studying the lower limbs during TMS (e.g., close proximity of M1 representations relative to pulse focality and unique motor control circuitry) may have influenced our findings. Second, it is possible that differences between our study results and previous findings were related to the fact that our TMS pulses were delivered during active contractions. Given how closely our study design replicated that by Hassanzahraee et al. (2019), the use of active contractions likely explains this difference. Regardless of the specific mechanism, our results suggest that TMS researchers interested in studying the vastus lateralis and rectus femoris during active contractions can likely select an interpulse interval that best suits them. However, standardization is likely still an important issue. Moreover, it is our hope that the present study draws attention to interpulse interval duration and encourages this to be reported in the methodology of future TMS research studies.
In addition to examining the mean differences across interpulse interval conditions (i.e., 5 sec vs. 10 sec vs. 15 sec vs. 20 sec), we also sought to evaluate the test–retest reliability of MEP amplitude across the 25 TMS pulses. Our current findings indicated that, while each condition presented data that were distributed normally, there were no significant differences for each condition and muscle. However, the reliability of all 25 pulses across each condition was extremely poor, with levels of ICCs of 0.038, 0.040, 0.035, and 0.036 for the vastus lateralis at 5, 10, 15, and 20 sec, respectively. For the rectus femoris, the ICCs were also extremely low (0.036, 0.040, 0.041, and 0.040 at 5, 10, 15, and 20 sec, respectively). In addition, the SEMs were high across both muscles and all conditions. These findings were in contrast to the results presented by Hassanzahraee et al. (2019), who reported “good” reliability with an ICC of 0.79 at 5 sec, which increased to 0.86 at 10 sec, 0.89 at 15 sec, and 0.90 at 20 sec. This disparity could be due to a multiple of factors, such as different muscle groups being involved, with our study design utilizing muscles in the lower limb compared with their analysis of muscles in the hand. Another discrepancy could be the difference of study designs as Hassanzahraee et al. (2019) examined both within session and between session reliability of MEP amplitude across all four conditions. It is important to note, however, that little is known about the test–retest reliability of MEP amplitude across pulses during active contractions of the knee extensors. To maximize reliability of the pulses, it is important to obtain an optimal number needed to get a true estimate of corticospinal excitability, short interval intracortical inhibition, and intracortical facilitation. Brownstein et al. (2018) sought to find the most optimal number involving active conditions of the knee extensors, specifically the rectus femoris. They found that at least 21, 18, and 17 pulses were needed for corticospinal excitability, short interval intracortical inhibition, and intracortical facilitation, respectively, to fall within the 95% confidence interval. In comparison to our study design, we utilized the delivery of 25 pulses to the vastus lateralis and the rectus femoris, rather than the aforementioned pulses, which could have played a part in low reliability results. Collectively, similar to our examination of the mean differences across conditions, our results show that there are no clear advantages associated with a single interpulse interval duration, as all muscles and conditions exhibited poor reliability.
Limitations
While our study had several strengths (e.g., within-participants design, Latin Squares, all data collection during a single visit, controls for extraneous factors), there were several limitations that must be addressed. First, our sample size was small and limited to healthy college-aged males and females. Thus, whether these findings are applicable to other participants, such as patients with neuromuscular or neurological disorders, is unclear. Second, our MEPs were not normalized to the maximal compound action potential (Mmax) obtained from peripheral nerve stimulation, which has been common in knee extensor TMS studies (Alibazi et al., 2022; Weier et al., 2012). It is possible that normalization to Mmax would have minimized variability between participants, thereby generating a more homogeneous data set. Third, we only examined a single %SO (130% AMT). It is common for TMS researchers to report data for multiple %SOs (e.g., 120–170% AMT). Thus, the extent to which these findings are applicable to a broad range of %SOs is not clear. We also did not utilize neuronavigation technology, so it is possible that we did not stimulate the exact position over M1 throughout a single testing session. Finally, it is important to acknowledge that MVC peak torque for the knee extensors was lower at the end of the protocol versus the beginning, which would suggest that the data collection procedures may have been fatiguing. While this may have been a methodological concern, the mean percent decline in peak torque was only 5.5%. Furthermore, whereas our pretest MVC was based on the best of three attempts, the post-test MVC was derived from a single attempt. However, the main reason why we are unconcerned about this small decrease in maximal strength was that our use of a Latin Squares design counterbalanced the four conditions, thereby reducing the influence of fatigue at the group level. Our limitations should be considered when placing the results of the present study in context with the broader TMS literature.
Conclusion
In conclusion, the results of the present study indicated that interpulse interval duration has no influence on corticospinal excitability during active contractions of the knee extensors. In addition, the reliability of MEP amplitude across all four interpulse interval conditions was poor. Our results are not consistent with previous studies examining the influence of interpulse interval duration on corticospinal excitability on resting hand muscles (Cash et al., 2017; Chen et al., 1997; Julkunen et al., 2012; Pitkänen et al., 2017). The major implications associated with our findings are for TMS researchers studying the lower limbs and suggest that a variety of interpulse intervals may be acceptable. Therefore, researchers can select a protocol that best fits their methodology and study needs. We encourage all TMS researchers to report their selected interpulse interval duration in future publications.
Footnotes
Acknowledgments
The authors would like to acknowledge the generosity of the 17 participants that completed this research study.
Authors' Contributions
K.S.K.: Investigation, visualization, data curation, formal analysis, writing—original draft. J.P.B.: Investigation, writing—review and editing. K.K.H., R.M.G., D.H.F., and D.J.K.: Writing—review and editing. M.S.S.: Writing—review and editing, conceptualization, methodology, project administration, supervision.
Author Disclosure Statement
No competing financial interests exist.
Funding Information
No funding was received for this article.