




Abstract
Introduction:
Unraveling the network pathobiology in neurodegenerative disorders is a popular and promising field in research. We use a relatively newer network measure of assortativity in metabolic connectivity to understand network differences in patients with Alzheimer's Disease (AD), compared with those with mild cognitive impairment (MCI).
Methods:
Eighty-three demographically matched patients with dementia (56 AD and 27 MCI) who underwent positron emission tomography-magnetic resonance imaging (PET-MRI) study were recruited for this exploratory study. Global and nodal network measures obtained using the BRain Analysis using graPH theory toolbox were used to derive group-level differences (corrected p < 0.05). The methods were validated in age, and gender-matched 23 cognitively normal, 25 MCI, and 53 AD patients from the publicly available Alzheimer's Disease Neuroimaging Initiative (ADNI) data. Regions that revealed significant differences were correlated with the Addenbrooke's Cognitive Examination-III (ACE-III) scores.
Results:
Patients with AD revealed significantly increased global assortativity compared with the MCI group. In addition, they also revealed increased modularity and decreased participation coefficient. These findings were validated in the ADNI data. We also found that the regional standard uptake values of the right superior parietal and left superior temporal lobes were proportional to the ACE-III memory subdomain scores.
Conclusion:
Global errors associated with network assortativity are found in patients with AD, making the networks more regular and less resilient. Since the regional measures of these network errors were proportional to memory deficits, these measures could be useful in understanding the network pathobiology in AD.
Impact statement
This study explores the use of a novel network measure, assortativity, to investigate metabolic connectivity differences between Alzheimer's disease (AD) and mild cognitive impairment (MCI) patients. The findings reveal that AD patients exhibit increased global assortativity, modularity, and decreased participation coefficient compared with MCI patients. These network alterations make AD networks more regular and less resilient, proportional to the memory deficits. By validating these results in a separate Alzheimer's Disease Neuroimaging Initiative dataset, the study demonstrates that network measures such as assortativity could be used to unravel the network pathobiology of AD.
Introduction
Alzheimer's disease (AD) is the most common form of neurodegenerative disorder affecting one or more cognitive domains, such as memory, behavior, language, etc., impairing an individual's ability to perform functions of daily living (Hedden and Gabrieli, 2004; Whalley et al., 2004). Pathologically, AD is characterized by the accumulation of Amyloid-β (Aβ) plaques and neurofibrillary tangles (composed of tau amyloid fibrils) leading to synaptic loss (Bateman et al., 2012).
Though genetic, environmental, cell senescence/inflammation-mediated mechanisms have been presumed to lead to deposition of these proteins (Karran and De Strooper, 2022) with a recent study pointing out the role of myelin dysfunction in AD animal models (Depp et al., 2023), there is no clear causative factor that can be linked to development to AD.
Clinically, AD is considered a spectrum disorder, and several studies have shown transition probabilities from mild cognitive impairment (MCI) to different stages of AD. While MCI is often seen as an intermediate stage between normal aging and AD, it is worth noting that the National Institute on Aging and Alzheimer's Association (NIA-AA) Research Framework defines “preclinical AD” as a condition marked by positive Aβ biomarkers but without evident cognitive impairment (Jack Jr. et al., 2018).
Several imaging studies have revealed whole-brain connectivity abnormalities in AD (Filippi and Rocca, 2016; Gao et al., 2020; Supekar et al., 2008; Zhou et al., 2010) when compared with MCI. Graph theory analysis is a mathematical technique used extensively in the last couple of years to evaluate network pathobiology of neurodegenerative disorders.
Notwithstanding the imaging methods, in the nomenclature of graph, the nodes of a network correspond to the region of interest and the edges are measures of the connection between these regions estimated using statistical correlations (Rubinov and Sporns, 2010). Functional segregation of the brain measures its capacity to perform specialized functions using a group of highly interconnected nodes.
Common measures of functional segregation are clustering coefficient, modularity, degree, local efficiency, etc. In contrast, functional integration measures the ability of the network to use information from distributed specialized regions rapidly. Common measures of functional integration are pathlength, global efficiency, participation coefficient, etc.
Several lines of research now suggest that the ability to effectively integrate and segregate information may be affected in neurodegenerative disorders. Assortativity is a newer functional segregation measure in the context of network robustness (Newman, 2003; Noldus and Van Mieghem, 2015) that quantifies the homophily of a network. A network is said to be assortated if high degree nodes connect preferentially to other high degree nodes and low degree nodes connect to low degree nodes.
Biological networks are considered disassortative in health with free connection between high and low degree nodes (Newman, 2003). Another segregation measure is modularity, which reflects the presence of modules or communities of regions in a network (Newman, 2006). Previous studies using resting-state functional MR (rsfMRI) in AD have shown increased assortativity (Luo et al., 2021), and increased modularity using structural magnetic resonance imaging (sMRI) (Mijalkov et al., 2017) and 18F-fluorodeoxyglucose (18F-FDG) positron emission tomography (PET) (Gonzalez-Escamilla et al., 2021; Imai et al., 2020).
Further, studies have reported significant correlation between cognitive scores and FDG-PET standard uptake values (SUV), with lower cognitive scores associated with reduced glucose metabolism in brain regions typically impacted by AD, such as the posterior cingulate cortex and the parietal and temporal lobes (Herholz et al., 2011; Ou et al., 2019; Qiao et al., 2022).
FDG-PET benefits from better signal-to-noise ratios and out-of-sample replications than MRI, contributing to its robustness and reproducibility and making it more relevant even in small sample size (Massa et al., 2020; Ripp et al., 2020). Thus, the application of whole brain network connectivity on FDG-PET could be useful in deciphering the network pathobiology of AD.
Previous metabolic connectivity studies have identified alterations in network efficacy (Wei et al., 2021) and modularity (Gonzalez-Escamilla et al., 2021; Imai et al., 2020) in AD. Owing to the relative paucity of data in this field using graph connectivity techniques, we aimed at evaluating various metabolic network measures, including assortativity, and correlating them with the cognitive scores. We hypothesize that given the superior sensitivity of FDG-PET; metabolic connectivity analysis will be able to detect significant network defects in patients with AD compared with MCI.
Methods
Demographic information of participants
This ambispective comparative study cohort consisted of 83 patients with dementia with 56 in the AD group and 27 in the MCI group. All consecutive patients who were referred for PET MRI between 2016 and 2022 were included in the study. The Clinical Dementia Rating (CDR) scale was used to determine the severity of dementia. Cognitive assessment was done using Addenbrooke's Cognitive Examination-III (ACE-III) (Mekala et al., 2020), including memory, attention, language, fluency, and visuospatial domains. CDR scales and ACE-III scores were obtained from the patient case files in the retrospective group.
The diagnosis of MCI was made based on the modified Petersen criteria (Petersen, 2004), while AD was diagnosed in patients who fulfilled the NIA-AA criteria for probable and possible AD (McKhann et al., 2011). Written informed consent and clinical and behavioral scores were obtained from all prospectively recruited participants. The institute's ethics committee approved this study [Ethics NO. NIMH/DO/(BS&NS DIV.) 2019–20].
There were no significant between-group differences in the mean age (MCI 63.52 ± 9.19 years and AD 63.73 ± 9.60 years), gender (M:F) MCI 20:7 and AD 26:30, mean duration of disease (MCI 2.23 ± 1.92 years and AD 2.95), or fasting blood sugar level (MCI 120.8 ± 25.9 and AD 119.4 ± 23.5). However, the disease severity, cognitive scores, and mean years of education significantly differed between the groups (Table 1).
Demographic Information of Participants
ACE-III, Addenbrooke's Cognitive Examination-III; AD, Alzheimer's disease; CDR, Clinical Dementia Rating; F, female; M, male; MCI, mild cognitive impairment; SD, standard deviation.
Acquisition parameters
Subjects underwent sMRI on a 3 Tesla (Biograph mMR) scanner (Siemens, Erlangen, Germany). In the MRI scanner, the subject's head was restrained using foam pads to reduce head motion and provide comfort. 3D T1-weighted Magnetization Prepared Rapid Acquisition Gradient-Recalled Echo (MPRAGE) sequence with 192 sections and a repetition time (TR) of 2300 ms, slice thickness: 1 mm, a field of view (FOV) of 250 × 250 mm, and a matrix resolution of 256 × 256 was used for sMRI. Additional conventional sequences, fluid-attenuated inversion recovery, T2, and susceptibility weighted imaging were acquired, and structural abnormalities were excluded in all patients.
FDG Positron emission tomography
Subjects were administered FDG 185 ± 10%, MBq (5.0 mCi), 30 min before acquiring FDG-PET images in list mode for 15 min. The resulting images had a 256 × 256 matrix, 300 mm FOV, and a voxel size of 2.3 mm × 2.3 mm × 5 mm. Fully 3D or Fourier-rebinned using the ordered subset expectation maximization iterative reconstruction algorithms with three iterations and 35 subsets were used to generate the PET images, which were corrected for standard attenuation, scatter, random coincidences, and decay. In addition, a 5 mm Gaussian post-reconstruction filter was applied for smoothing and image correction purposes.
Pre-processing
FDG-PET: The analysis of the FDG-PET images was performed using PETSurfer analysis tool version 6.05 (Greve et al., 2014). This tool utilizes FreeSurfer results and registers the images into the Montreal Neurological Institute (MNI) space. It also corrects for partial volume effects using a geometric transfer matrix method (Greve et al., 2016), and calculates SUV with the pons serving as a reference region, along with the region's volume size and voxel variance. The FDG-PET images were smoothed with a 10 mm full width at half maximum Gaussian filter, and the cortical surface was parcellated into 34 regions per hemisphere using the Desikan–Killiany atlas (Desikan et al., 2006).
Graph theory measures
To analyze the metabolic connectivity of brain networks, we utilized the BRain Analysis using the graPH theory tool developed by Mijalkov et al. (2017) and available at
To simplify the interpretation of the network, we applied threshold densities to the correlation matrix to generate binary networks, with correlations above the threshold set to 1 and those below set to 0. We used threshold densities ranging from 6 to 50, in steps of 1, to study the variation in global network properties across a range of densities networks (Rubinov and Sporns, 2010). We focused on analyzing assortativity, modularity, and participation coefficient network measures in this study (Fig. 1).

FDG-PET images pre-processing and graph theory analysis pipeline. DK, Desikan–Killiany; FDG, 18F-fluorodeoxyglucose; PET, positron emission tomography; PVC, partial volume correction; sMRI, structural magnetic resonance imaging; SUV, standard uptake values.
Assortativity
Assortativity is a measure of the relationship between the degrees of nodes in a network and the degrees of their neighbors. It quantifies the extent to which nodes tend to connect to other nodes with similar degrees (Newman, 2002).
where r is assortativity, ki and kj are the respective degrees of the nodes i and j, and l is the number of edges in the graph.
Modularity
Modularity reflects the existence of district modules or communities of nodes within a network. Networks with high modularity exhibit dense interconnections among nodes within the same community, while nodes belonging to different modules have a few or sparse connections (Newman, 2006).
where Q is modularity, l is the number of edges in the graph, Aij represents the connectivity matrix, ki kj is the degree of the node i j, and δij is 1 if the two nodes belong to the same community and 0 otherwise, while the sum is performed over all pairs of nodes in the graph.
Participation coefficient
Participation coefficients measure the distribution of a node's edges among the communities of a graph. It measures the proportion of edges that connect a node to nodes outside its community, relative to its total number of edges. By characterizing the nodal network topology, the participation coefficient provides information about how a node's edges are distributed across different communities (Joyce et al., 2010).
where the sum runs over all communities, Pi is participation coefficient, Ksi is the number of edges connecting the node i within its community Si , and Ki is the total number of edges of node i. We also computed the path length, clustering coefficient, small-worldness, and global and local efficiency.
Validation analysis
To ensure replicability and reproducibility of the method, Alzheimer's Disease Neuroimaging Initiative (ADNI;
There were no significant between-group differences in the mean age AD 74.64 ± 9.05 years, MCI 75.12 ± 8.21 years, and CN 78 ± 9.34 and, gender (M:F) AD 31:22, MCI 12:13 and CN 11:12. However, we do note the significant increased mean age in both AD and MCI groups when compared with the current study. The data were acquired in PET/computed tomography scanners 30 min after 5 mCi of 18F FDG for a duration of 30 min. For the current study, only the first 15 min of data were used for analysis to maintain the comparability of results. The image processing pipeline was maintained identically between primary and validation analysis.
Statistical analysis
The demographic and clinical profile differences between AD and MCI were assessed using a t-test for continuous variables and a Chi-square test for categorical variables. Pearson's correlation was used to examine the relationship between the participants' cognitive score and regional SUV. Metabolic connectivity matrices of MCI and AD were computed from Pearson's correlational matrix. The non-parametric permutation tests with 5000 permutations were conducted to assess differences between MCI and AD for network computation.
These were considered significant for a two-tailed p value based on 95% confidence intervals. In addition, to network results for multiple comparisons, an false discovery rate procedure was applied. An additional comparison of CN versus AD was also performed in the validation analysis derived from the ADNI data.
Results
Metabolic connectivity
The whole brain metabolic connectivity was higher in MCI (0.71 ± 0.15) than AD (0.47 ± 0.21; p = 8.36e-13) and effect size (d = 1.35, p < 0.01). The mean metabolic connectivity matrices of MCI and AD are demonstrated in Figure 2.
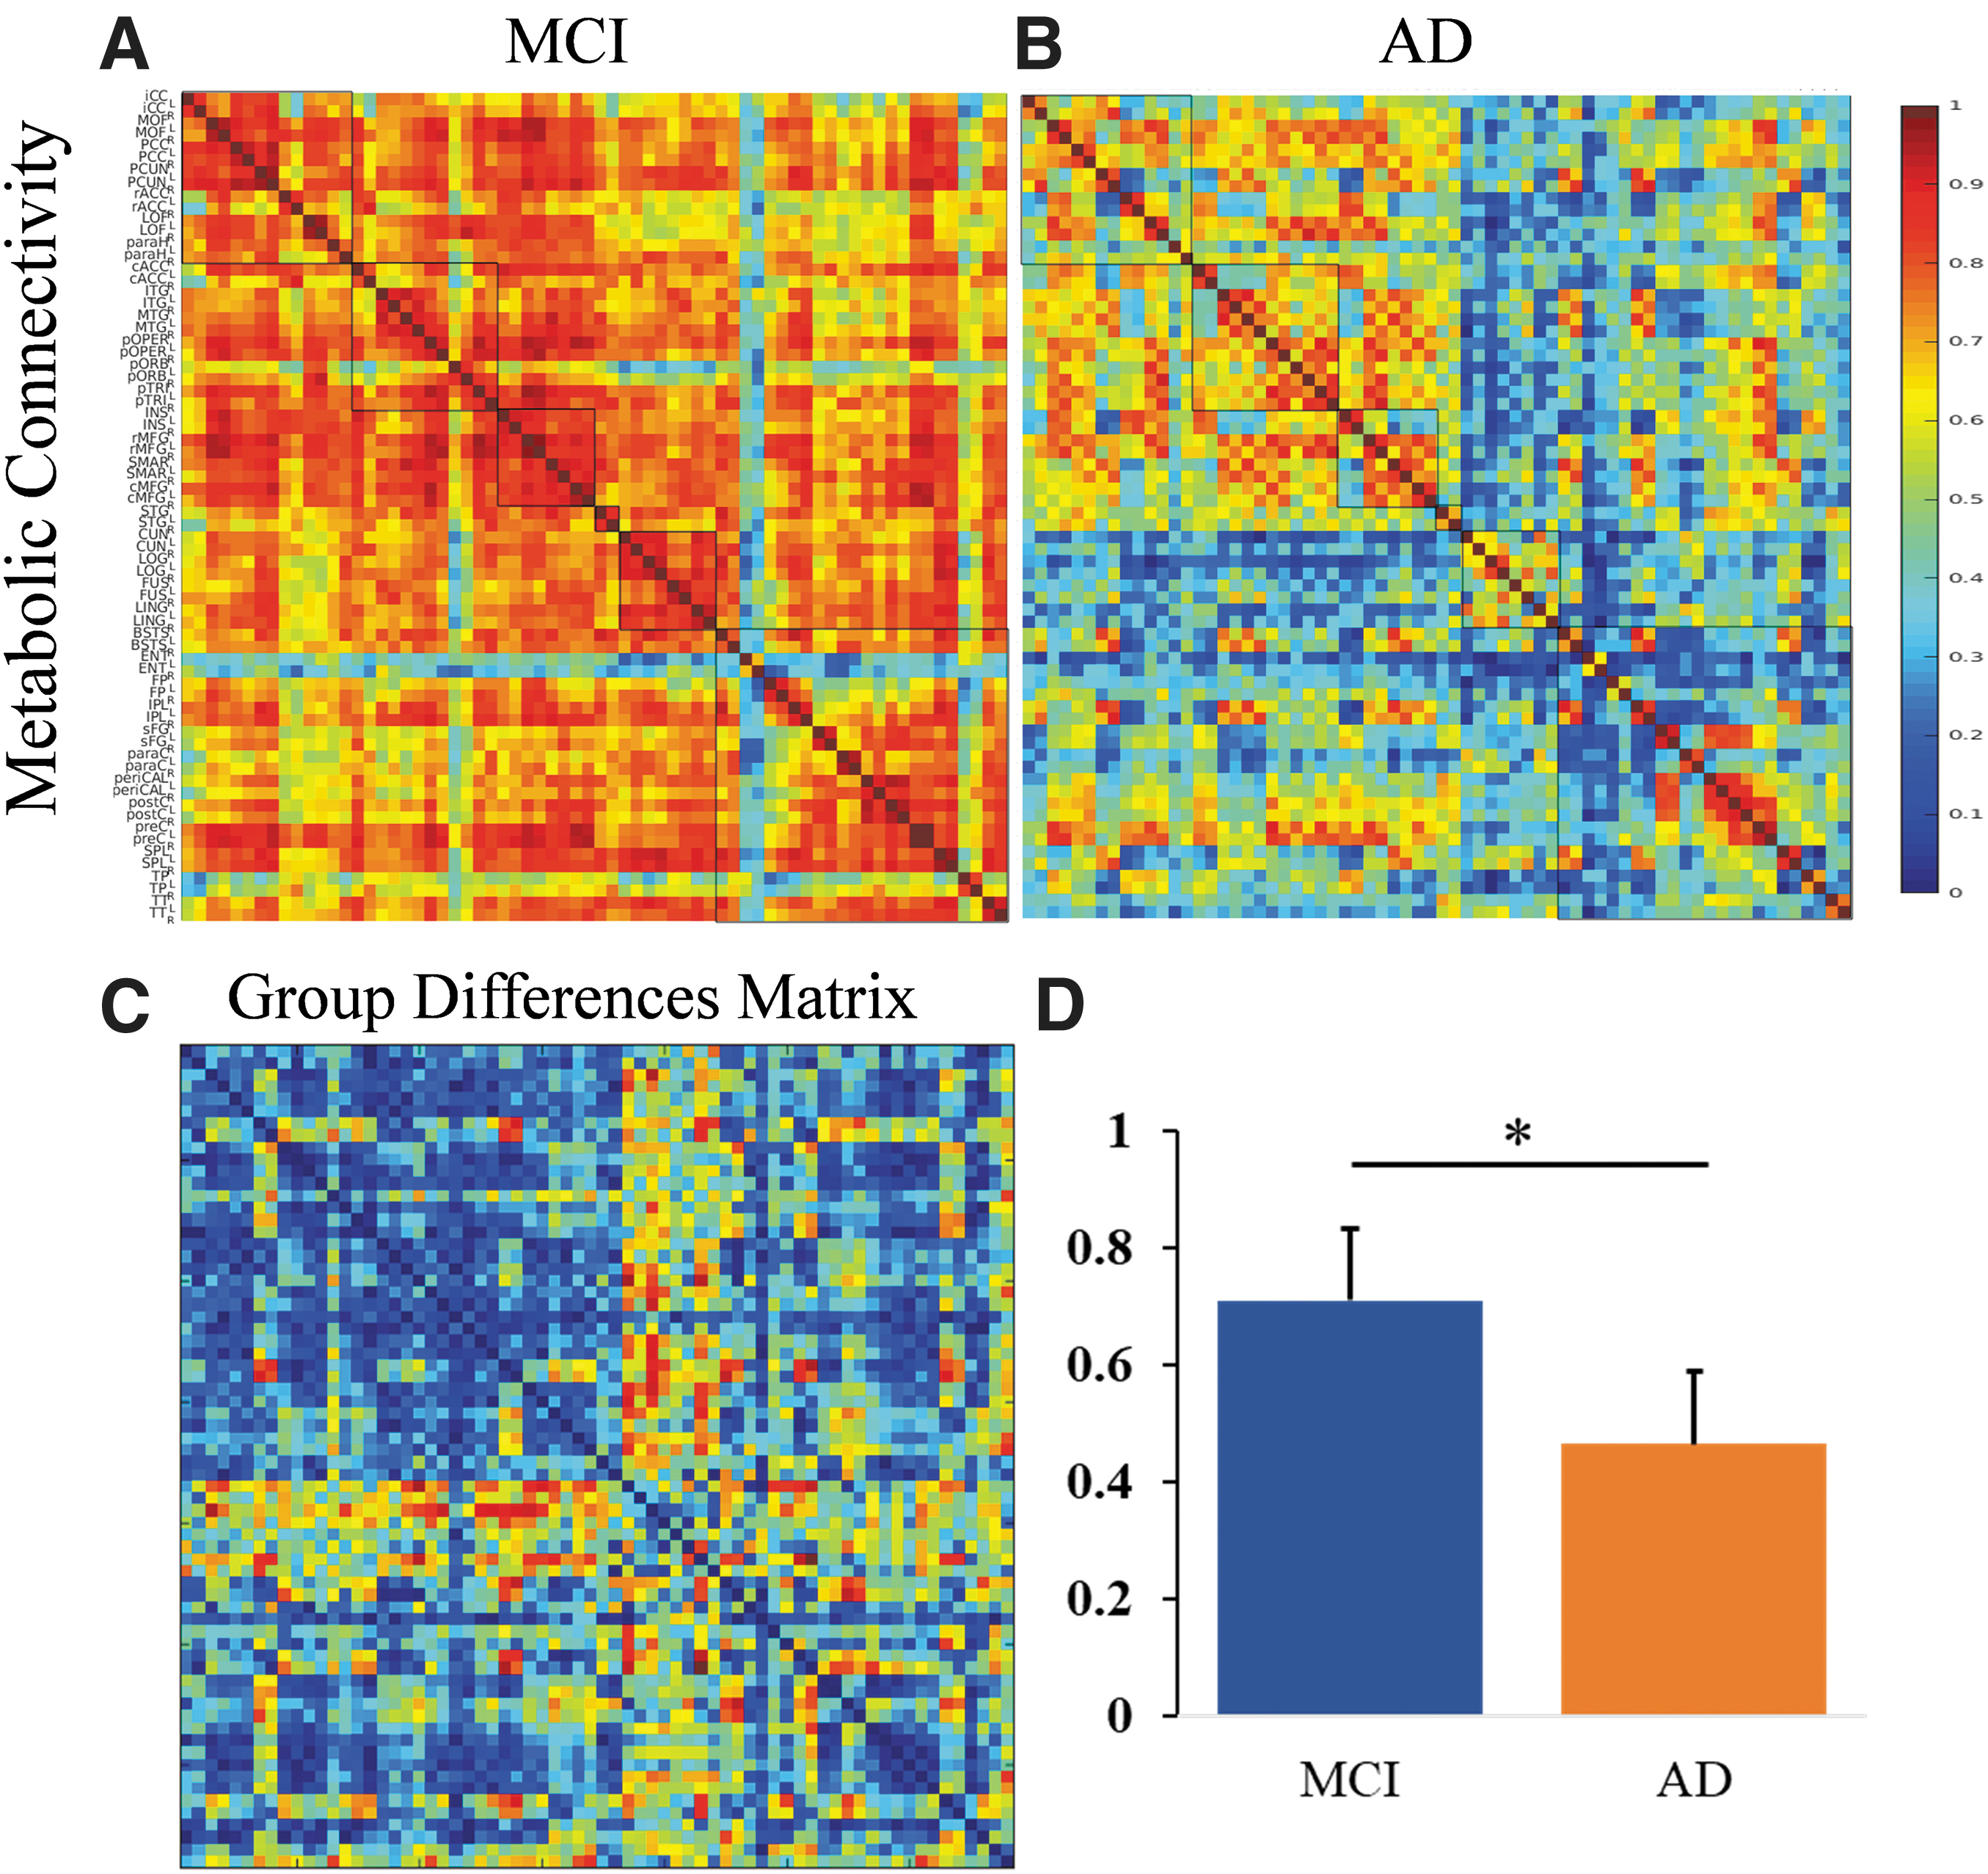
The panel shows the metabolic connectivity matrix in
Global network differences between MCI and AD
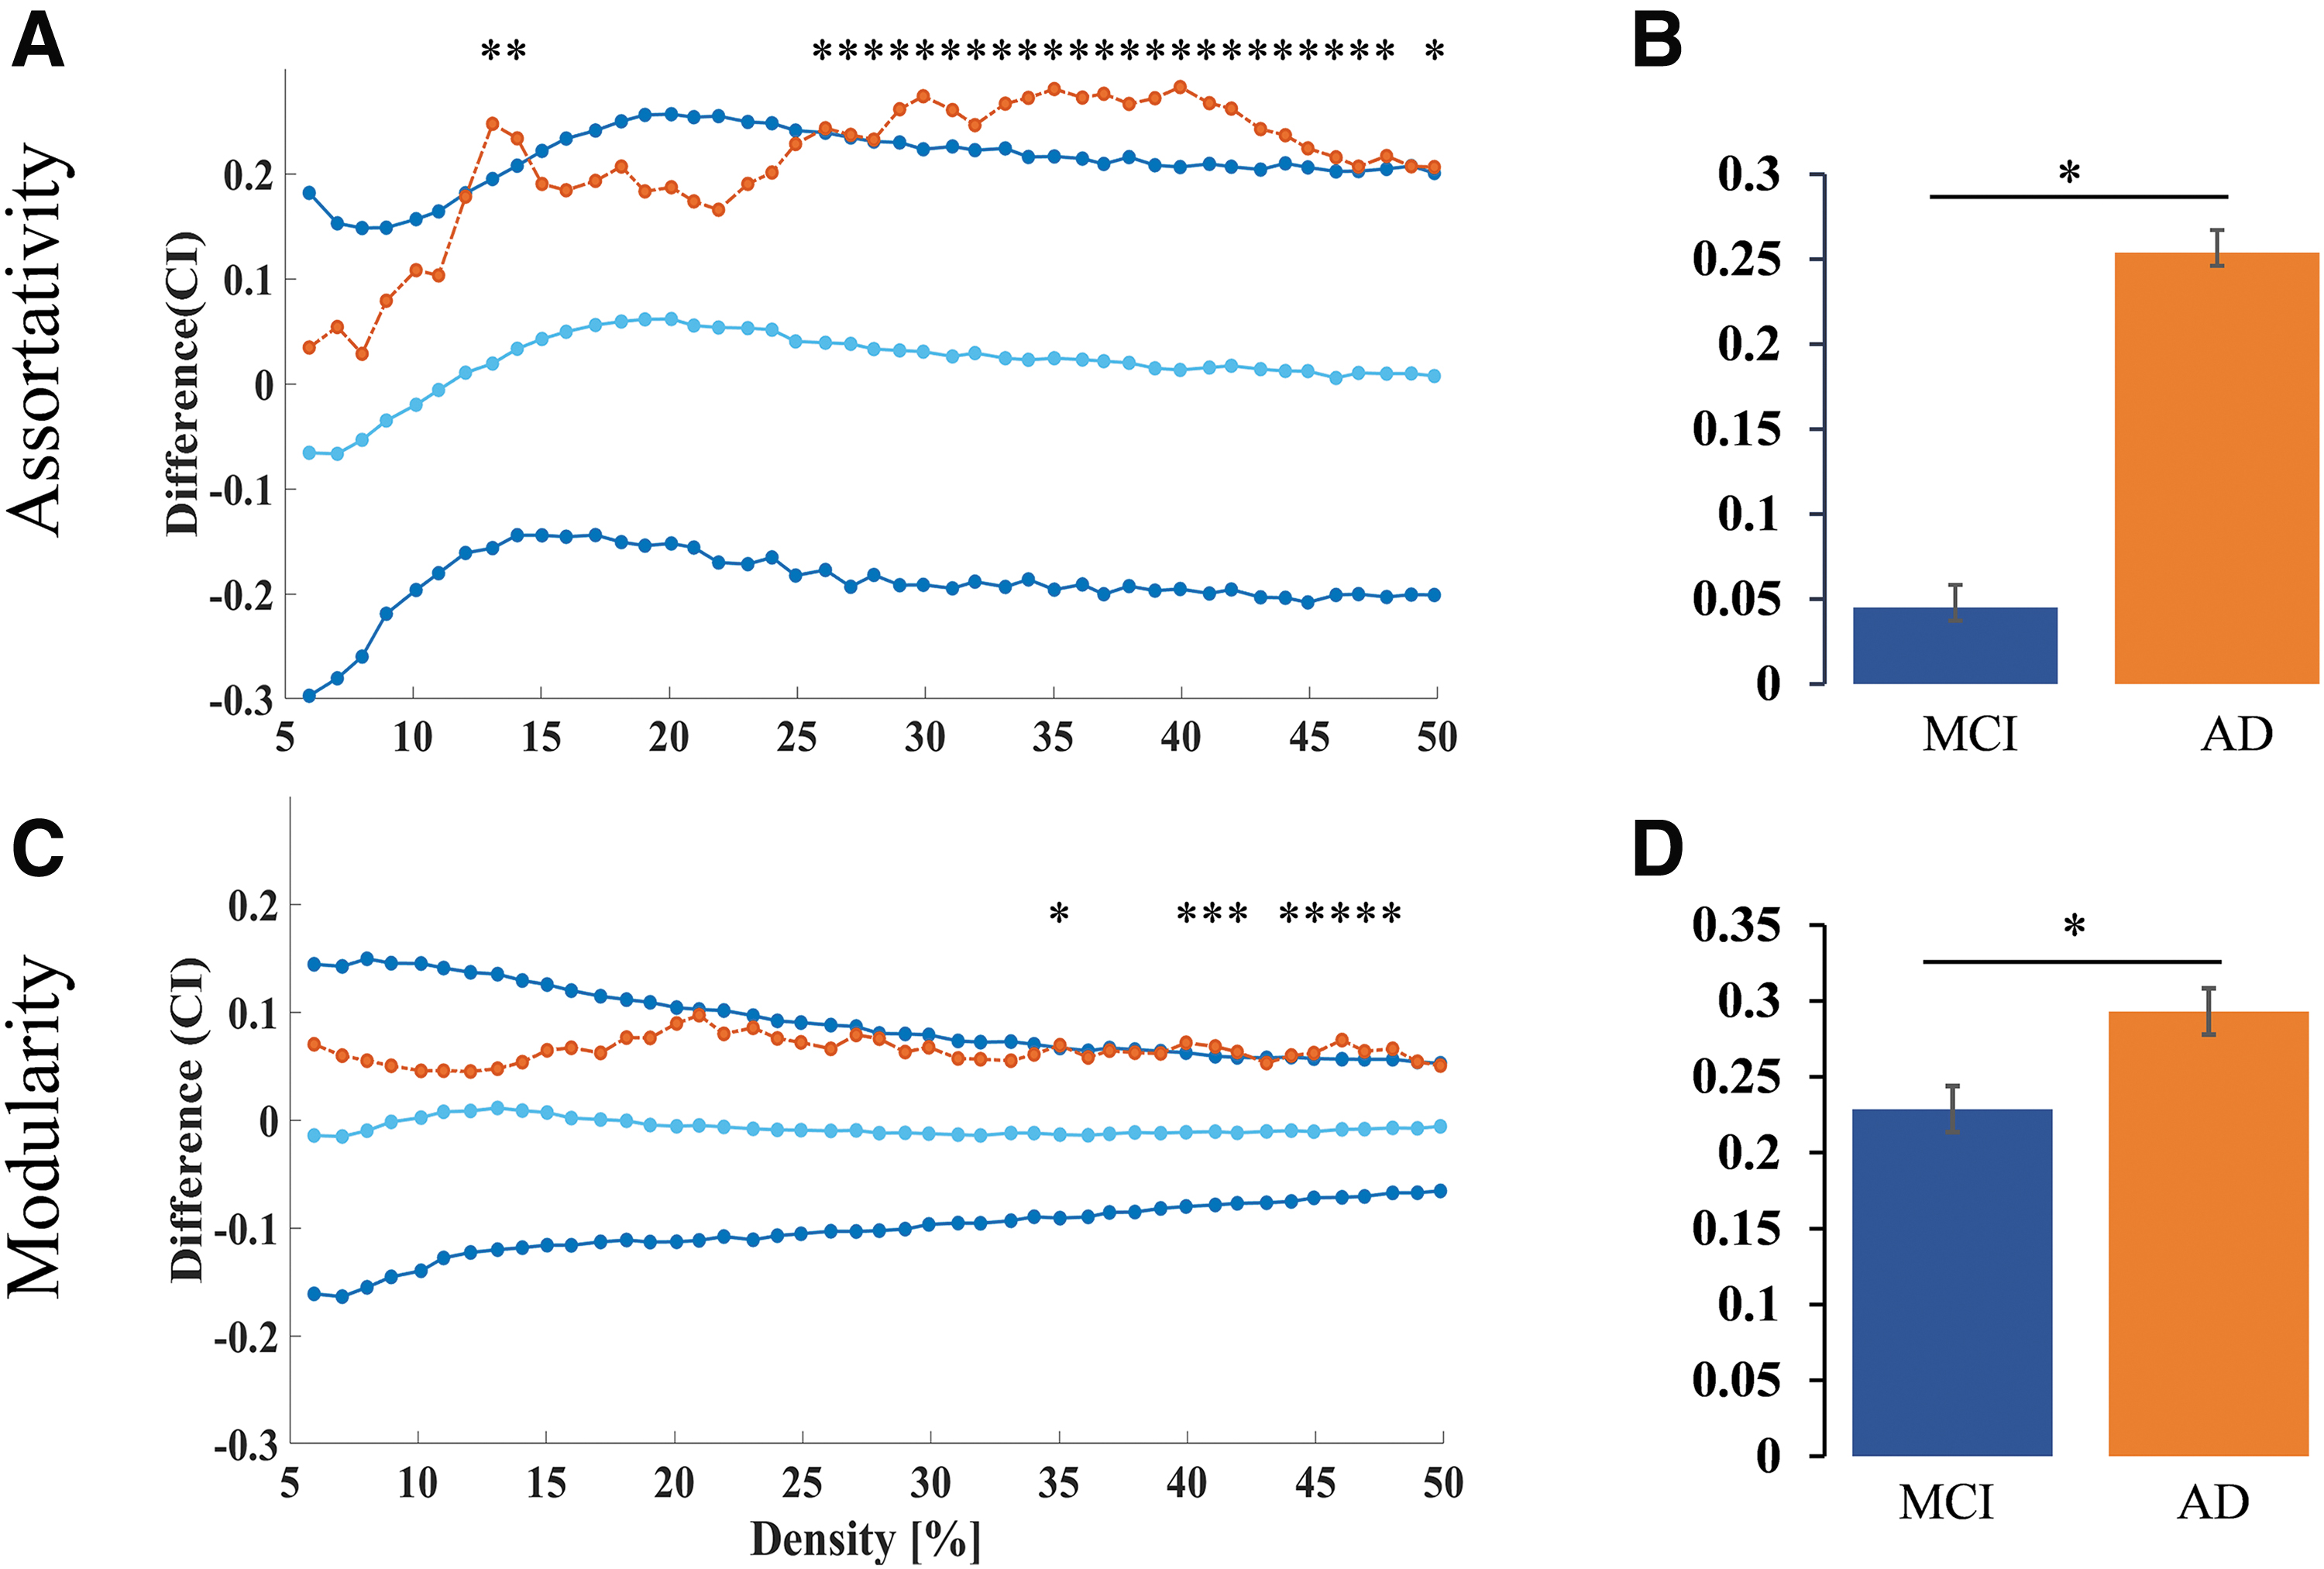
Metabolic network measures revealed higher measures of network segregation in patients with AD compared with MCI. Global metabolic assortativity (density level 13, 14, 26 to 48, 50; Fig. 3A, B) and modularity (density level 35, 40 to 42, 44 to 48; Fig. 3C, D) were found to be higher in AD in comparison with MCI. Within-group analysis of network differences in patients with AD with varying severity (moderate vs. severe) did not reach significance.
Validation analysis
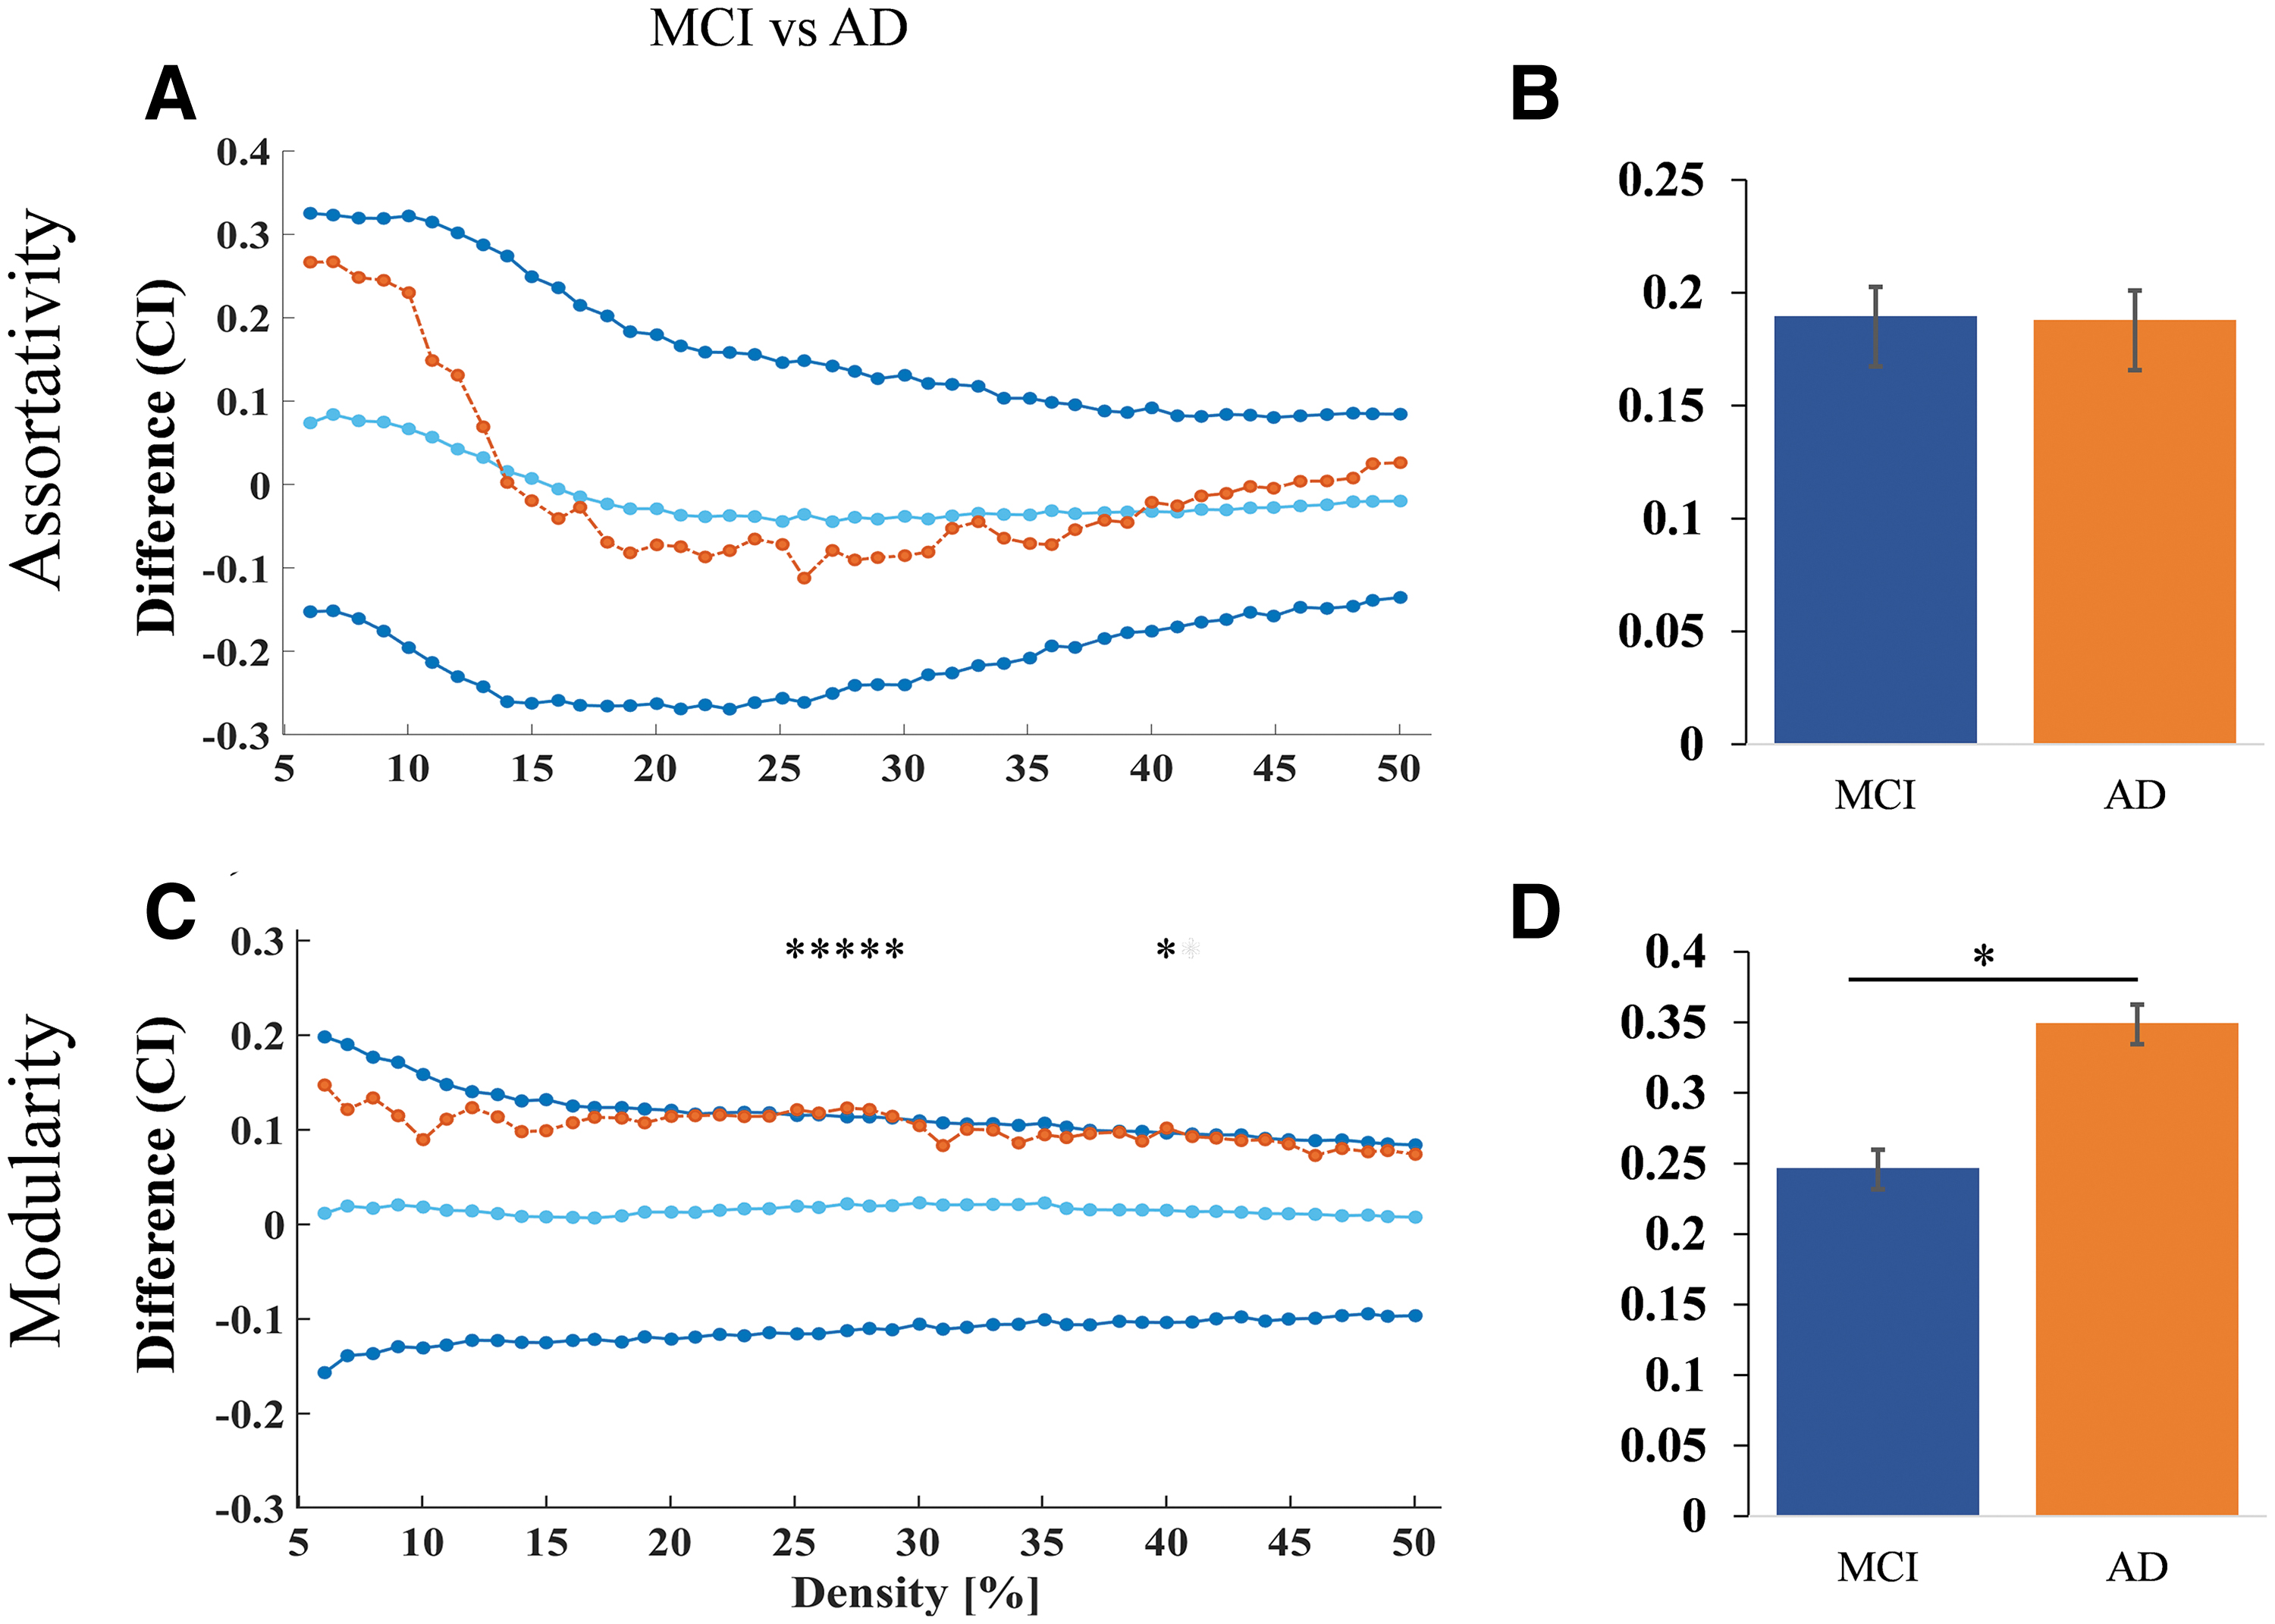
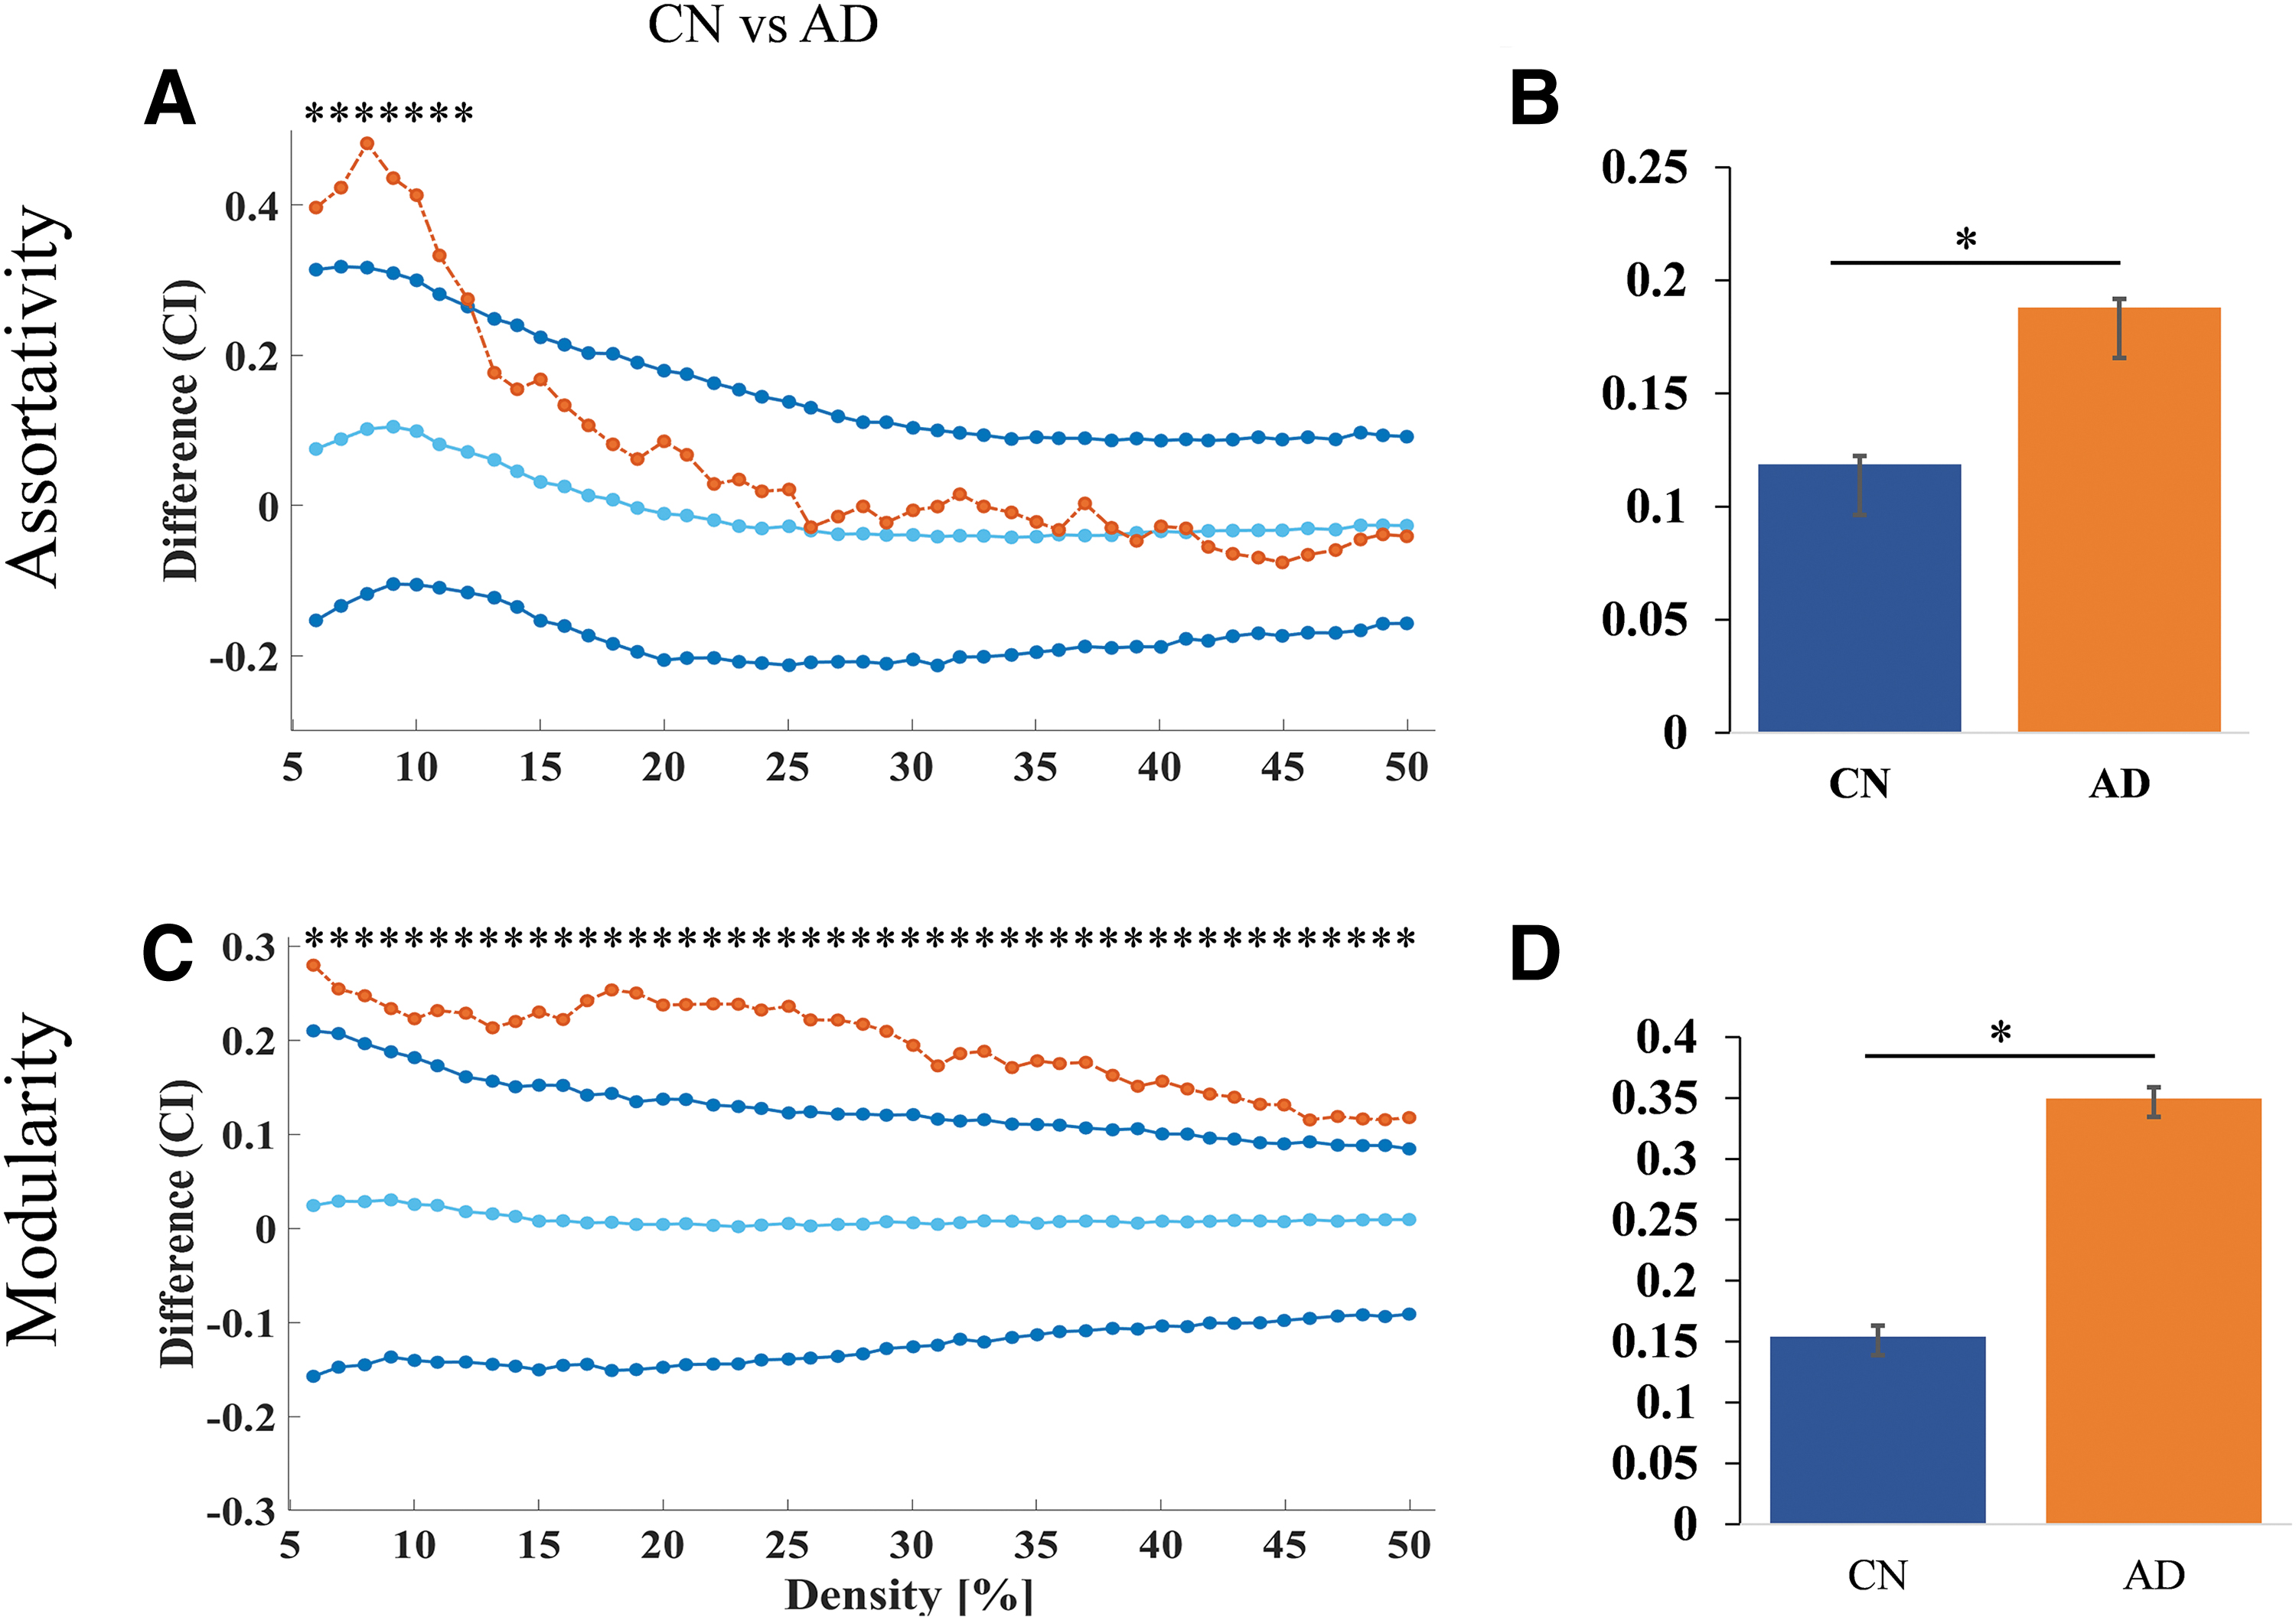
Graph theory measures were used to compare the CN versus AD and MCI versus AD groups. The results showed that for both comparisons, the AD group had higher values for modularity at the density 25 to 30, 40 than the MCI group (Fig. 4C, D) and assortativity did not show significant difference between AD and MCI (Fig. 4A, B). The AD group also had higher values for assortativity at the density level 6 to 12 (Fig. 5A, B) and modularity at the density level 6 to 50 compared (Fig. 5C, D) with the CN group.
Nodal network differences between MCI and AD
Widespread changes were seen with decreased participation coefficient in patients with AD compared with MCI. The regions that showed significant changes are shown in Figure 6 and detailed in Supplementary Table S1.
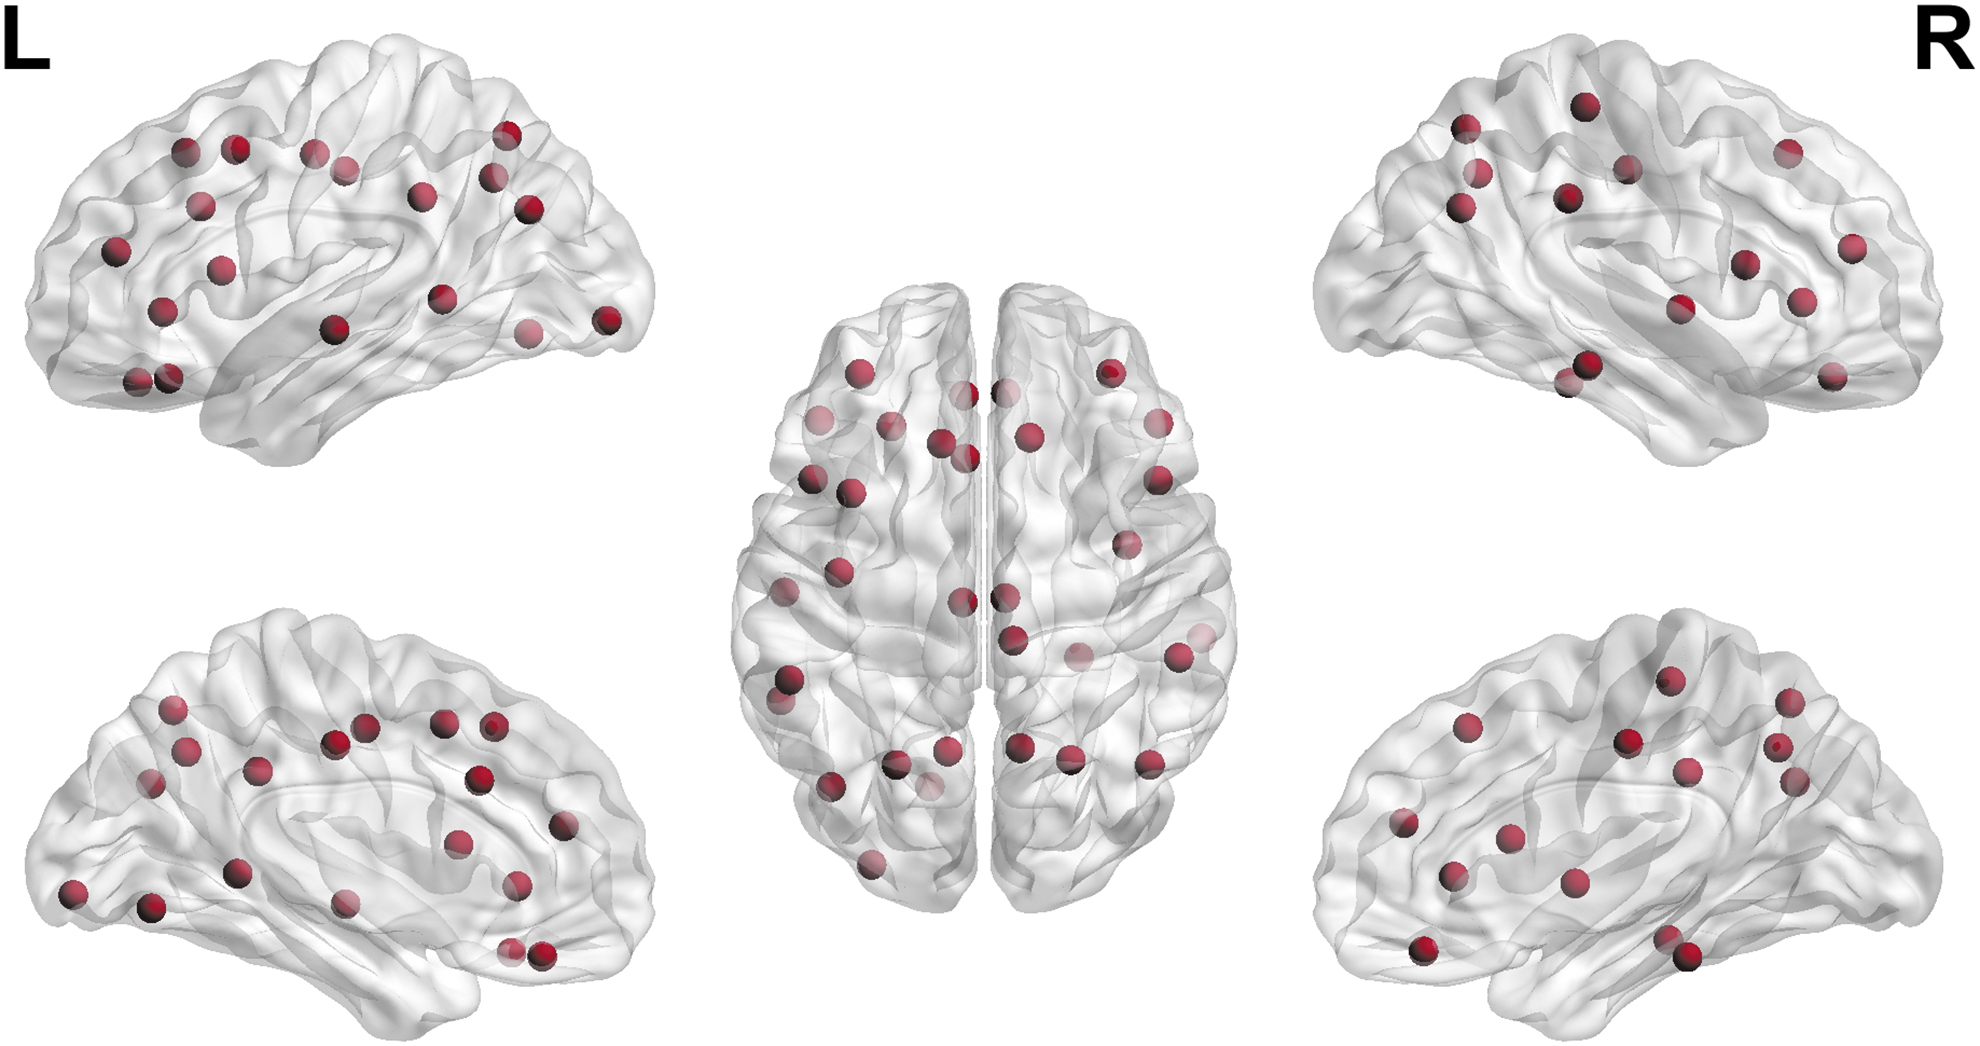
Participation coefficient showing nodes with significant between-group differences in metabolic connectivity.
Correlation with cognitive scores
SUV of the nodes that revealed significant between-group differences were used to evaluate their correlation with cognitive scores. A significant correlation was observed in the following regions (left-bank of superior temporal sulcus, superior parietal, inferior parietal, supramarginal, precuneus, caudal middle frontal, rostral middle frontal, pars opercularis, pars triangularis posterior cingulate, lateral orbitofrontal, superior temporal, right- middle temporal, superior parietal, inferior parietal, supramarginal, precuneus, pars opercularis, rostral middle frontal, pars triangularis and posterior cingulate; Fig. 7A, B; Supplementary Table S1).
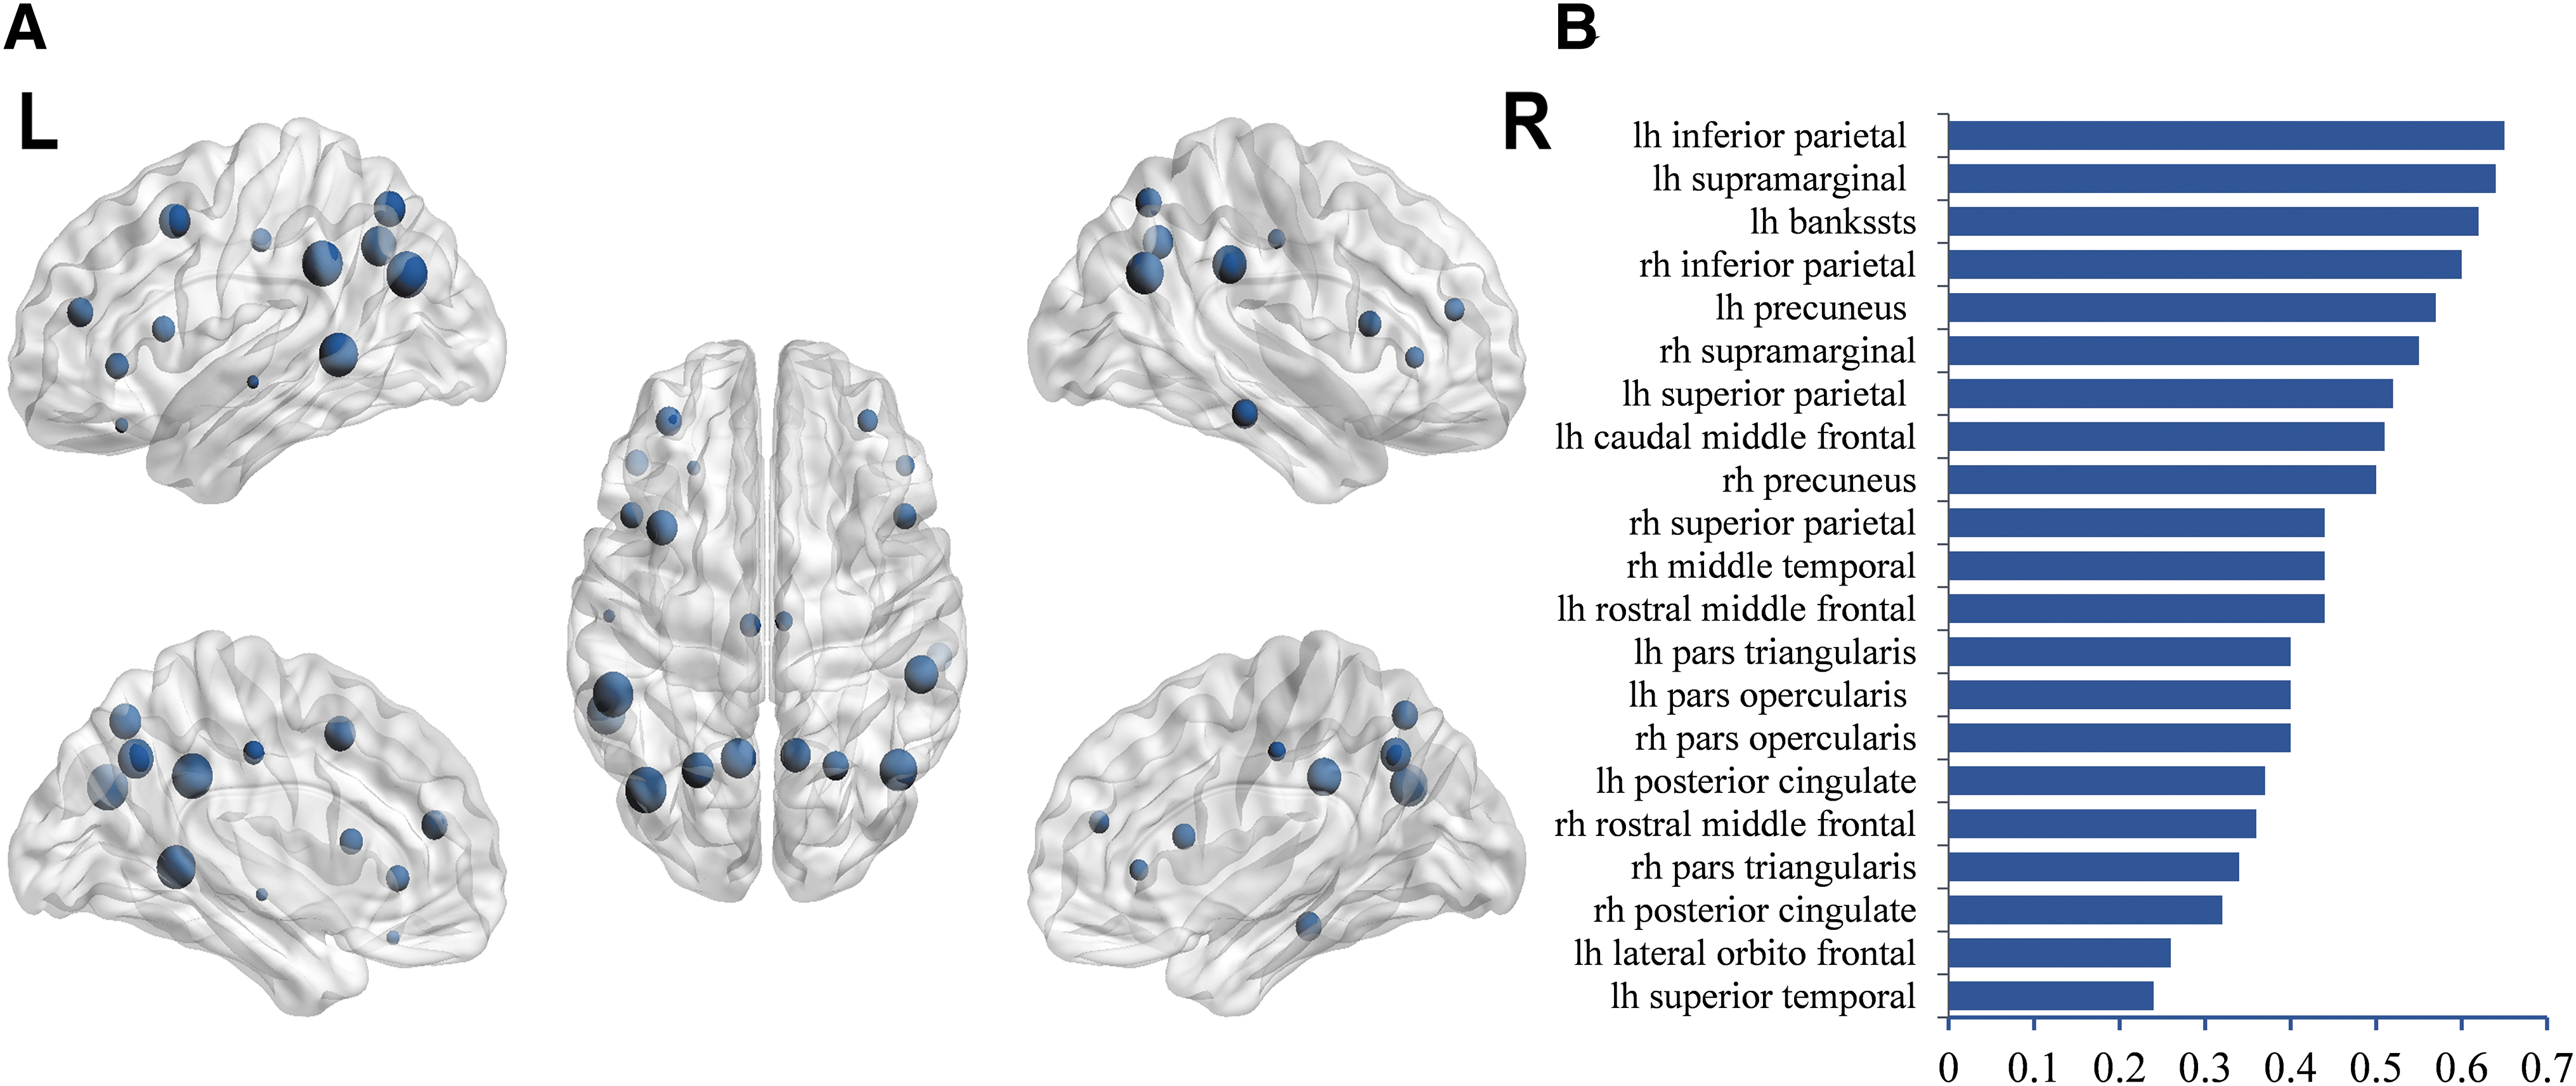
Stepwise logistic regression analysis was done using subdomains of the ACE-III scores and regions that revealed significant between-group differences. The main differentiating variables were the association of memory with the SUV of the left superior bank of superior temporal sulcus and right superior parietal gyrus.
Since the years of education was significantly different between the groups, we did simple correlation between the years of education and SUV measures and found no significance.
Discussion
In this study, we characterized network alterations in AD as compared with MCI using metabolic connectivity measures, validated the findings with ADNI data, and correlated the findings with cognitive scores. We found that AD was associated with increased assortativity and modularity measures when compared with MCI in our study and when compared with healthy controls in the ADNI data.
Nodal network properties revealed altered participation coefficients in several regions predominantly involving the parietal, temporal, and frontal regions bilaterally. Stepwise logistic regression revealed an association of the memory subdomain with the SUV in the right superior parietal and left superior temporal lobes.
Based on the criteria that assume biological systems to be disassortative in healthy, the evidence of increasing homophily of the network in AD could be interpreted as a feature of network pathobiology as increased network assortativity makes it more regular and thus less resilient to attacks (Newman, 2002).
It needs to be noted that the increasing homophily of dominant nodes with high centrality, which defines the “rich club” phenomenon, is different from the homophily seen in assortativity because the latter feature is a measure of quasi-local properties of the nodes in the network and the former is derived from a restricted set of global features.
Altered assortativity of networks in AD has been reported previously in AD, with evidence of increasing assortativity in one study (Luo et al., 2021) and decreasing in another study (Fathian et al., 2022) using rsfMRI. The apparent differences in the results could be driven by differences in the choice of the methods, analysis techniques, or stages of the disease but amplified mainly by the relatively small sample sizes in all these studies, including the current study. But since in the current study, we have evidence for the same phenomenon even in the validation analysis using ADNI data when compared with both MCI and CN subjects, we presume that increasing assortativity could be a feature of neurodegeneration in AD.
In network neuroscience, networks with dense connections within nodes of their own community and loose connections with other communities are defined as modular (Newman, 2006). Research in this field has provided substantial evidence that the optimum modularity of human brain networks makes it efficient while conferring superior resilience against disease or injury (Achard et al., 2006).
Regardless of the differences in the investigative methods, it has been found that the morphology of these brain modules varies across time and between individuals, at rest and during a task, and is also modifiable by the training (Bassett et al., 2011). Strengthening of hub edges, making the modular brain more segregated, has been reported in healthy aging (Baum et al., 2017).
This accentuated segregation of networks is associated with improved executive functioning during the normal development of the brain (Baum et al., 2017). It needs to be stressed that an optimum level of modularity is imperative for efficient brain function, and both increase and decrease in modularity have been reported in the disease (Alexander-Bloch et al., 2010; Peraza et al., 2015).
In the current study, we found that patients with AD had increased network modularity compared with patients with MCI. Higher network modularity has been reported previously in patients with AD using sMRI (Mijalkov et al., 2017) and FDG-PET (Gonzalez-Escamilla et al., 2021; Imai et al., 2020) as is reducing modularity with disease (Brier et al., 2014).
Along with the increased modularity at the global level, we also noticed decreased participation coefficient in several brain regions in metabolic connectivity nodal analysis. Decreased participation coefficient is a measure of decreased brain integration reflecting a decrease in the number of nodes that facilitates connections between modules.
Due to the strengthening of hub edges, a decreasing participation coefficient has been reported in healthy aging (Baum et al., 2017). This reduced integration is associated with improved executive functioning during the normal development of the brain (Baum et al., 2017). We presume that decreased integration that is seen as part of healthy aging might be different from what happens in AD because, while in healthy aging, the decreased integration leads to improved executive performance, the same process leads to executive dysfunction in AD. It is possible that there may be an optimum level of integration that preserves function, while an accelerated or exaggerated change in network integration could make it dysfunctional.
The results of the current study thus add to the ample existing evidence in the literature supporting loss of brain integration and increased segregation as dominant network pathology features in patients with AD (Pereira et al., 2016; Sheng et al., 2020; Wei et al., 2021). In addition, the evidence of increased assortativity from metabolic connectivity analysis in the current study has furthered the knowledge in this field.
Reducing integration, probably influenced by erroneous network homophily, could also be part of the network pathobiology in AD. Longitudinal big data analysis using large samples will be required to explore this further and confirm the usefulness of these measures in the clinical management of patients.
In the current study, nodal analysis of metabolic networks revealed that the SUV alterations in the right superior parietal and left superior temporal gyrus were proportional to the memory scores. The right superior parietal gyrus is a multimodal association cortex that plays a crucial role in memory, especially spatial storage and episodic memory (Wager and Smith, 2003; Wagner et al., 2005).
Superior parietal gyrus is important in working memory, including updating, organizing, and controlling information, all of which are critical elements in the novice learning (Crocco et al., 2018; Prawiroharjo et al., 2020; Wager and Smith, 2003; Zou et al., 2013). Loss of memory is one of the earliest complaints in patients with AD, and the earliest neuropathological evidence of neurofibrillary tangles is seen to affect areas with poorly myelinated areas, like parietal lobe and limbic system, probably because it consumes more energy compared with well-myelinated areas (Jacobs et al., 2011).
Several studies have documented superior parietal gyrus atrophy in AD (Bakkour et al., 2013; Buckner et al., 2005; Klaassens et al., 2017; Prvulovic et al., 2002; Teipel et al., 2007) supporting the importance of parietal lobe involvement in AD. Similarly, the superior temporal gyrus is also a multimodal association area. The middle and inferior frontal gyri also play a critical role in the general encoding and retrieval of memory domains. This region is one of the critical areas of damage in the AD language variant, and anomia was correlated with the thickness of the superior temporal gyrus (Leyton et al., 2017).
In summary, metabolic network analysis in the current study validated using ADNI data, processed using similar pipelines to reduce heterogeneity, has found increased assortativity, increased modularity, and decreased participation coefficient as prominent network alterations in AD, making the disease network more regular and simplified.
Network alterations, apart from providing a mechanistic basis for understanding disease neurobiology, have also been found to be helpful in assessing response to therapy with strategy-based cognitive therapy in patients with traumatic brain injury, revealing decreasing modularity and increasing participation coefficient proportional to the behavioral scores as a function of the therapy (Han et al., 2020).
Higher modularity was found to have associations with better physical activity and cognitive activity independent of the apolipoprotein E4 genotype, amyloid burden, global brain atrophy, vascular risk, and cognitive reserve in patients with AD, suggesting that network structure is also an important protective factor that could predict the progression of disease (Soldan et al., 2021). Thus, understanding network pathology in neurodegenerative diseases could help in quantifying and early diagnosis of these diseases and in understanding appropriate preventive measures that could potentially delay such conditions progression.
This study is not without limitations. Network analysis of healthy aging could not be done due to lack of PET using healthy controls. However, publicly available data, which included controls, was used to validate the findings externally. In the validation analysis, it needs to be noted that higher assortativity in AD compared with MCI did not reach statistical significance probably because of the higher mean age of MCI in ADNI data.
Second, since the study involved metabolic connectivity analysis, we used Desiken Killainy atlas, and this parcellation scheme did not include subcortical brain regions, notably the hippocampus region. We acknowledge that the number of brain regions in the parcellation template could considerably influence macroscopic brain networks.
Some studies have suggested that using medium- and high-resolution templates may positively impact the consistency of graph measures. This effect may be related to a relatively lower influence of network order at these resolutions. It is known that both AD and MCI are clinically heterogenous phenotypes with several subtypes available in both groups. We have not tested the reliability of these network measures in the subtypes of AD due to smaller subgroups.
Conclusions
Network alteration in AD is associated with homophily and high segregation. Metabolic alterations in the multimodal association areas in superior parietal and superior temporal lobes correlated with the memory scores, add further clinical meaning to this network alteration.
Footnotes
Acknowledgments
The authors would like to acknowledge the participants who took part in this study and the staff at the PET-MRI facility for their assistance in data acquisition. They would like to express their gratitude to the National Institute of Mental Health and Neurosciences (NIMHANS) for providing the resources. Data used in preparation of this article were obtained from the Alzheimer's Disease Neuroimaging Initiative (ADNI) database (
Authors' Contributions
S.K.K., R.D.B., and S.A. conceptualized and designed the experiment. S.A., F.A., S.R., and S.K. did the clinical assessment of the patients scoring for inclusion criteria. S.K.K., S.M., M.K., and C.N. acquired the PET data. T.M. performed neuropsychological assessments. S.K.K. analyzed the data, and S.K.K., R.D.B., N.T., S.A., M.K., and T.K.G. interpreted the results. R.D.B., M.K., T.K.G., S.A., S.M., and C.N. supervised the method development. R.D.B., C.N., M.K., S.A., S.R., T.K.G., S.M., and F.A. provided a critical review. S.K.K. and R.D.B. wrote the manuscript. All the authors interpreted the results, edited, and approved the manuscript. There is no conflict of interest from any authors in this study.
Author Disclosure Statement
The authors of this manuscript declare that they have no conflicts of interest to disclose concerning the contents of this research paper.
Funding Information
This research received no specific grant from any funding agency in the public, commercial, or not-for-profit sectors. The authors independently conducted the study, and all necessary resources and materials were provided by NIMHANS.
Supplementary Data
Supplementary Table S1
References
Supplementary Material
Please find the following supplemental material available below.
For Open Access articles published under a Creative Commons License, all supplemental material carries the same license as the article it is associated with.
For non-Open Access articles published, all supplemental material carries a non-exclusive license, and permission requests for re-use of supplemental material or any part of supplemental material shall be sent directly to the copyright owner as specified in the copyright notice associated with the article.
