
Abstract
Introduction:
In resting-state functional magnetic resonance imaging (rs-fMRI) studies, global signal regression (GSR) is a controversial preprocessing strategy. It effectively eliminates global noise driven by motion and respiration but also can introduce artifacts and remove functionally relevant metabolic information. Most preclinical rs-fMRI studies are performed in anesthetized animals, and anesthesia will alter both metabolic and neuronal activity.
Methods:
In this study, we explored the effect of GSR on rs-fMRI data collected under anesthetized and awake state in mice (n = 12). We measured global signal amplitude, and also functional connectivity (FC), functional connectivity density (FCD) maps, and brain modularity, all commonly used data-driven analysis methods to quantify connectivity patterns.
Results:
We found that global signal amplitude was similar between the awake and anesthetized states. However, GSR had a different impact on connectivity networks and brain modularity changes between states. We demonstrated that GSR had a more prominent impact on the anesthetized state, with a greater decrease in functional connectivity and increased brain modularity. We classified mice using the change in amplitude of brain modularity coefficient (ΔQ) before and after GSR processing. The results revealed that, when compared with the largest ΔQ group, the smallest ΔQ group had increased FCD in the cortex region in both the awake and anesthetized states. This suggests differences in individual mice may affect how GSR differentially affects awake versus anesthetized functional connectivity.
Discussion:
This study suggests that, for rs-fMRI studies which compare different physiological states, researchers should use GSR processing with caution.
Impact statement
Global signal regression (GSR) is a commonly used denoising technique, however, it can also introduce specific artifacts. In functional connectivity (FC) studies of functional magnetic resonance imaging, it is crucial to examine the impact of GSR on animals under various anesthesia conditions. Our results showed that GSR had distinct effects on FC and modularity of awake versus anesthetized mice. Therefore, caution should be taken when using GSR to remove noise, especially when comparing different neurometabolic states.
Introduction
Functional magnetic resonance imaging (fMRI) is a noninvasive and robust method for studying brain function (Biswal et al., 1995; Schifani et al., 2022). Due to its ease of signal acquisition, resting-state fMRI (rs-fMRI) is one of the most commonly used fMRI techniques for obtaining information about the continuous and internal neural activity that supports cognitive function (Smitha et al., 2017). rs-fMRI can identify brain networks similar to those observed under task- or stimulation-induced conditions, and has been used to develop biomarkers for numerous neurodegenerative disorders and neurological diseases (Guerra-Carrillo et al., 2014; Harrewijn et al., 2020; Martin et al., 2021).
rs-fMRI recordings of spontaneous fluctuations of blood-oxygenation-level-dependent (BOLD) signals contain contributions from physiological and nonphysiological sources. Denoising aims to separate the neuronal component of the BOLD signal from the physiological and nonphysiological signals (Parkes et al., 2018; Power et al., 2017). Global signal regression (GSR) is one of the most controversial denoising steps (Li et al., 2019; Murphy and Fox, 2017; Uddin, 2017). GSR uses linear regression to remove the average whole-brain signal from each voxel, because the global signal (GS) is associated with motion, respiration, and heartbeat artifacts (Burgess et al., 2016; Liu et al., 2017; Power et al., 2018). Thus, GSR effectively removes global artifacts caused by movement and other physiological sources (Ciric et al., 2017; Power et al., 2014).
However, GSR can also introduce specific artifacts in fMRI data, such as “artificial” anticorrelations in modeled data, which were created without such anticorrelations originally (Anderson et al., 2011; Murphy et al., 2009; Xu et al., 2018). In addition, GSR can lead to false differences in functional connectivity (FC) in studies of psychiatric diseases, for example, schizophrenia (Parkes et al., 2018; Yang et al., 2014). These findings indicate that although advantages exist to using GSR, it may cause unexpected changes, particularly when comparing multiple groups.
The majority of experiments studying FC changes in animal disease models are conducted under general anesthesia to reduce the effects of motion artifacts and stress responses (Grandjean et al., 2014; Lukasik and Gillies, 2003). However, the effects of anesthesia on fMRI signals are substantial (Gao et al., 2017; Liang et al., 2015; Paasonen et al., 2018; Xie et al., 2021). More and more studies have demonstrated that anesthetics can affect neural activity (Bharioke et al., 2022; Yatziv et al., 2020), the source of the fMRI signal. Hamilton et al. (2017) observed that FC was significantly altered within the thalamocortical and frontoparietal networks under awake versus unconscious conditions. Furthermore, anesthesia also affects the physiological function of experimental animals, reducing the brain's energy metabolism, altering the function of neural circuits, and altering the organization of brain networks.
Recent development of an awake mouse model has demonstrated that awake and anesthetic states have specific fMRI characteristics (Sitsen et al., 2022). Liang et al. (2015) showed weaker coactivated patterns in the anesthetized state compared with the awake state. Dinh et al. (2021) compared BOLD responses from anesthetized and awake mice under visual stimulation. They observed that mice in the awake state had faster BOLD responses in active regions and also had stronger responses in subcortical areas, in comparison with the anesthetized state (Dinh et al., 2021). These findings demonstrate that fMRI signals are altered by different anesthetic conditions. Because of the large effects of anesthesia and GSR, it is likely that they may interact in unpredictable ways. In particular, specific networks may be affected by GSR differently whether under anesthesia or not.
In this work, we aim to investigate the impact of GSR on resting-state FC under awake and anesthesia conditions. Moreover, we examine whether and to what extent GSR affects FC between these conditions. We used FC, functional connectivity density (FCD) mapping, and network modularity to quantify the effect of GSR. We observed that both FC networks and brain modularity are altered between awake and under anesthesia and that GSR has a more pronounced influence during anesthesia.
Materials and Methods
Animals
This study uses data from the same experimental animals and imaging sessions as Xu et al. (2022), however, this work examines BOLD-fMRI data that were collected but not analyzed in that previous work.
All animal experiments were approved by the Institutional Animal Care and Use Committee of ShanghaiTech University and were consistent with the governmental regulations of China for the care and use of animals. Fifteen male, adult, C57BL/6 mice, 7–9 weeks old and weighing 20–30 g, were imaged under awake and anesthetized conditions.
Mice were prepared for awake imaging in the same manner as in previous studies (Han et al., 2019). Briefly, a head brace was installed on each animal's skull to allow fixation of the head. The animals were allowed to recover for 1 week after surgery. After that, the animals were trained to acclimatize to awake imaging for a week. The mice were first imaged awake and again ∼1 week later under anesthesia. This order was used due to the concern that exposure and recovery from dexmedetomidine (Dex) could cause trauma if lucid imaging was performed later. Notches at the edge of the ear of each mouse were cut with scissors, to identify the same mouse under different conditions. Mice were euthanized after the second (Dex) scan. In total, data were collected from 12 mice, for details on sample size selection and mice, including excluded data, see Xu et al. (2022). This study used the same mice data as that study.
Animal preparation
Mice were given a total concentration of 37% medical air (20% O2, 80% air) during imaging, and respiration was monitored using pneumatic pillows. When imaging under anesthesia (“Dex” condition), mice were initially induced by 3.5% isoflurane, and 1.5% isoflurane was used in the imaging preparation process. A total of 0.025 mg/kg Dex was injected intraperitoneally, and then, isoflurane was discontinued. After 10 min, a constant Dex infusion rate (0.05 mg/kg/h) was maintained under anesthesia. During anesthesia, a warm water pad was used to maintain the body temperature at ∼37.0°C, and a small animal rectal probe was used to detect the body temperature. The respiratory rate of mice was 277 ± 16 breaths per minute when awake and 150 ± 8 breaths per minute when under anesthesia.
Animal imaging
The MRI measurements were performed using a Bruker BioSpec 9.4T scanner, equipped with an 86-mm volume coil (Bruker), and received using a four-channel phased array cryogenic mouse head coil (Bruker). First, anatomical images were acquired using a T2-weighted MRI (T2WI) rapid acquisition with relaxation enhancement scan, repetition time (TR) 3300 ms, echo time (TE) 33 ms, field-of-view (FOV) 16 × 16 mm2, slices: 20, slice thickness 0.5 mm, and matrix size 256 × 256. Then, a gradient-echo echo-planar imaging (EPI) sequence, TR 1000 ms, TE 15 ms, FOV 15.975 × 12.15 mm2, slices: 20, slice thickness 0.5 mm, matrix size 71 × 54, and repetitions 600, was used to obtain rs-fMRI BOLD data.
MRI preprocessing
fMRI BOLD data were preprocessed and analyzed using in-house MATLAB code. Motion correction and slice timing were performed in SPM12 (Wellcome Trust Centre for Neuroimaging, London, United Kingdom). Anatomical images were registered to the mouse brain template using a nonlinear registration with BioImage Suite (Yale School of Medicine, 2015;
To reduce noise and improve the quality of the BOLD signal, group independent component analysis was performed in EPI images using the GIFT toolbox, as per our previous work (Han et al., 2019). The number of independent components, as estimated by the minimum description length criteria, was 8. Among them, components 1, 2, 4, and 8 were removed because they were identified as the signals from ventricles and white matter (Supplementary Fig. S1).
To further increase BOLD signal quality, epochs of the BOLD signal with a low signal-to-noise ratio were removed. Because the primary somatosensory cortex of the forelimb (S1FL) has a high correlation between the left and right hemispheres (de Arce et al., 2023), lacking correlation in S1FL is a sign of a lack of brain networks in general, indicating a potential problem in the physiological state. Thus, data whose Pearson's correlation coefficient (PCC) between bilateral S1FL was lower than 0.3 were removed from FC results, as per our previous work (de Arce et al., 2023).
GS calculation
The GS was defined as the average of the time course signals from all voxels in the whole-brain mask. Correlation with the GS was calculated by using the PCC between each mouse's GS and each voxel's time course signal. These calculations were done as per previous work, which examined the GS (Thompson et al., 2016).
The standard deviation was also used to measure the amplitude of the GS (Zarahn et al., 1997). Previous work, which calculated the amplitude in this manner, used a different type of calculation for the GS (Wong et al., 2012), and thus, we used an alternate calculation, which we refer to as GS-%. To calculate GS-%, for each voxel, the percentage change time series (C) was calculated by the preprocessed MR signal (S) subtracting the mean value (
Region-of-interest-based FC calculation
From fMRI data, the correlation coefficients between the time courses of regions-of-interest (Supplementary Table S1) were calculated (25 regions, see the Results section). Two types of FC calculations were performed as follows: (i) Calculate the correlation between different brain regions based on unilateral data, such as left posterior parietal association area and left visceral area (VISC). In the figures, these correlations are displayed on the upper triangular half of matrices for the right side of the brain, and on the lower triangular half of matrices for the left side of the brain. (ii) Calculate the correlation in the same brain region based on bilateral data, such as left retrosplenial area (RSP) and right RSP. In the figures, these correlations are displayed along the diagonal of matrices.
FCD calculation
Using PCC, FCD mapping is a metric based on graph theory that uses rs-fMRI data to generate a map of the number of functional connections (either local or global) for every voxel in the brain (Tomasi and Volkow, 2010). FCD mapping evaluates the local functional connectivity density (lFCD) by restricting the functional connections to the nearby cluster of other voxels around a voxel, and determines global FCD by counting the number of connections to each voxel across the whole brain (Tomasi and Volkow, 2011). In this study, we used lFCD to calculate the number of voxels linked with a particular voxel, and Pearson correlation was utilized with correlation thresholds set at R ≥ 0.25. The size of the nearby cluster was radius = 2 mm (Cohen et al., 2018). lFCD was calculated on a per-mouse basis and average results are shown as pseudocolor brain maps in the figures.
Brain modularity calculation
Modularity was calculated from unweighted and undirected correlation matrices (as calculated in the previous section) using the modularity_und tool from the Brain Connectivity Toolbox (Rubinov and Sporns, 2010). For valid comparisons between mice and scans, 100 modularity scores were generated. The partition with the largest modularity score was normalized by the average modularity generated from 100 randomly rewired (shuffled) FC matrices (Maslov and Sneppen, 2002). This procedure was repeated separately for each mouse and scan.
Intraclass correlation coefficient
Reliability was measured using the intraclass correlation coefficient (ICC) as per recommendations for rs-fMRI studies (Noble et al., 2021). Two types of ICC were calculated. In the first manner, awake or Dex groups were randomly divided into two groups to calculate ICC with six mice in each group. In the second manner, mice were divided into two groups according to the degree of change of Q value with groups for large and small change. The R language was used for this calculation, the model used was two-way, and the type was consistency.
Results
GS difference between awake and Dex mice
We first examined the GS itself, and the effects of anesthesia on it following the methods of Wong et al. (2012). We calculated the percentage change of time series (C) under awake and anesthesia conditions. Average C within two brain regions, infralimbic area and orbital area, was statistically significantly different between different states (Fig. 1b). However, for the mean of C across the entire brain, GS-%, there was no statistical difference in the standard deviation between the different states (Fig. 1c).
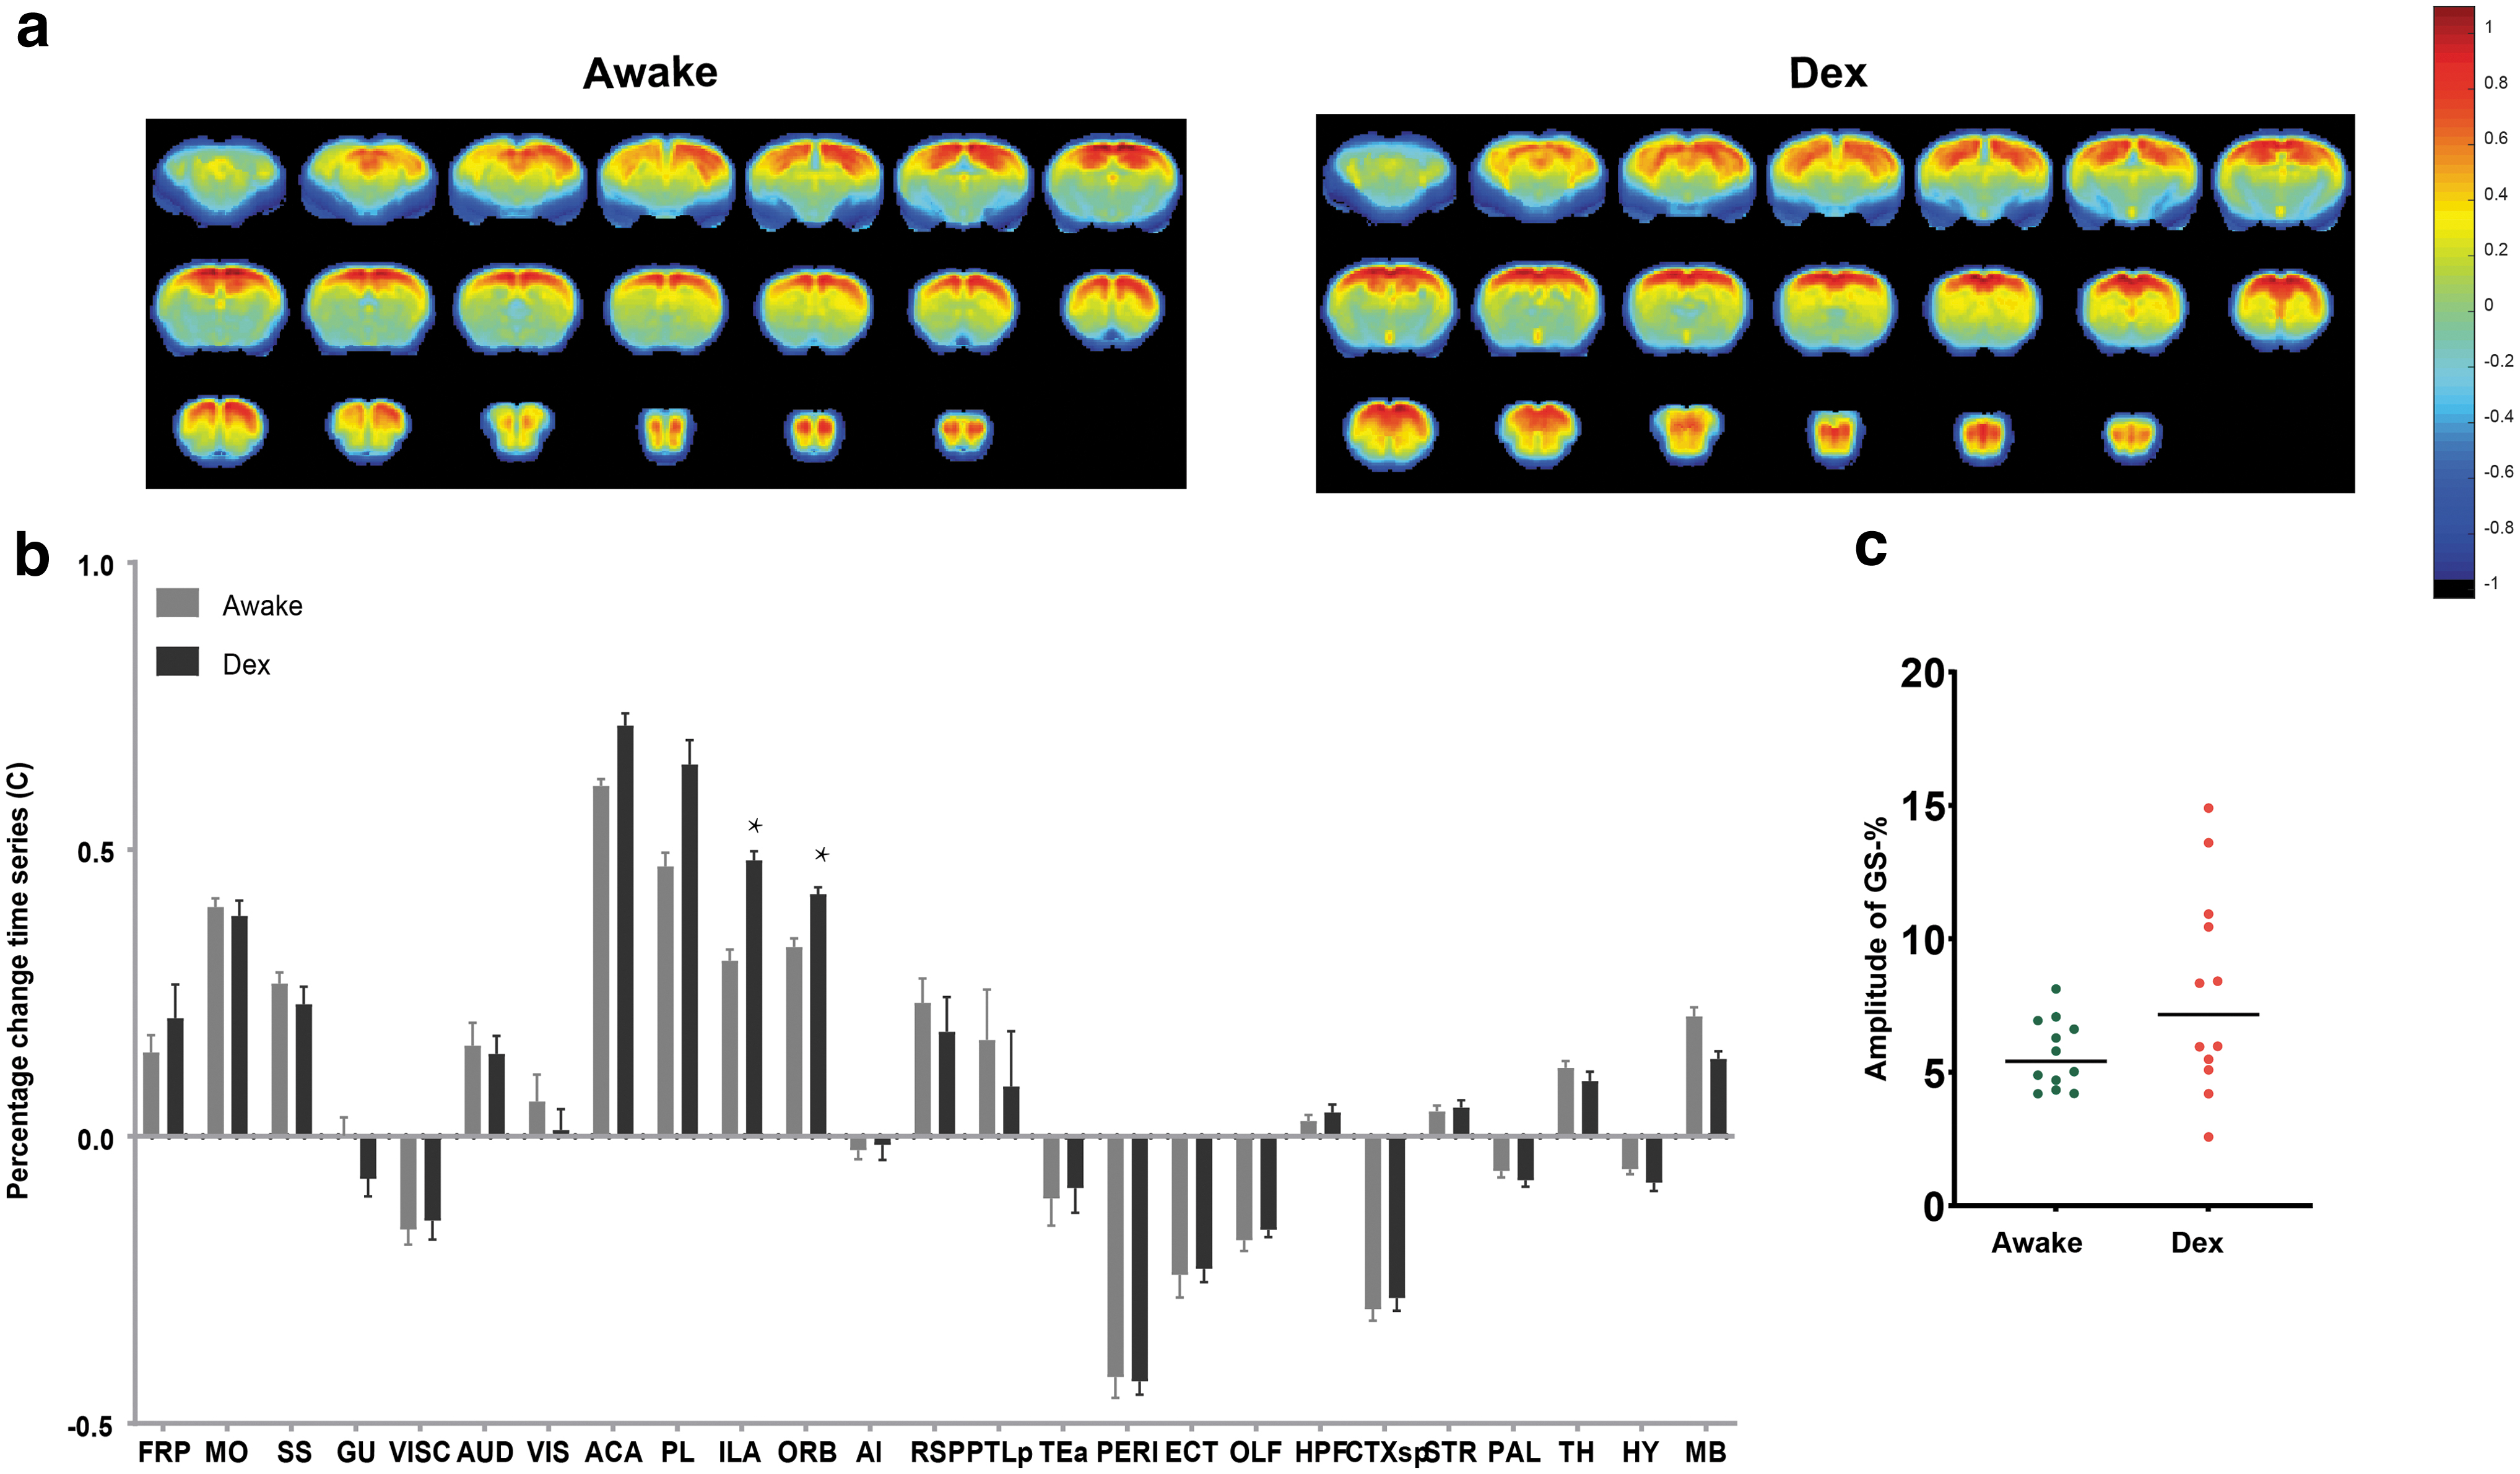
Mean of percentage change time series (C) from awake and anesthetized mice.
FC alteration due to GSR
To explore the effects of GSR on FC under different physiological states, we calculated the FC of mice under awake and Dex conditions. We then observed the effects of GSR by comparing the differences of FC matrices without (GSR−) and after GSR (GSR+). As shown in Figure 2, GSR decreased FC in both awake and Dex mice. (The difference between these maps is shown in Supplementary Fig. S2.) Our results showed that the decrease of FC was greater in the Dex condition. We also found that without GSR, the FC of mice under Dex was lower than that of awake mice, which is consistent with previous results (Areshenkoff et al., 2021; Paasonen et al., 2018).
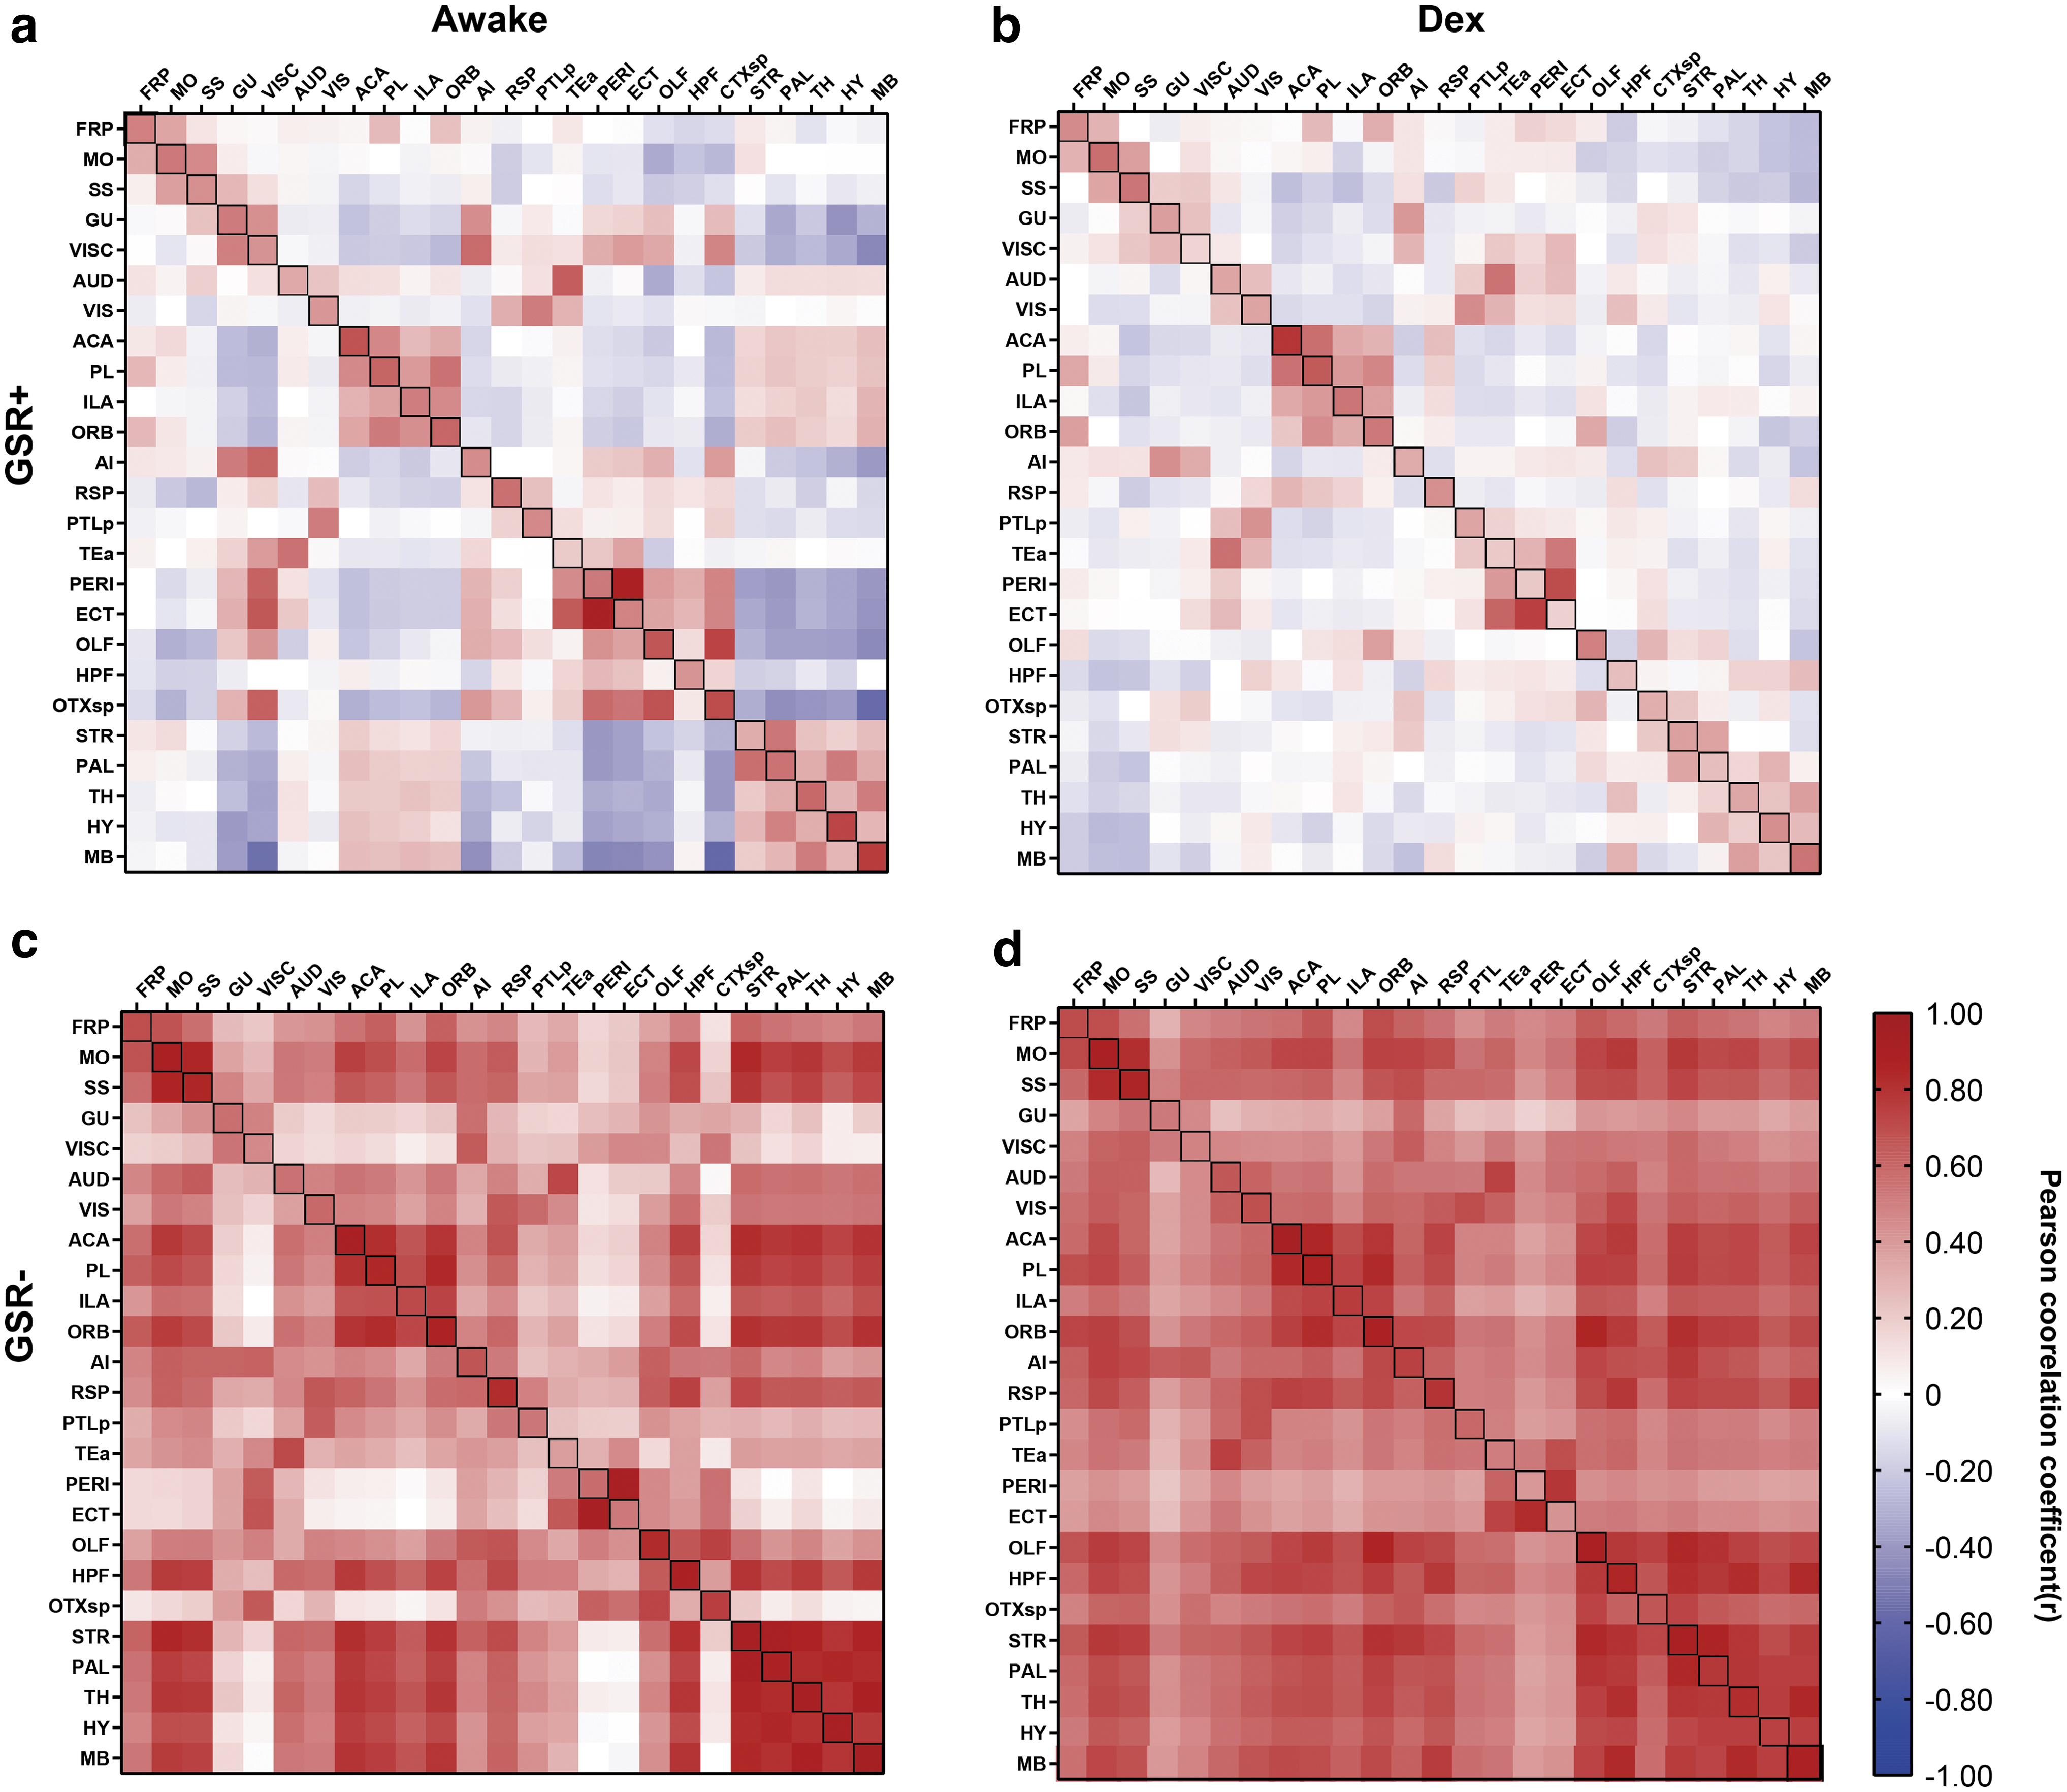
Mean Pearson correlation coefficient (r-score) matrix of awake and anesthetized (Dex) mice with different GSR conditions. Four correlation matrixes are shown, which include 25 brain ROIs, including GSR+ under awake state
Impact of GSR on modularity
Modularity revolves around the extent to which a complicated system is fragmented into distinct and self-contained constituent elements that perform unique functions and can operate in tandem with other elements. We examined the modularity scores of GSR− and GSR+ under both awake and Dex mice (Fig. 3a, b). The degree of modularity in mice affected by GSR was represented by calculating the difference in Q between GSR+ and GSR− conditions (ΔQ G) divided by the Q value in GSR+ condition, yielding Q G% (Fig. 3c). It was found that the modularity score increased in GSR+ under both awake and Dex states, and the change of degree of modularity score was greater in Dex mice than awake mice.

The effect of GSR and anesthesia on brain modularity change. Brain modularity was significantly greater in GSR+ (with GSR) both in awake
In GSR+, Q was greater in most mice, but Q values in the Dex group were more tightly clustered around a small range of values than Q values in the awake group, and the percentage change was greater than in awake mice (Fig. 3c). By comparing the extent of anesthesia-induced modulation in modularity score, we discovered that mice under GSR+ conditions exhibited more prominent alterations in the modularity score than those under GSR− conditions (Fig. 3f).
FCD map alteration due to GSR
Following the methods of Thompson et al. (2016), we examined the effect of GSR on FCD, as well as correlation with the GS itself. In most brain areas under GSR+, the FCD value of awake mice was higher than that of anesthetized mice, for example, VISC (p = 2.67 × 10⁻⁶, T = 7.091), CTXsp (p = 1.87 × 10⁻⁷, T = 8.829), and perirhinal area (PERI) (p = 1.93 × 10⁻⁷, T = 7.971) (Fig. 4b). However, for GSR−, most of these differences in brain regions were not statistically significantly different, and only the differences in CTXsp (p = 0.0024, T = 3.445) region under different anesthesia states were statistically significant (Fig. 4b). In GSR+ condition, the difference of FCD value between the anesthesia group and awake group was enlarged, and the difference of FCD values in different states was more obvious.

The effect of GSR on FCD maps and maps of correlation with the GS in awake and anesthetized states.
Correlation with the GS has previously also been related to brain physiology (Thompson et al., 2016). The correlation between most brain regions and the GS was higher under anesthesia, and the similarity between VISC (p = 0.0027, T = −3.381), temporal association area (TEa) (p = 0.0034, T = −3.276), PERI (p = 0.018, T = −2.576), and ectorhinal area (p = 0.0056, T = −3.11861) brain regions and GS was statistically significantly different between different anesthesia states.
GSR+ had lower FCD values than GSR− in both the awake and Dex groups. However, while most brain regions had decreased FCD values, some brain regions had increased FCD values (Fig. 4). We used the FCD value of GSR− minus GSR+ to obtain the difference map of FCD (Supplementary Fig. S3). We calculated the difference values in different brain regions, and made the statistical comparison between the awake and anesthesia states (Supplementary Table S2). We found that the changes under different physiological states, which differ under GSR+ performed, can present opposite trends. For example, the difference of FCD with GSR+ in VISC region in awake mice was significantly lower than Dex mice (p = 0.006096, T = −3.3843), while the difference of FCD with GSR− in HY region in awake mice was significantly higher than anesthetized mice (p = 0.02694, T = 2.511, Supplementary Table S2).
Thus, it appears that GSR may have completely opposite effects on different brain regions depending on the current physiological state. This suggests that even while GSR reduces the FCD value of the whole brain, it can specifically enhance the FCD values in certain brain regions depending on the current physiological state.
We divided the data into two groups based on the degree of modularity change. Based on ΔQ G, the highest 50% was designated as the “largest” group and the lowest 50% was designated as the “smallest” group. Thus, the “largest” group was highly influenced by GSR and the “smallest” group was less influenced by GSR (Fig. 5). In GSR−, FCD maps in the smallest and largest groups under both awake and Dex had no significant differences. In GSR+, some brain regions such as olfactory areas had no significant differences in FCD maps. However, certain brain regions such as somatosensory areas (SS) did have significant differences. In SS, for example, the smallest group was significantly greater under Dex, while there was no significant difference in SS between the smallest and largest groups in the awake state.

Differences in FCD maps between awake and Dex (anesthetized) mice with largest versus smallest Q differences in specific brain regions based on GSR+ versus GSR−.
ICC reliability
When we used the degree to which FCD was affected by GSR to sort (“largest” vs. “smallest” groupings), we found that both sets of ICC values are greater than 0.4, which indicates good reliability (Noble et al., 2021). When we used a random ordering, the awake group still had good reliability, with an ICC of 0.599. However, the Dex group had an ICC of 0.138 with a random ordering (Table 1). This showed that the large change and small change groups are reliable within each group, but not between the two groups.
Intraclass Correlation Coefficient Values in Awake and Dexmedetomidine Groups When Using Different Block Methods
ICC values under two methods of ordering samples (mice) and two kinds of anesthesia. The two sorting methods are “Random,” which is the ICC value under random ordering, and “Large versus Small,” which is sorted according to the degree of Q value change for GSR+ versus GSR−.
Dex, dexmedetomidine; GSR, global signal regression; ICC, intraclass correlation coefficient.
Discussion
We explored the effect of GSR on FC under awake and anesthesia conditions. We found that (i) there is no statistically significant difference in the amplitude of the GS between states; however, (ii) GSR decreases FC in awake and anesthetic states, but the anesthetic condition is more sensitive to changes due to GSR; (iii) GSR produced a more significant impact on brain network modularity in the anesthetized state; and (iv) within a given physiological state, some mice were affected more by GSR than others, and these effects were heterogeneous across different regions of the brain.
Studies have demonstrated that physiological state, cardiac and respiration rate, and vigilance are contributors to GS (Birn et al., 2006; Chang et al., 2016; Evans et al., 2015; Shmueli et al., 2007). The GS contains information both related and unrelated to neural activity. Wong et al. (2012) found that caffeine administration leads to widespread decreases in GS amplitude. However, using the same method (Fig. 1c), we did not find a significant change between anesthesia and awake states. We further calculated the PCC between GS and each brain voxel as per Thompson et al. (2016). We found that anesthesia can increase the correlation in some regions, and these regions overlapped with those in which with the effect of anesthesia on the difference between largest change and smallest change occurred.
Thompson et al. (2016) also observed that increased glucose consumption in brain regions correlated with increased correlation with the GS and increased FCD, but the FCD result was only observed if GSR was not performed. While Dex increases blood glucose in general (Matsumoto et al., 1993), the effect of Dex on cerebral glucose metabolism has had inconsistent effects observed in previous studies, either increased (Nummela et al., 2022) or decreased (Laaksonen et al., 2018) by Dex. Without GSR, we only observed one brain region where FCD significantly changed, being decreased under Dex. However, correlation with the GS was significantly higher in many brain regions under Dex (Fig. 4b). When using data from the same mice as were used in the present study, the cerebral metabolic rate of oxygen consumption was observed to be decreased under Dex (Xu et al., 2022), but the cerebral metabolic rate of glucose consumption was not measured.
Therefore, it is unclear whether FCD or correlation with the GS could be reflecting glucose consumption in our study. Future work such as combined simultaneous positron emission tomography and fMRI to measure aerobic glycolysis (Zhang et al., 2022a) or magnetic resonance spectroscopy (Zhang et al., 2022b; Zou et al., 2022) could potentially answer this question.
Previous studies have found that the default mode network (DMN) had higher correlation with the GS (Cole et al., 2010). We found, similar to their work, that the ACA prelimbic area (part of rat brain's DMN) (Lu et al., 2012; Upadhyay et al., 2011) was also highly correlation with the GS. Moreover, these regions also have high FCD in both awake and anesthetized conditions without GSR. With GSR, the FCD value in Dex group was decreased, and there were more regions that had significant differences between awake and Dex groups. This may indicate that anesthesia increases the GS effect on overall brain activity, while GSR removes this effect, highlighting more local changes in individual brain regions. This is similar to comments by Thompson et al. (2016) about ALFF-based methods under GSR.
Interestingly, we found that FC changes were more sensitive to GSR when the animals were anesthetized. Similar to previous studies, GSR can create or reveal negative FC that was not visible before using the method (Allen et al., 2014; Li et al., 2019; Xu et al., 2018). Previous studies have shown that anesthesia can also reduce FC in mice (Liang et al., 2015; Paasonen et al., 2018; Wu et al., 2016). In addition, our work suggests that GSR has differential effects on FC even in the same mouse under different physiological states. Without GSR, we found that FC decreased significantly under anesthesia compared with awake mice. Data without GSR showed anesthesia reducing FC in mice, but if GSR was used, FC in many brain regions is instead lower in the awake state.
This indicates that GSR has different effects on functional connections in mice under different physiological states and has more impact on functional connections under anesthesia. Thus, when we explore FC changes in fMRI studies using mice under different anesthetic states, if GSR is used, it needs to be considered that it will affect different physiological states differently.
Brain modularity is a tool to quantify how brain networks change in response to tasks or situations (Rubinov and Sporns, 2010). Brain modularity is very sensitive to network changes (Chaddock-Heyman et al., 2021; Newman, 2006). Pullon et al. (2022) observed a decrease in global network efficiency, and the studied brain networks became more segregated under propofol-induced unresponsiveness. Areshenkoff et al. (2021) also found an increase in brain modularity and the number of network nodes under anesthesia. Recent studies demonstrate that anesthesia affects brain networks (Areshenkoff et al., 2021; Pullon et al., 2022), and alters measured modularity scores. Based on our work, we found that GSR also can influence modularity; GSR increased the modularity score both in awake and anesthetized states.
However, the changes in the modularity score caused by GSR were unidirectional under the anesthesia condition and bidirectional under the awake condition. The change in brain modularity in the anesthetized state was more obvious than in the awake state, as brain networks became more segregated in the anesthetized state under GSR.
We divided the mice into “largest” and “smallest” groups based on the amount of modularity change between with and without GSR. Under GSR, within the same anesthesia condition, FCD maps differ significantly between the largest and smallest groups. In mice highly affected by GSR (“largest” group), FCD values within the somatosensory brain network decreased under anesthesia, indicating that the effect of GSR on the brain networks of mice was heterogeneous (Xu et al., 2018). This suggests that perhaps GSR is removing networks with weaker overall connectivity. Although GSR can help find particularly strong networks, researchers are advised to be cautious using GSR to remove noise when planning to perform brain modularity analysis.
Some caveats exist beyond the scope of this work. First, previous studies have demonstrated that FC changes greatly in task condition (Freitas et al., 2020; Rocca et al., 2022). Aguirre et al. (1997) found a significant correlation between the GS and their behavioral paradigm. Task-based fMRI analysis thus needs more caution regarding GSR; whether GSR can remove the signal caused by the task is essential. Second, in this work, we studied the specific effects of GSR on awake and anesthetized states. The extent to which GSR affects different brain networks under different anesthetized states varies. Several studies have found negative correlations between the DMN and task-positive network, which demonstrated the anticorrelations without GSR (Chai et al., 2012; Chang and Glover, 2009). However, the reason for these effects is still unclear (Fox et al., 2009).
The reported results may come from the mathematic characteristics of GSR, underlying neurobiological features and so on. Overall, our work suggests that attention should be focused on the effect of GSR, especially in specific brain regions, as it is used in fMRI studies. To further better use GSR for fMRI data analysis, it is necessary to conduct in-depth research on the reasons for the different effects of GSR.
In conclusion, GSR had a notably different effect on awake and anesthetized mice. The FC and modularity change in anesthetized mice was more remarkable than in awake mice. GSR tended to remove networks that had lower connectivity, and highlight differences in individual brain regions. Considering the difference in the effects of GSR on functional connectivity between anesthesia and wakefulness, caution is advised when using GSR to remove noise, particularly when comparing different neurometabolic states.
Footnotes
Acknowledgment
The authors are thankful for the help of the 9.4 T Small Animal MRI Platform of ShanghaiTech University.
Authors' Contributions
D.W., H.L., and G.J.T. designed and implemented this project. M.X., B.B., M.P., and Z.L. collected and preprocessed the data. D.W. finished the draft of the article, and H.L. and G.J.T. helped to revise it. G.J.T. supervised the analysis of animal data and the writing of the article.
Author Disclosure Statement
No competing financial interests exist.
Funding Information
This study was supported by ShanghaiTech University, the Shanghai Municipal Government, and the National Natural Science Foundation of China Grant 81950410637 (Garth J. Thompson), Grant 3210055 (Hui Li), and Grant 81771821 (Zhifeng Liang), Strategic Priority Research Program of the Chinese Academy of Sciences (Grant No. XDB32030100 to Zhifeng Liang), the Shanghai Municipal Science and Technology Major Project (Grant No. 2018SHZDZX05 to Zhifeng Liang) and CAS Pioneer Hundred Talents Program (to Zhifeng Liang).
Supplementary Material
Supplementary Table S1
Supplementary Table S2
Supplementary Figure S1
Supplementary Figure S2
Supplementary Figure S3
References
Supplementary Material
Please find the following supplemental material available below.
For Open Access articles published under a Creative Commons License, all supplemental material carries the same license as the article it is associated with.
For non-Open Access articles published, all supplemental material carries a non-exclusive license, and permission requests for re-use of supplemental material or any part of supplemental material shall be sent directly to the copyright owner as specified in the copyright notice associated with the article.