
Abstract
Aim:
To develop an approach to evaluate multiple overlapping brain functional change patterns (FCPs) in functional network connectivity (FNC) and apply to study developmental changes in brain function.
Introduction:
FNC, the network analog of functional connectivity (FC), is commonly used to capture the intrinsic functional relationships among brain networks. Ongoing research on longitudinal changes of intrinsic FC across whole-brain functional networks has proven useful for characterizing age-related changes, but to date, there has been little focus on capturing multivariate patterns of FNC change with brain development.
Methods:
In this article, we introduce a novel approach to evaluate multiple overlapping FCPs by utilizing FNC matrices. We computed FNC matrices from the large-scale Adolescent Brain Cognitive Development data using fully automated spatially constrained independent component analysis (ICA). We next evaluated changes in these patterns for a 2-year period using a second-level ICA on the FNC change maps.
Results:
Our proposed approach reveals several highly structured (modular) FCPs and significant results including strong brain FC between visual and sensorimotor domains that increase with age. We also find several FCPs that are associated with longitudinal changes of psychiatric problems, cognition, and age in the developing brain. Interestingly, FCP cross-covariation, reflecting coupling between maximally independent FCPs, also shows significant differences between upper and lower quartile loadings for longitudinal changes in age, psychiatric problems, and cognition scores, as well as baseline age in the developing brain. FCP patterns and results were also found to be highly reliable based on analysis of data collected in a separate scan session.
Conclusion:
In sum, our results show evidence of consistent multivariate patterns of functional change in emerging adolescents and the proposed approach provides a useful and general tool to evaluate covarying patterns of whole-brain functional changes in longitudinal data.
Impact statement
In this article, we introduce a novel approach utilizing functional network connectivity (FNC) matrices to estimate multiple overlapping brain functional change patterns (FCPs). The findings demonstrate several well-structured FCPs that exhibit significant changes for a 2-year period, particularly in the functional connectivity between the visual and sensorimotor domains. In addition, we discover several FCPs that are associated with psychopathology, cognition, and age. Finally, our proposed approach for studying age-related FCPs represents a pioneering method that provides a valuable tool for assessing interconnected patterns of whole-brain functional changes in longitudinal data and may be useful to study change over time with applicability to many other areas, including the study of longitudinal changes within diagnostic groups, treatment effects, aging effects, and more.
Introduction
The resting-state human brain can be used to reveal time-varying functional connectivity (FC) dynamics (Calhoun et al., 2014; Chang and Glover, 2010; Saha et al., 2020; Saha et al., 2019), which have been associated with cognition (Park and Friston, 2013) and various neurological (Greicius, 2008) and mental (Arbabshirani et al., 2017; Arbabshirani et al., 2013) disorders. There are various established neuroimaging techniques that can be used to quantify FC.
Among them, functional magnetic resonance imaging (fMRI) paradigms are the most commonly used technique for the computation of the temporal coherence between different brain regions (Craddock et al., 2013). The FC among spatially distant brain regions from resting-state fMRI data can be defined through a measure of pairwise statistical dependency (most commonly Pearson correlation) between their time courses (TCs).
Among different types of analytic tools, (i) seed-based analysis (Biswal et al., 1995; Greicius et al., 2003) and (ii) purely data-driven methods, such as independent component analysis (ICA) (Calhoun and Adali, 2012; Calhoun et al., 2009; Calhoun et al., 2001; Damoiseaux et al., 2006; Fox and Raichle, 2007; Hyvärinen and Oja, 2000) are widely used and can be applied to resting-state fMRI data to delineate brain FC.
Data-driven decomposition techniques such as ICA are typically used to extract temporally coherent brain networks. TCs that are obtained from ICA can be used to calculate the functional network connectivity (FNC) (Jafri et al., 2008), which is FC between whole brain networks as opposed to localized regions. Age-related brain connectivity changes have recently been studied in many articles using data-driven approaches.
There is a growing research interest in estimating age-related anatomical and functional changes and their relationships with cognition. A great advance to understand human brain function came with the observation of spontaneous blood-oxygenation level dependent fMRI (Biswal et al., 1995) signals, which have been frequently used to identify regional FC and investigate the changes in a variety of neurological and psychiatric disorders (Chen et al., 2011).
Many studies have considered the human brain as a large number of complex connectivity networks (Bressler and Menon, 2010; Sporns, 2014; Sporns, 2012). During the adolescence period, the human brain exhibits remarkable changes both in function (Stevens, 2016; Vértes and Bullmore, 2015) and structure (Váša et al., 2018; Whitaker et al., 2016). Brain networks undergo substantial maturation (Casey et al., 2005; Di Martino et al., 2014; Grayson and Fair, 2017), and this factor leads us to understand the parallel changes in the brain in cognition and other behavior.
Another study has found rapid improvement of cognitive abilities in the human brain during the early adolescence period (Luna et al., 2004). Several studies have shown links between cognitive performance and communication between brain regions, including extrinsic interactions between functional networks, which also exhibit changes with age (Fjell et al., 2016; Fox et al., 2005; Onoda et al., 2012; Perry et al., 2017).
Several studies have reported age-related FC changes during the adolescence period, but the obtained results are somewhat inconsistent (Váša et al., 2020). Small data size, the absence of longitudinal data, variation in fMRI data preprocessing, and the choice of different analysis methods might contribute to this inconsistency. In a longitudinal study, recent findings exhibit that early adolescence is a significant period for the maturation of the brain's functional architecture specifically for the default mode network (DMN) and the central executive network (Sherman et al., 2014).
Another longitudinal study has found an FC link between the default mode and control networks, which increases over time and greater declines over age (Ng et al., 2016). Longitudinal changes in whole brain FC strength, as well as cognitive performance scores, are associated with age and have been investigated (Li et al., 2020). Váša et al. (2020) investigated the changes in human brain function during adolescence and found two distinct modes (disruptive and conservative) of age-related change in the FC.
Age-related changes in FC have been studied and show a progressive reduction in FC among different age groups (Farras-Permanyer et al., 2019). The impact of aging on functional networks has also been reported in (Geerligs et al., 2015). However, most of these studies focus on voxel-wise or region-wise changes over time, there has been little work in evaluating whether whole-brain multivariate pattern changes in functional (network) connectivity are observable during development. In addition, no studies have attempted to link whole brain change patterns to cognitive development, early psychosis problems, and other behavioral changes at an early age.
In our study, we propose a new method to visualize whole-brain FNC changes with increased age by using FNC matrices from the Adolescent Brain Cognitive Development (ABCD) data. Our data set consists of 3489 adolescent subjects and it includes multiple MRI scans collected longitudinally. We analyzed resting-state fMRI from baseline and year 2. We estimate functional change patterns (FCPs) by first computing cell-wise difference within the individual (delta FNC [ΔFNC] matrix) and then estimating the covarying multivariate patterns through ICA from the ΔFNC matrices.
The statistical analysis of the loading parameters (obtained from the infomax algorithm) reveals that several FCPs show significant longitudinal differences. We found several FCPs that are linked with longitudinal changes of psychopathology, cognition, and age; and functional change pattern covariation (FCPC) shows significant differences between upper and lower FCPC for the age difference, psychopathology scores difference, cognition scores difference, and baseline age in the developing brain.
To the best of our knowledge, our proposed method is the first approach to estimate multiple overlapping brain FCPs for a 2-year period in the developing brain. The remainder of the research article is organized as follows. In the materials and methods section, we introduce the data preprocessing and the analysis procedures. Next, in the result section, we show brain functional coupling changes with age. We also show the links between the FCPs and age difference, psychopathology scores difference, cognition scores difference, and baseline age. Finally, we discuss the findings in the discussion and conclusion section.
Materials and Methods
Introduction to ABCD data
In this study, we used the ABCD data set that comes from the ABCD study (
Demographic Information of Adolescent Brain Cognitive Development Data
A, Asian; B, Black; H, Hispanic; O, others/unknown; W, White.
The subject information of the ABCD data set includes social, emotional, and cognitive development, gender identity, physical and mental health assessments, and health backgrounds. The parent's full written informed consent and the child's assent were taken for each participant, and it was approved by the Institutional Review Board. The ABCD data set is shared by the National Institute of Mental Health Data Archive (NDA;
The data quality was ensured by standard fMRI preprocessing pipeline and through a robust ICA-based framework called Neuromark, which can identify brain networks by comparing across subjects while adapting single-subject variability with the networks (Du et al., 2020). In this data set, total number of subjects with baseline and 2-year rest fMRI scanned data are 11,244 and 3678, respectively. In this study, we utilized 3489 subjects who have both baseline and 2-year follow-up scanned data that passed the quality control. Both baseline and 2-year sessions have 1–8 scans. In our analysis, we selected the first scan from both baseline and 2-year data.
Data preprocessing
We acquired the raw fMRI data from the NDA and preprocessed it through a combination of the FMRIB Software Library v6.0 (FSL) toolbox and the Statistical Parametric Mapping 12 toolbox under the MATLAB 2019b environment. The subject's head motion was corrected by rigid body motion correction using the FSL Motion Correction FMRIB's Linear Image Registration Tool. After the head motion correction, distortion correction in the fMRI images was corrected using the field map files by acquiring phase encoding in the anterior–posterior direction and volumes with phase encoding in the posterior–anterior direction from the FSL tool topup.
The distortion in the fMRI volume was corrected by using the output field map coefficients that use the FSL tool applytopup. Then, 10 initial scans have been discarded after distortion correction (those have large signal changes) to allow the tissue to reach a steady state of radiofrequency excitation. Finally, fMRI data were subsequently warped with the standard Montreal Neurological Institute space with 3 × 3 × 3 spatial resolution and smoothed using a Gaussian kernel with a full width at half maximum = 6 mm.
Neuromark framework
In this study, we used the Neuromark_fMRI_1.0 network templates to extract intrinsic connectivity networks (ICNs) and their corresponding TCs across subjects, through a fully automated spatially constrained ICA approach. The Neuromark_fMRI_1.0 templates/priors were derived based on replicated networks estimated from two healthy control data sets, the human connectome project (823 subjects after subject selection) and the genomics super struct project (1005 subjects after subject selection).
Details of the Neuromark framework and templates can be found in the Group ICA of fMRI Toolbox (GIFT) and at
To address this, we included four additional postprocessing steps to control the remaining noise in the TCs of ICNs. The steps included (1) detrend linear, quadratic, and cubic trends, (2) remove detected outliers, (3) apply multiple regression on the head motion parameters (3 rotations and 3 translations) and their temporal derivatives, and (4) bandpass filtering using a cutoff frequency of 0.01–0.15 Hz. After the postprocessing, we calculated Pearson correlation coefficients between postprocessed TCs to estimate the static FNC for each scan.
Analysis of longitudinal changes in FCP
In this study, FNC from subject-wise baseline and 2-year data were analyzed. To focus on changes within subjects for the 2-year period, the cell-wise difference between the baseline and 2-year FNC data was first computed to create the FNC difference matrices (ΔFNCs), which are then being decomposed into independent components using ICA (infomax algorithm; Bell and Sejnowski, 1995). ICA aims to separate higher-order information by maximizing the statistical independence of the estimated components.
We then evaluated the covariation in brain functional coupling among brain networks. In our experiment, five components were estimated based on elbow criteria. More specifically the ICA model equation can be written as

Here
We further evaluated the loading parameters and source matrix after the ICA estimation to identify FCPs. We found significant longitudinal change relative to zero for the FCPs. We conduct a one-sample t-test on the loading parameters and calculate the statistical significance with a 95% significance threshold, corrected for multiple comparisons. We also computed the kurtosis of the loading parameters for the five components to evaluate whether the longitudinal change was more concentrated at the mean or spread out in the tails.
We visualize the FCPs through the connectivity matrix and connectograms. We also performed a two-sample t-test on each loading parameter using sex (biological sex assigned at birth) information. In our study, the number of male and female subjects was 1841 and 1569, respectively. A block diagram of the analysis workflow is shown in Figure 1. We also evaluated the reliability of the result by applying our method to data collected in a separate scan session and computing the intraclass correlation coefficients (ICCs).
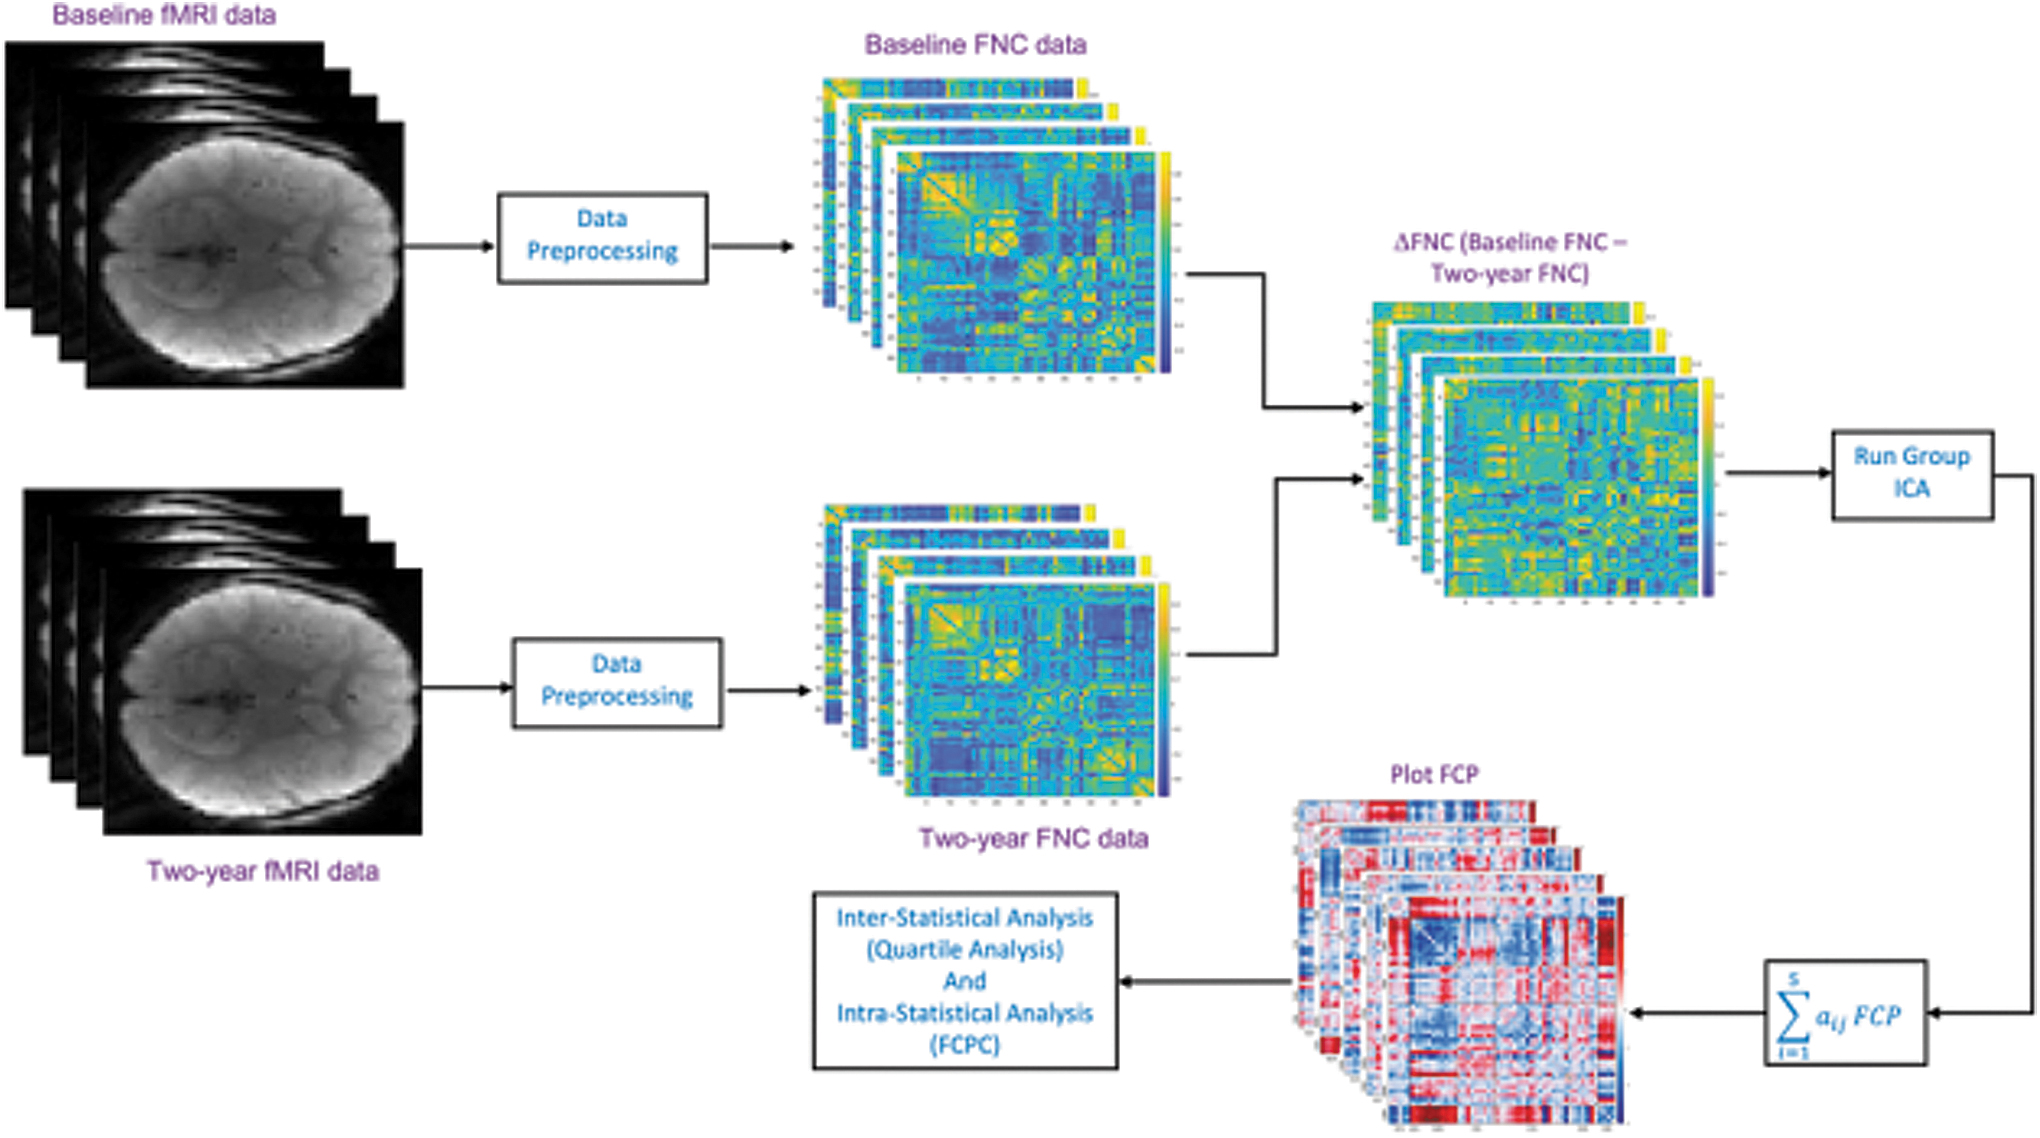
Block diagram of the FCP analysis workflow. The subject-wise changed FNC matrix has been constructed by taking the difference between preprocessed baseline and 2-year FNC data. Group ICA was applied on the new FNC matrices to detect covarying multivariate patterns. ΔFNC, delta functional network connectivity; FCP, functional change pattern; FCPC, functional change pattern covariation; fMRI, functional magnetic resonance imaging; FNC, functional network connectivity; ICA, independent component analysis.
Correlation with composite cognition and psychiatric problems
To minimize the number of comparisons, we computed the composite measures for cognitive and psychopathology scores. In this study, we combined the relevant ABCD scores (see Supplementary Data for individual variables) by normalizing each variable (i.e., subtracting the mean and dividing by the standard deviation) and then adding up the scores within each of the two categories (cognition and psychiatric problems) to create two new composite variables. We computed the subject-wise difference between the baseline and 2-year cognitive and psychopathology scores to create cognitive score difference and psychopathology score difference data. Then, we computed the correlation between these variables and the loading parameters for each component.
Quartile analysis of pattern changes through correlation
The overall results showed significant age-related pattern changes for all components. Fu et al. (2022) performed a large-scale analysis on cross-scan FC stability using ABCD data and found that to infer early cognitive and psychiatric behaviors in children, the intra-subject connection stability may be a useful biomarker. Based on this observation, we were interested in evaluating the relation of age-related brain FCPs with psychopathology and cognitive scores difference.
To compute the relationship of the subset of subjects showing the largest change patterns with increased age, we computed the correlation for the lower and upper quartile of loading parameters with the variables of age difference, psychopathology score difference, and cognitive score difference, respectively. Specifically, we first computed the subject-wise difference between the baseline and 2-year values for age, composite psychopathology score, and composite cognitive score data to create scores for the age difference, psychopathology score difference, and cognitive score difference, respectively.
Next, we identified the subjects with loading parameter values in the lower and upper quartiles. After that, we correlated the age difference, psychopathology score difference, and cognitive score difference data subject-wise with the loading parameter, respectively. In addition, we also computed the correlation for the lower and upper quartile of loading parameters with the prodromal psychosis scale (number of yes responses summed [pps_y_ss_num]) difference following the aforementioned procedures. All results were corrected for multiple comparisons using the false discovery rate (FDR) (Benjamini and Hochberg, 1995).
FCPC analysis and relationship to subject measures
To analyze the covariation and interactions between the FCPs, we computed the cross-correlation between the loading parameters to obtain a 5 × 5 correlation matrix. To evaluate the relationship of this FCPC to psychopathology score difference, cognitive score difference, baseline age, and age difference, we compared FCPC of the lower quartile versus upper quartile of psychopathology score difference, cognitive scores difference, baseline age, and age difference, respectively.
Specifically, we selected subjects whose psychopathology score difference values are less than or equal to the lower quartile. Then, we calculated the correlation among the loading parameters of FCPs in the selected subjects to create a 5 × 5 matrix as the lower FCPC. Following the same procedure for the upper quartile we created the upper FCPC as well. Finally, we computed the difference between the correlation of upper FCPC and lower FCPC. We applied the same approach to evaluate cognitive score difference, baseline age, and age difference.
Results
Overall effects on longitudinal change patterns
Fifty-three replicable networks were included in the Neuromark_fMRI_1.0 template, which are divided into seven domains based on anatomical and functional properties (subcortical, auditory, sensorimotor, visual, cognitive control, default mode, and cerebellar; Du et al., 2020). The brain network template is shown in Figure 2. In each subplot, the ICNs are represented by different colors in the composite maps.
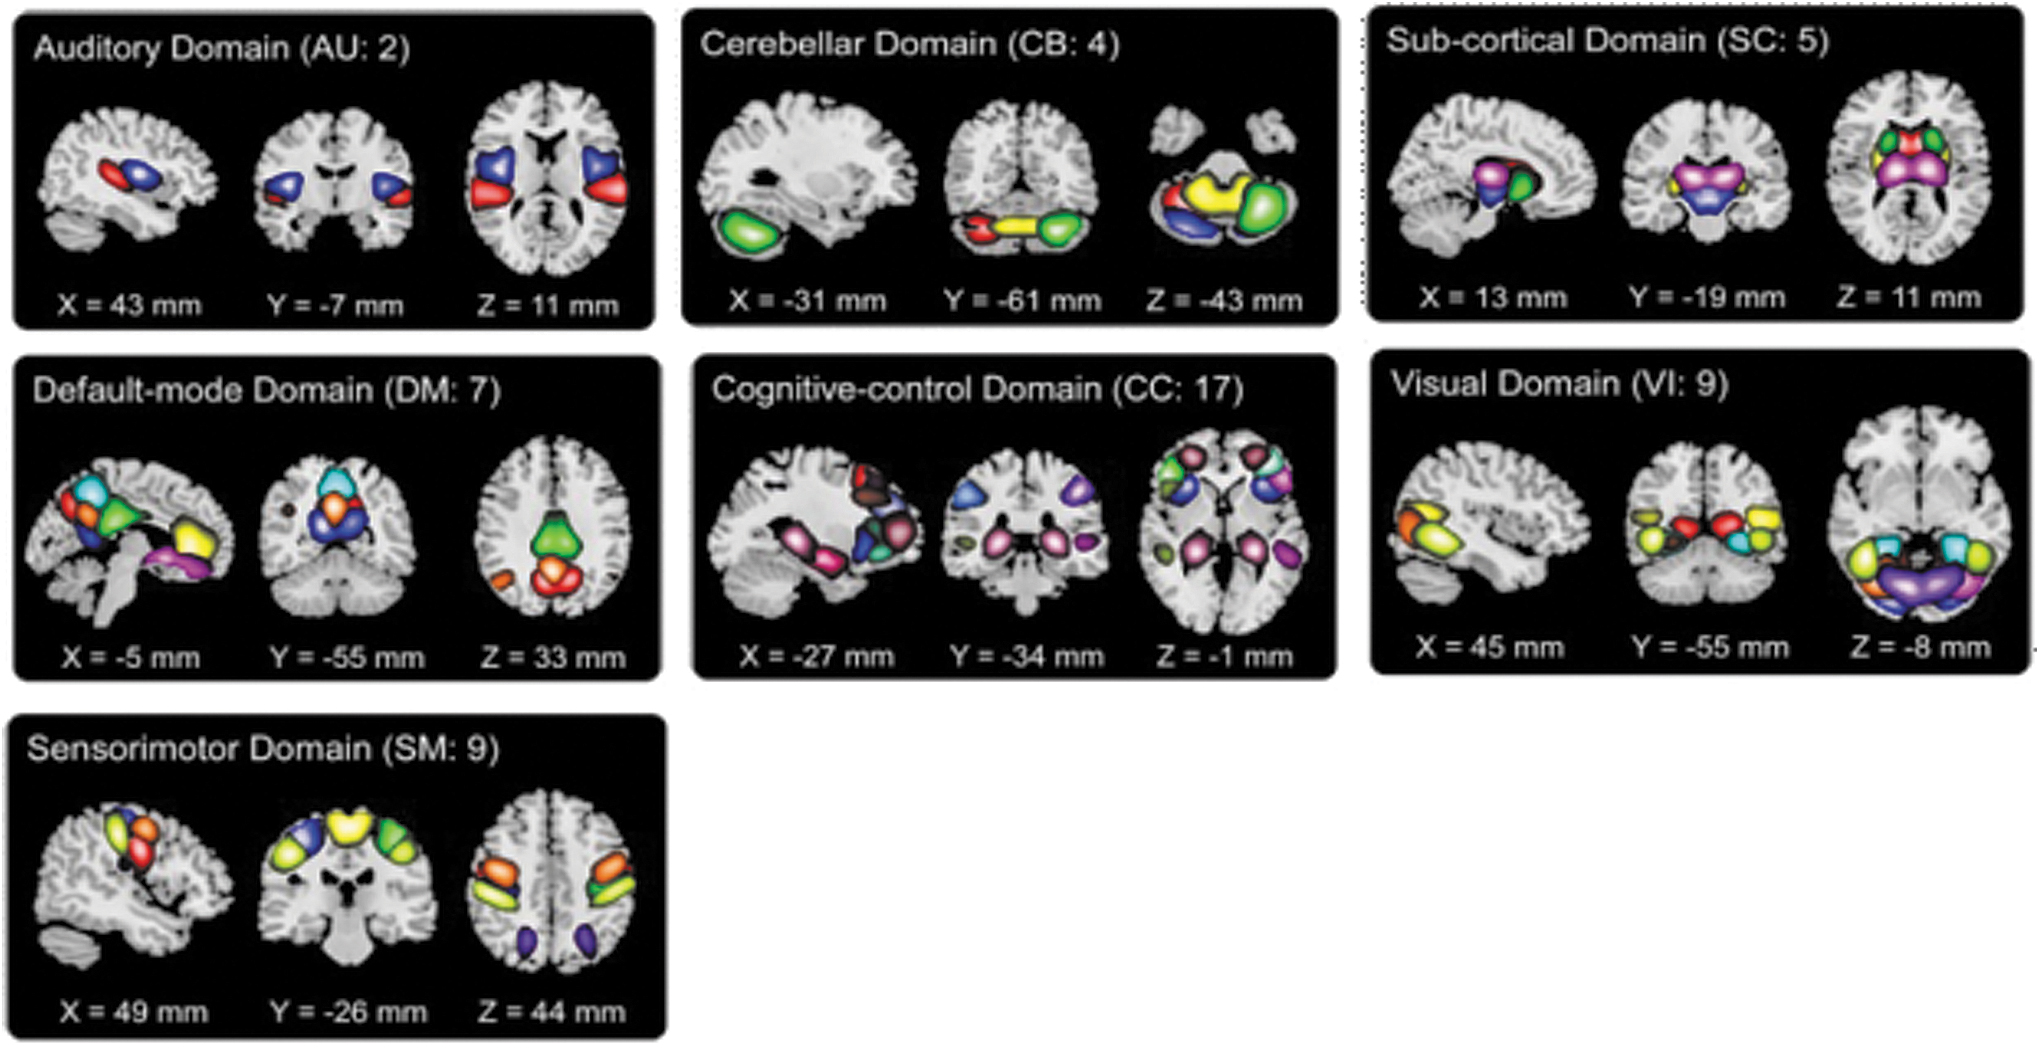
Visualization of the Neuromark_fMRI_1.0 network template (Du et al., 2020).
In our analysis, as the 2-year FNC data (older time point, F2) has been subtracted from the baseline FNC data (younger time point, F0; F0 – F2), a high negative T value represents an increase, whereas a positive T value represents a decrease in the given FCP's expression with age. In the case of a negative T value, positive functional network pairs are negative, indicating increased connectivity, whereas for a positive T value, positive functional network pairs are positive, signifying reduced connectivity.
In summary, negative T values indicate heightened connectivity coupling among positive FNC pairs (in red) and diminished connectivity coupling among negative FNC pairs (in blue) as individuals age. Conversely, positive T values indicate reduced connectivity coupling among positive FNC pairs (depicted in red) and enhanced connectivity coupling among negative FNC pairs (depicted in blue) with advancing age.
We present our experimental results of FCPs components in Figure 3. In our study, we estimated five components, and the optimal component numbers were selected based on the elbow criterion. In Figure 3, each component and the associated T value indicate its relationship to the null distribution of zero, meaning no contribution on average across subjects to change in structure between baseline and year 2. The associations of FCPs components with age are depicted by the upper and lower arrow.
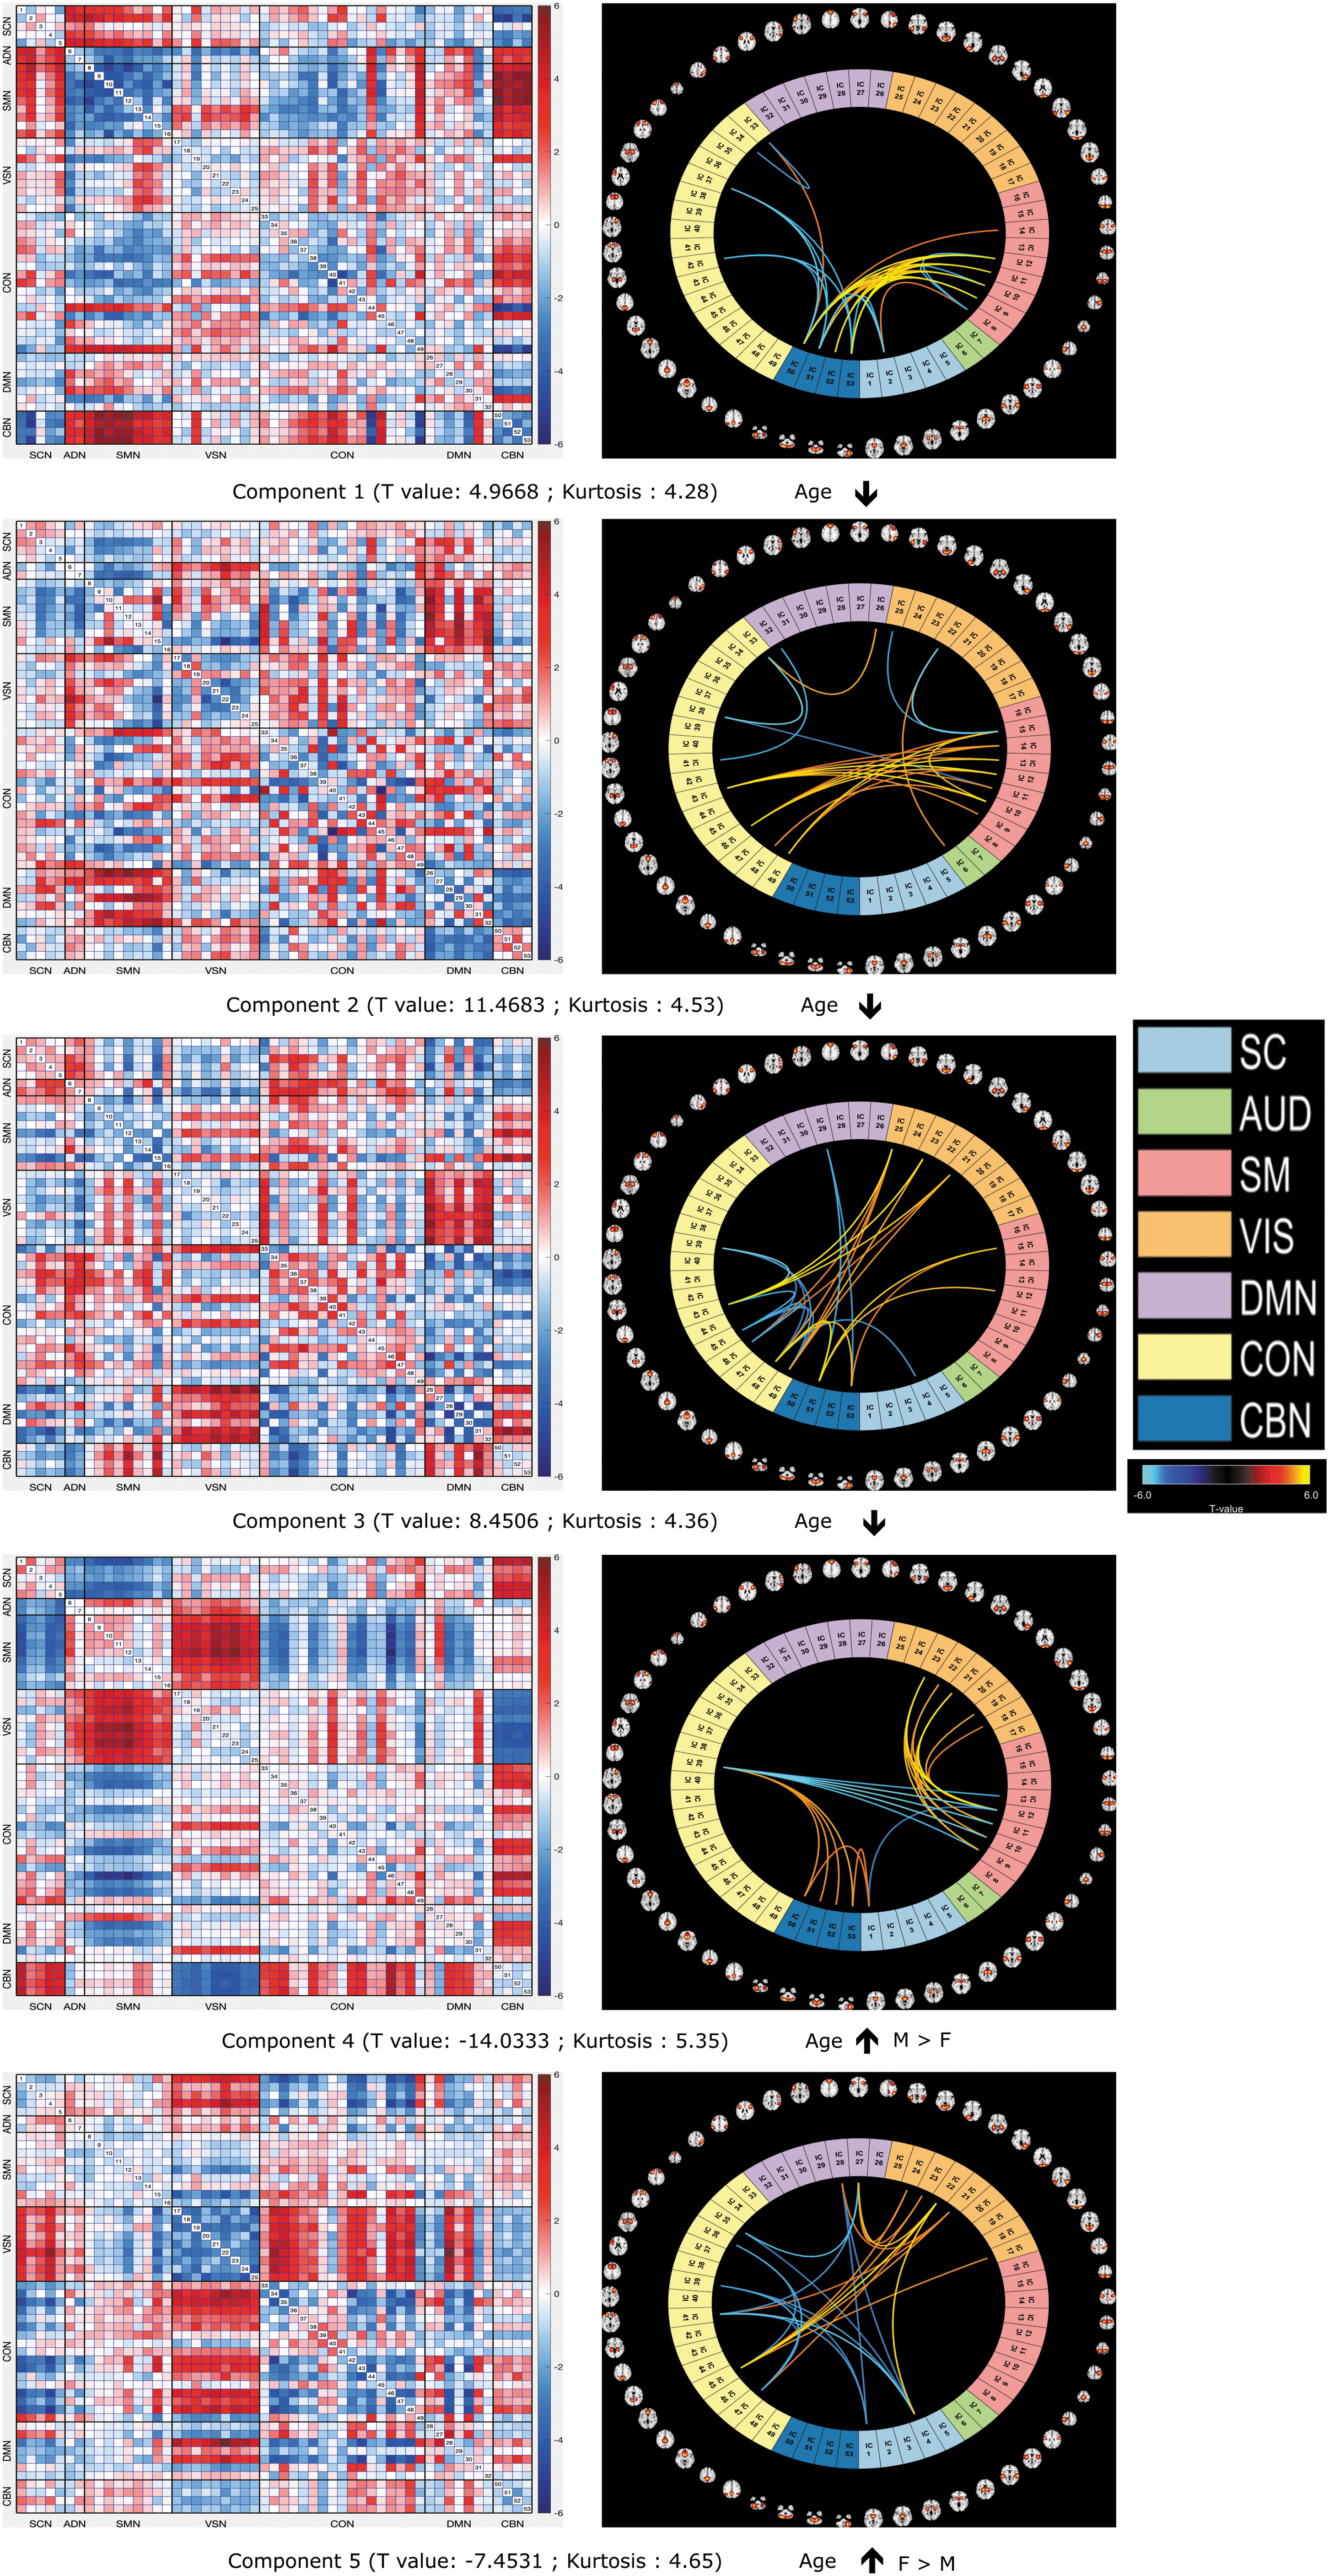
FNC component plot. In the figure, we observe the FCPs for components 2 and 4 have the highest positive (component 2) and negative (component 4) T values. The positive T values (F0 – F2) indicate decreased connectivity coupling between positive FNC pairs (represented in red) and increased connectivity coupling between negative FNC pairs (represented in blue), whereas the negative T values indicate increased connectivity coupling between positive FNC pairs (represented in red) and decreased connectivity coupling between negative FNC pairs (represented in blue) with increased age. We also marked the associated relation of FCPs components with increased age by the upper and lower arrows. Here the upper arrow indicates the increasing expression of FCPs components with age, whereas the lower arrow indicates the decreasing expression of FCPs components with age.
Here the upper arrow indicates the increasing expression of FCPs components with age, whereas the lower arrow indicates decreasing expression of FCPs components with age. All components exhibit structured change patterns however, in component 4, we observe the largest negative FC coupling between the visual domain (VSN)-sensorimotor domain (SMN) and cerebellar domain (CBN)—subcortical domain (SCN) for the 2-year period. The associated T value for component 4 is negative (−14.02).
We also see the largest positive functional coupling for component 4 between the VSN-CBN and SMN-SCN regions in Figure 3. In the figure, we see that component 2 has the largest positive T value as 11.47. In the plot, the default mode domain (DMN) and SMN exhibit the largest positive values and CBN and DMN domains show the largest negative FC coupling for component 2 for the 2-year period. From the figure, we also observe highly structured (modular) patterns. The T value, P value, kurtosis, and skewness of the loading parameters is presented in Table 2.
T Value, p Value, Kurtosis Value, and Skewness of Loading Parameters
All five loading parameters are super-Gaussian (kurtosis is above 3.0). Here, loading parameter 4 shows the highest kurtosis value (5.3466) and exhibits the largest age change effect. In addition, component 2 is right-skewed, indicating that the expression of FCPs is reduced at the older time point. Finally, we tested for sex differences through a two-sample t-test on each loading parameter. Components 4 and 5 show significant differences between males and females, with the directionality being the opposite (males show larger FCP changes for component 4 and females show larger FCP changes for component 5). This suggests these two distinct components might play a role in brain development in the male and female populations.
To examine the reliability of our method, we also ran our analysis on the second scan session data. Results showed the FCPs from the reliability analysis are consistent with the FCPs from the first scanned data (i.e., they show the same direction and relative effect size). We also performed a two-sample t-test on each second scan's loading parameter differentiated by sex. We observed that males and females generally manifest FCP in the same direction.
We computed ICCs for (1) FCP patterns, (2) one-sample t-test results, and (3) two-sample t-test results through comparison of the analysis in the article with that from the second scan session. Results show good to excellent reliability. FCP patterns were highly similar (all correlations ≥0.96), two-sample ICCs were ∼0.95, and one-sample ICCs were ∼0.75.
Correlation with composite psychopathology and cognitive scores difference
To further explore the relation of age-related brain FCPs with psychopathology and cognitive scores difference, we conducted a comparative analysis. The loading parameter for component 2 was significantly correlated (Pearson's coefficient, r = 0.048, p = 0.0043) with the psychopathology score change between baseline and year 2. We did not find a significant correlation between cognitive score difference and loading parameters for any component.
The ABCD data were acquired from 22 scanners with three types: GE, Philips, and Siemens. We also considered scanner effects to further validate our findings from psychopathology and cognitive scores. We conducted multiple regression analyses, including nuisance regressors for each scanner. The results showed no significant influence of scanner type on our findings, that is, the reported results were consistent in both cases.
Evaluation of subjects showing change patterns
We computed the correlation between the lower and upper quartile of loading parameters of the whole-brain functional network with the variables age difference, psychopathology score difference, and cognitive score difference. We found a positive correlation (Pearson's coefficient, r = 0.0926, FDR-corrected, and p = 0.0067) between the age difference and the lower quartile of loading parameter 5. The psychopathology score difference is also weakly positively correlated with the lower quartile of loading parameter 1 (Pearson's coefficient, r = 0.0639, FDR-corrected, and p = 0.049) and negatively correlated with the lower quartile of loading parameter 3 (Pearson's coefficient, r = −0.0671, FDR-corrected, and p = 0.06).
The cognitive score difference is showing a positive correlation (Pearson's coefficient, r = 0.077, FDR-corrected, and p = 0.024) with the upper quartile of loading parameter 4. The pps_y_ss_num difference is weakly negatively correlated (Pearson's coefficient, r = −0.0654, FDR-corrected, p = 0.055) with the upper quartile of loading parameter 3. We also ran a two-sample t-test on the upper and lower quartile of each loading parameter using sex information of age difference data. We observed that females show smaller FCP changes for the upper quartile of component 4 with increased age (p = 0.0365).
Functional change pattern covariation
We next computed the FCPC between the loading parameters. We find a high positive covariation between loading 4 and 5 and the correlation value is 0.357 (T4 = −14.0222 and T5 = −7.4531). We also find a large negative covariation between loading 4 and loading 2 (r = −0.3836 [T2 = 11.4683 and T4 = −14.0222]). The t value of components 4 and 5 are both negative, thus the FCP is more expressed at the older time point, and thus they exhibit positive covariation. The t value of component 2 is positive meaning these FCPs are less expressed at the older time point, whereas the t value of component 4 is negative, thus components 2 and 4 show negative covariation.
Association of FCPC with psychopathology score difference, cognitive score difference, baseline age, and age difference
We investigated the relationship of FCPC to subject measures (psychopathology scores difference, cognitive scores difference, baseline age, and age difference). From our results, we find at least one significant difference in each variable. Age difference showed the largest relationship in loading 2 and loading 5 (Pearson's coefficient difference Δr = 0.0840, and p = 5 × 10⁻⁴). The highest difference lies between loading 1 and loading 4 for baseline age (Pearson's coefficient difference Δr = −0.177, and p = 1.97 × 10⁻¹³), between loading 3 and loading 5 for psychopathology score (Pearson's coefficient difference Δr = −0.1106, and p = 4.48 × 10⁻⁶) and loading 1 and loading 4 for cognitive score (Pearson's coefficient difference Δr = −0.0863, and p = 3.67 × 10⁻⁴).
Discussion
Longitudinal investigations provide valuable insights into age-related connectivity changes within individuals (Kraemer et al., 2000), but there has been limited exploration of this using resting-state fMRI data to capture age-related whole-brain FCPs. In our study, we present an innovative method for comprehensively capturing changes in whole-brain FNC with age. We employ FNC matrices, identifying noteworthy longitudinal patterns of functional change. Notably, we observe a strengthening of brain FC between VSN and SMN with increasing age. Furthermore, our study uncovers associations between these FCPs and variables of interest, making it the first to investigate multiple overlapping brain FCPs longitudinally across the entire brain with age.
Our analysis reveals that component 2 and 4's FCPs have the highest positive and negative T values, respectively. For component 4, we observed an increasing FC coupling between the VSN and the SMN and between the CBN and the SCN for the 2-year period. This evidence indicates that the developing brain begins to establish connections among different regions, while simultaneously adapting its neural and cognitive systems to respond to external stimuli.
It is reasonable to infer that these connections among neural circuitry in the developing brain play a critical role in creating distinctions between regular and irregular neural dynamics. The T value associated with component 4 is negative (−14.02), indicating that this FCP is strongly negatively expressed in the data. We also observed a decreasing functional coupling between the VSN and CBN and SMN and SCN regions with age, which exhibited the largest positive T values.
In addition, component 2 exhibits a notably large positive T value of 11.47, signifying its strong positive expression in the data. This component is characterized by decreasing brain functional coupling with age, primarily observed in the DMN and SMN. Furthermore, CBN and DMN domains showed increasing brain FCPs for the 2-year period. The DMN, a crucial component of functional hubs involved in a variety of functional processes, has been a central focus in studies of age-related changes in FC (Raichle et al., 2001).
Ferreira and Busatto (2013) have reported that age-related declines in FC primarily impact the DMN and the dorsal attentional network. Our findings are further supported by recent studies similar to that of Park et al. (2022), which also observed reduced FC between sensory/unimodal networks and the DMN in the context of aging, as evidenced by Neuroscience in Psychiatry Network longitudinal data (Park et al., 2022).
We observed an interesting pattern in the loading parameters for all components, where the distribution of the loading parameters is super-Gaussian, which indicates a larger proportion of subjects show large positive or negative expressions of these components, potentially characterizing a healthy brain. A previous study utilized reduced super-Gaussianity as a biomarker to differentiate between progressive neurodegenerative diseases such as Parkinson's disease and amyotrophic lateral sclerosis compared with a healthy control group (Kodrasi and Bourlard, 2019). We hypothesize that super-Gaussianity could serve as a criterion for identifying healthy individuals who display significant positive or negative expressions with the components.
We acknowledge that certain correlation values although low, are statistically significant, due to the large cohorts. Many previous studies of large N population-based studies such as ABCD and UKBiobank tend to show small effects, ∼0.1, for many of the behavioral measures. This may well be the actual effect size. Our analysis revealed a significant correlation between the difference in psychopathology scores and the loading parameters for component 2, indicating that the decreasing functional coupling between DMN and SMN or increasing FC coupling between CBN and DMN during brain development are associated with composite psychopathology scores.
Although previous studies have attempted to link particular brain circuits to specific symptoms, dimensions, or behavioral measures across diagnostic categories, their design focusing only on a single behavioral measure or symptom domain prevents the discovery of continuous dimensions that span multiple categories (Adleman et al., 2012; Cole et al., 2014; Dichter et al., 2012; Drysdale et al., 2017; Kaczkurkin et al., 2016; Satterthwaite et al., 2016; Satterthwaite et al., 2015a; Satterthwaite et al., 2015b; Sharma et al., 2017). Our findings based on composite features overcome this limitation, suggesting an avenue for further studies on the developing brain.
We did not find any significant correlation between loading parameters and the difference in cognitive scores. Previous research has demonstrated that brain connectivity is positively correlated with both adult and child performance on cognitive tests (Langeslag et al., 2013; Li and Tian, 2014; Sherman et al., 2014; Song et al., 2008). These findings imply that complex multivariate pattern changes are occurring and that cognitive scores are related to the coordinated changes in these multivariate patterns.
One possibility that we did not observe significant connections is that studying the whole brain change in connection patterns, rather than focusing on specific brain regions or subnetworks, may have reduced sensitivity in this case. It is plausible that the complete network may not be sufficiently mature to perceive this relationship on a global level in children aged 9–10 years. Furthermore, we found a significant positive correlation between the cognitive score and component 4 in the upper quartile samples of loading parameter 4.
This finding suggests that subjects who have the largest changes in the functional connectivity pattern (FCP 4) show the closest association between the FCP and cognitive improvement. We also observed a significant positive correlation between age difference and the lower quartile of loading parameter 5. This finding suggests that subjects who contribute less to the FCP of the brain are associated with age differences.
In addition, we investigated the covariation of FCPs between the loading parameters of each component. Our results reveal a strong positive association between loading parameters 4 and 5, and a significant negative association between loading parameters 4 and 2. As is well-known, co-activated brain networks, that is, FNC, can be extracted from TCs acquired through ICA that show covariation between multiple TCs across different brain regions. In our case, we used a unique statistical approach to visualize the maximum independent components of brain functional pattern change covariation that show how components covary with each other across subjects.
We found significant differences in at least one domain for each of the variables under investigation: psychopathology scores difference, cognitive scores difference, baseline age, and age difference. Specifically, for age difference, the upper FCPC was greater than the lower FCPC. Furthermore, we observed that the lower FCPC was greater than the upper FCPC for baseline age, psychopathology scores difference, and cognitive scores difference.
Our proposed approach has some limitations that must be noted. First, throughout the process, we used ICA where the captured brain functional pattern changes are assumed to be linear. However, recent work by Motlaghian et al. (2021) has shown that functional networks can exhibit nonlinear relationships, which are typically ignored in the linear analysis. It would be useful to explore some nonlinear approaches to investigate the age-related FCPs in the developing brain.
Second, we studied FCPs for a 2-year period, but our observed results can remain unchanged or vary with an increased age difference. As the ABCD data study continues, we can use more time points to capture multiple overlapping brain FCPs in the developing brain. Third, we conducted the analysis on the association between sex (biological sex assigned at birth) and FCPs but not with gender identity in this study.
However, we plan to perform this analysis in the future. Finally, this study used 9- to 10-year-old youth data, and subjects may have relatively low levels of psychiatric symptomatology (Escrichs et al., 2021), although it is expected that their psychopathology load will rise during adolescence (Paus et al., 2008). The relationship between the brain and behavior could be stronger, weaker, or otherwise change, which can be directly tested in future waves of longitudinal ABCD data, allowing us to make a clear hypothesis.
Conclusion
In this study, we introduced a novel approach that uses FNC matrices to compute multiple overlapping brain FCPs over age. By examining changes in FC over time, we gain insights into how the developing brain adapts its connectivity to enhance rational information processing. Our results showed several significant FCPs for a 2-year period. From FCPs, we observed the increasing and decreasing FC, including increased coupling between the VSN and SMN domains and decreasing anticorrelation between sensorimotor and cognitive/DMN domains with increasing age.
We also found several FCPs that are associated with psychopathology, cognition, and age in the developing brain. Finally, our proposed approach to investigating the age-related FCPs in the developing brain is the first approach that can be a useful tool to evaluate covarying patterns of whole-brain functional changes in longitudinal data. We believe this sort of study would be helpful to look into the aberration of FC in the developing brain. It will enrich our knowledge about overall brain circuitry and the alteration required for information processing.
Footnotes
Authors' Contributions
The study was designed by R.S. and V.D.C. Data preprocessing was performed by Z.F. The experiment design was contributed by R.S. and V.D.C. R.S. conducted the analyses, performed the statistical analysis, and drafted the initial article. The article was edited by V.D.C., D.K.S., Z.F., J.L., and M.A.R. All authors participated in various stages of experimental analyses and approved the final version of the article.
Data Availability Statement
The data used in this study are available through the NIMH Data Archive. The FCP approach is implemented within the GIFT toolbox and will be provided in a future release of GIFT.
Author Disclosure Statement
The authors declare no potential conflict of interest.
Funding Information
The study was funded by the NIH (R01MH123610) and the NSF (2112455).
Supplementary Material
Supplementary Data
References
Supplementary Material
Please find the following supplemental material available below.
For Open Access articles published under a Creative Commons License, all supplemental material carries the same license as the article it is associated with.
For non-Open Access articles published, all supplemental material carries a non-exclusive license, and permission requests for re-use of supplemental material or any part of supplemental material shall be sent directly to the copyright owner as specified in the copyright notice associated with the article.