
Abstract
Background:
In this study, we analyze metastability, a feature of brain dynamics in subjects experiencing mild cognitive impairment Alzheimer's disease (MCI-AD) under eyes open (EO) and eyes closed (EC) conditions. Alzheimer's disease (AD) is a critically prolonged brain disorder that interrupts neural synchronization and desynchronization. Thus, studying metastability under EO and EC conditions would help in understanding the cortical dynamics and its impact in early-stage AD.
Methods:
Metastability is investigated using three methods namely frequency variance analysis, Kuramoto order parameter, and through meta-state activation patterns. Frequency variance estimated from 21 electroencephalogram (EEG) channels was clustered into three regions namely anterior, central, and posterior to study the regional metastability analysis. Global metastability was assessed from Kuramoto order parameter and meta-state activation patterns by collating the 21 EEG channels.
Results:
Reduction in metastability was observed in central regions of MCI-AD subjects through the study of frequency variance analysis. There was a marked reduction in global metastability in the patient group under the resting EO condition. Reduction in meta-state activation properties such as temporal activation sequence complexity, modularity, and leap size in MCI-AD condition under the EO condition indicates an overall reduction in brain flexibility.
Conclusion:
Taken together, the study infers an underlying structural change in neuronal dynamics influencing the reduction of metastability under the MCI-AD condition. The study further revealed that this reduction in metastability is more pronounced in the EO condition.
Impact statement
Metastability is a mechanism that could explain the capacity of the brain to spontaneously transition among oscillatory states introducing complexity in neurological signals such as electroencephalogram (EEG). Eyes open and eyes closed conditions induce distinguishable dynamics in the brain. Analysis of metastable neural dynamics under mild cognitive impairment-Alzheimer's disease condition could provide new insights into cortical dynamics of the brain that can aid in the early detection of Alzheimer's disease.
Introduction
According to the recent research on brain coordination dynamics, it is found that the healthy brain operates in a metastable regime, allowing rapid transitions between multiple states (Friston, 1997; Shanahan, 2010; Tognoli and Kelso, 2014). This dynamic self-assembling process, with parts of the brain engaging and disengaging in time, is explained as the metastability (Kelso and Tognoli, 2007; Tognoli and Kelso, 2014). Metastability provides a means to understand how complex patterns emerge from the brain structure.
It explains the rapid transitions to a wide repertoire of functional brain states (Deco et al., 2017) and confers important behavioral properties of the brain: global integration and local segregation (Tognoli and Kelso, 2014). The coordination dynamics describes how brain regions express their individual autonomy and specialized functions (segregation and modularity), while coexisting with tendencies to couple and coordinate globally (integration).
Metastability feature in the brain has been studied under resting (Cavanna et al., 2017) cognitive task condition (Alderson et al., 2020), under the influence of anesthesia (Hudson, 2017) in neurological disorders such as autism spectrum disorder (Frohlich et al., 2014), schizophrenia (Koutsoukos and Angelopoulos, 2018; Lee et al., 2019), and Alzheimer's disease (AD) (Córdova-palomera et al., 2017; Núñez et al., 2021).
A recent study revealed stable global metastability in multiple functional magnetic resonance imaging (fMRI) acquisition of the same subjects (Hancock et al., 2022). Utilizing metastability estimated from fMRI, a possible neuromechanistic biomarker for schizophrenia has been identified (Hancock et al., 2023). However, it is not fully understood how metastability of the brain is affected under eyes open (EO) and eyes closed (EC) conditions in prodromal stages of AD, and this study is an investigation in this direction.
AD is a progressive neurodegenerative disorder that disrupts normal brain activity. The disease is presented with symptoms of reduced cognitive skills and memory loss. Electroencephalogram (EEG) represents the complex electrical activity present in the brain. EEG could provide information about the variation in brain dynamics under a neuronal disorder such as AD. Earlier studies on EEG analysis have reported alteration in functional dynamics with reduced synchrony and complexity in AD patients (Dauwels and Cichocki, 2011).
The reduction of small world characteristics was identified in AD and mild cognitive impairment Alzheimer's disease (MCI-AD) (Das and Puthankattil, 2020; Stam et al., 2006). Brain functional networks with small worldness demonstrate efficient network segregation and integration. Thus, reduction of small worldness infers significant changes in the brain activation patterns in the functional networks of AD and MCI-AD. Metastability estimate from EEG could provide additional information about the changes in the functional brain dynamics in AD.
However, limited studies have explored the metastability aspect on the functional dynamics of MCI, AD with the help of resting state fMRI (Alderson et al., 2020), and EEG (Núñez et al., 2021). It is also probable that the difference in brain activation could be reflected in EEG metastability and would also be influenced by EO and EC conditions.
EO and EC conditions reflect two different integration patterns in the brain (Marx et al., 2004; Marx et al., 2003). Functional connectivity studies in EO and EC conditions report an increased connectivity pattern in the EC condition (Tan et al., 2013; Weng et al., 2020). The difference in connectivity patterns between EO and EC conditions was further prominent in the presence of a neurological disorder such as early stage AD and AD (Das and Puthankattil, 2020; Miraglia et al., 2016).
To the best of our knowledge, the influence of EO and EC conditions in metastability was not widely investigated in neurological disorders. This study gives more focus on the difference in metastability under resting state EO and EC conditions in MCI-AD patients and healthy controls.
Metastability in EEG signals is analyzed using three approaches: frequency variance analysis (Frohlich et al., 2014), variance of Kuramoto order parameter (Alderson et al., 2020; Córdova-palomera et al., 2017), and through metastable activation patterns (Núñez et al., 2021). The frequency variance method captures the rate of change of signal phase as a proxy for signal stability. The phase resetting in each individual EEG channel is analyzed to derive frequency variance data to estimate the metastability property.
The instantaneous collective behavior of a group of connected oscillators could be estimated by the Kuramoto order parameter. The estimate of phase coherence through the Kuramoto order parameter provides variability in phase synchronization and indicates the metastability of the system. The metastable activation pattern was derived from a time series of dynamic functional connectivity matrices. It provides the distinct sequence of metastable activation patterns that gets activated under different brain activity.
The aim of this study is to determine the changes in metastability behavior under resting state EO and EC conditions. The EEG signals of MCI-AD and control population, under EO and EC conditions, were recorded. The analysis was performed on the alpha band of EEG signals. Alpha band was selected for subsequent analysis as larger deviations in connectivity patterns were previously reported in this band under EO and EC conditions (Das and Puthankattil, 2020). Furthermore, earlier research has demonstrated that the thalamocortical and corticocortical components of the brain interact to generate cortical alpha rhythms and are disturbed by the loss of network complexity (Da Silva et al., 1980; Ingber and Nunez, 2011).
Materials and Methods
EEG data acquisition
EEG data were recorded from the scalp of the brain based on 10–20 electrode placement protocol. The data are acquired from 21 electrode locations (Fp1, Fp2, F3, F4, C3, C4, P3, P4, O1, O2, T1, T2, F7, F8, T3, T4, T5, T6, Fz, Cz, Pz). For the analysis of data, EEG channels were further grouped into anterior (Fp1, Fp2, F7, F3, Fz, F4, F8), central (T3, C3, Cz, C4, T4), and posterior (T5, P3, Pz, P4, T6, O1, O2) regions. Figure 1 provides the plot of the 10–20 electrode system. The 10–20 method is meticulously designed to ensure appropriate interelectrode spacing, considering the individual variations in skull size and shape.

The numbers “10” and “20” signify that the distance between adjacent electrodes corresponds to either 10% or 20% of the total front–back or right–left distance between them. The placement of these EEG electrodes was performed by the EEG technician under the supervision of a consultant neurologist. Attention was given to the preparation of EEG electrode placement and scalp areas to minimize impedance-related issues that could lead to artifacts. In addition, a stable recording environment was maintained, with EEG recordings conducted between 9 AM and 12 PM.
The recordings were conducted under the supervision of a neurologist to ensure data quality. Two recording protocols adopted were EC and EO conditions under resting state. EEG data were recorded for 5 min duration for each of the protocols at a sampling frequency of 400 Hz. A notch filter was utilized to remove the power line frequency of 50 Hz from the EEG signal. EEG signals were preprocessed with simultaneous low pass filter and total variation denoising (LPF/TVD) algorithm (Nimm et al., 2018; Selesnick et al., 2014).
Signal to noise ratio has been calculated to ensure the efficacy of the preprocessing technique. An epoch of 2 min is selected from the recorded EEG signals of each control and patient. The alpha band from EEG signal was extracted through multiresolution decomposition involving wavelet transform. The wavelet “db 10” was observed to have maximum correlation with most of the EEG signals in the data set. Independent component analysis (ICA) was performed on the EEG signals recorded from MCI-AD patients and healthy controls for identifying brain-related independent components (ICs). EEG signal is reconstructed after removing noisy ICs such as eye blinks and muscle artifacts.
Participants
Thirteen MCI-AD patients (7 males, 6 females) and 20 healthy controls (10 males, 10 females) participated in the study. The acquisition of EEG data was carried out from Sree Chithra Tirunal Institute of Medical Sciences and Technology (National Hospital), Trivandrum, Kerala, India, with Institutional Ethics Committee (IEC) approval. The study was conducted after taking the written and informed consent from the subjects. Consultant neurologist was present during the recording of the EEG signal. Subjects with clinical dementia score (CDR) <1 were selected under the MCI-AD sample population.
Further mini-mental state exam (MMSE) and Addenbrooke's cognitive examination (ACE) were utilized as the cognitive screening techniques for rating the MCI-AD condition. The neurologist also ruled out other potential causes of cognitive impairment, such as depression or medication side effects. Clinical and demographic data of MCI-AD patients and healthy controls are provided in Table 1. MMSE score was lower for the patient group than for controls with a statistically significant difference of p = 0.0001. Similarly, ACE score was also lower for the patient group with a statistically significant difference of p = 0.0002. The groups did not differ in age as the distributions did not show a significant statistical difference, with p = 0.09.
Clinical and Demographic Data of Mild Cognitive Impairment Alzheimer's Disease Patients and Healthy Controls
ACE, Addenbrooke's cognitive examination; MCI-AD, mild cognitive impairment Alzheimer's disease; MMSE, mini-mental state exam.
Estimation of metastability measures
Metastability estimates of EEG were captured through three approaches: frequency variance analysis, standard deviation of Kuramoto order parameter, and by estimating properties of meta-state activation patterns. Frequency variance analysis provides more local information of metastability of individual EEG channels. Standard deviation of the Kuramoto order parameter provides a global estimate of metastability considering the 21 EEG channels together. Furthermore, the properties of metastable activation patterns were studied through rapidly changing brain connectivity patterns through the Louvain GJA community detection algorithm (Gates et al., 2016).
For the analysis, the real EEG signals were required to be converted into analytical signals to extract instantaneous phase and amplitude information. Hilbert transform was utilized for this purpose. The Hilbert transformed signal was further processed and the required amplitude and phase information was extracted. The equations for these operations are as follows:
For a real signal
where H represents Hilbert transform and
Frequency variance analysis
Frequency variance parameter is utilized to derive information about the frequency stability of EEG signals. The time derivative of the unwrapped analytic phase of the signal is the instantaneous frequency

The normalization operation on instantaneous frequency values was performed by subtracting the mean frequency from the instantaneous frequency values. The normalization process could enhance the frequency variance in the data and thus derive a more approximate measure of signal stability. Here N is the length of the data sample and i, j, and k take values from 1 to N.
The variance fv
, of normalized instantaneous frequency fk
, is taken as the proxy for phase reset (Frohlich et al., 2014).
The study conducted by Frohlich et al. (2014) has demonstrated the increase of fv
with artificially induced phase resets in the surrogate signals. The estimate of signal stability fs
could be derived from the inverse relation to the variance fv
.
Kuramoto order parameter
The Kuramoto order parameter describes the global synchronization of N number of oscillating signals (EEG signals). The order parameter takes value from 0 to 1 and measures the phase coherence of N oscillators. Order parameter of 1 represents perfectly synchronized oscillators and 0 represents perfectly unsynchronized oscillators. The order parameter in between 1 and 0 means a persistent phase relationship between a few channels. The repertoire of these channels is, therefore, an indicator of metastability (Deco and Kringelbach, 2016). Symbol ψ represents the average phase of collective oscillators.
Meta-state activation pattern
Meta-states are distinctly organized network patterns of brain activity. The study of meta-state activation sequence provides the information of meta-states that repeat in a time varying neural activity. Extraction of meta-state activation sequence involves estimating instantaneous amplitude correlation functional connectivity (IAC-FC) time series (Núñez et al., 2021). Data driven windows were estimated from a recurrence plot (RP) of IAC-FC time series data (Tewarie et al., 2019).
The community detection algorithm Louvain GJA method was further utilized to study meta-state activation patterns (Gates et al., 2016). Finally, parameters that could infer information about the features of meta-state activation sequence were further analyzed.
IAC is a functional connectivity metric that is based on the statistic that if two regions simultaneously display high amplitude, then it could be inferred that there is high correlation between the respective amplitude envelopes (Brookes et al., 2011; O'Neill et al., 2015; Tewarie et al., 2019). IAC and meta-state activation parameters are estimated based on Núñez et al. (2021).
IAC is the Hadamard product (
Spearman correlation between IAC-FC time series is used to estimate RP.
where
Further IAC is temporarily averaged within the data driven windows, and community detection algorithm Louvain GJA method was utilized to quantify meta-state properties through various metrics of the metastable activation pattern. The nonwindowed FC was assigned to the nearest meta-state by means of spearman correlation distance. The resulting time series data thus derived are termed as the temporal activation sequence (TAS) (Núñez et al., 2021).
The different metrics for metastable activation are average dwell time, TAS complexity, leap size, and modularity (Núñez et al., 2021). Average dwell time is the time the brain spends in the dominant meta-state on an average. TAS complexity measures the structural richness of meta-state activation sequencing. Complexity is measured through the nonparametric complexity estimator of the Lempel–Ziv complexity. Leap size characterizes the metabolic cost of transitioning from one meta-state to another. It is computed as the distance between one meta-state to another. Modularity measures the strength of links within a community compared with links outside the community. It is interpreted as how well defined and separated the meta-states are for each subject.
Statistics
One way analysis of variance (ANOVA) has been performed to estimate the statistically significant difference between patient and control groups for frequency variance analysis and metastability estimate of Kuramoto order parameter. Normality in the data was ensured by the Shapiro–Wilk test. However, the parameters from metastable activation analysis did not meet parametric assumptions, for which the Wilcoxon rank sum (Mann–Whitney) test, a nonparametric test, has hence been employed.
Results
Frequency variance method
A significant difference in frequency variance was observed between patient and control groups under EO and EC conditions. The study revealed an increase in frequency variance value under EO and EC conditions for the patient group in comparison with the healthy controls. Statistically significant difference was observed in the central region under EC (F = 3.940, p = 0.05, η = 0.132) and EO conditions (F = 7.982, p = 0.009, η = 0.22). Anterior and posterior regions did not reveal any statistically significant differences in frequency variance.
Global metastability analysis using the Kuramoto order parameter
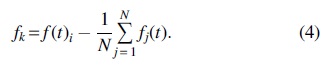
Figure 2 shows the metastability plot of controls and patients under the EC and EO protocol. The study revealed the elevation of metastability in controls with respect to the MCI-AD patients, under both the recording protocols. Among the two recording protocols, the EO protocol revealed prominent reduction in metastability, indicating the capability of the EO state in capturing the functional alteration caused by MCI-AD effectively. Statistically significant difference (F = 3.853, p = 0.03, η = 0.134) in metastability was revealed in the EO protocol. The EC protocol did not record any statistically significant difference. Statistically significant difference in metastability was not observed between the EO and EC recording protocols.
Global metastability analysis of EEG signals of MCI-AD patients and healthy controls under
Metastable activation analysis
The metastable activation pattern was estimated through four estimators namely average dwell time, TAS complexity, leap size, and modularity. Figures 3 and 4 show the box chart plots of mean values of average dwell time, leap size, TAS complexity, and modularity of the patient and control groups, under the two recording protocols EC and EO, respectively. No notable difference is observed in average dwell time between patients and controls under the EO and EC conditions. However, TAS complexity, leap size, and modularity estimators in patient EEG have displayed considerable variations with respect to the control EEG signals.

Box plot for values of metastable activation parameters for patients and controls under EC state. y-axis represents

Box plot for values of metastable activation parameters for MCI-AD patients and healthy controls under EO state. y-axis represents
The study has shown that this variation is predominant in the EO protocol. Lower TAS complexity was observed for the patient group in the EO condition with significant difference of p being 0.005015. Significant difference in leap size was revealed in the EO condition with p being 0.043541. The study further revealed that the patient group has a lower modularity score under EO and EC conditions, maintaining a significant difference between patient and control groups. Lower modularity was revealed for the patient group with a significant difference of p being 0.001 in the EC condition and 0.05 in the EO condition. TAS complexity and leap size indicate the richness of meta-state activation sequencing, whereas modularity suggests the level of differentiation in the EEG network organization.
Reduction of metastability was observed in the central region of the brain for the MCI-AD group employing frequency variance method. Further evidence of reduced metastability in MCI-AD was ascertained during global analysis using the Kuramoto order parameter and meta-state activation sequences. It is observed from this study that the reduction of metastability has greater impact on the EO state than on the EC state.
Discussion
This study looks into the integration pattern of brain in resting state under the EO and EC conditions in MCI-AD with an emphasis on metastability. The study estimates metastability features employing three techniques: estimating the frequency variance in individual EEG channels, global metastability of the system through Kuramoto order parameter, and finally through meta-state activation patterns from dynamic functional connectivity data. The analysis was performed on the alpha band of the EEG signals acquired under the recording protocols of the EO and EC conditions.
The frequency variance as a proxy for phase resetting in the EEG signals was estimated (Frohlich et al., 2014). The frequency variance analysis revealed notable differences in three anterior, central, and posterior regions under both EO and EC conditions. These three regions were deduced from the 21 EEG channels. Significant increase in frequency variance measure was observed for MCI-AD patients irrespective of the recording conditions. The increase in frequency variance is related to decrease in frequency stability.
Statistically significant difference in frequency variance was observed in the central brain region of MCI-AD patients under the EO and EC conditions. Central region includes electrodes from temporal and parietal regions. Subjects with cognitive decline have demonstrated atrophy and loss of gray matter in specific cortical areas, including the medial temporal and parietal lobes. Earlier research on individuals with MCI has shown reduced connectivity between different brain regions, indicating decreased network integration (Das and Puthankattil, 2020; Gurja et al., 2021).
Some studies have also suggested the existence of compensatory mechanisms in MCI (Bajo et al., 2010; Clément and Belleville, 2010). Impairment in hub regions could potentially lead to the formation of new dysfunctional connections between different brain regions as a compensatory response. This compensation might take the form of synaptic adjustments, which act as homeostatic mechanisms to prevent rapid cognitive decline (Sperling et al., 2010).
Therefore, the presence of amyloid pathology in central regions could potentially alter communication between different brain regions, ultimately influencing the variability observed in frequency variance measures. It could be thus inferred that the variations in phase resetting properties of EEG signals indicate subtle neurological changes prominently in central regions of the brain introduced by the MCI-AD condition.
The global metastability has been estimated through standard deviation of the Kuramoto order parameter. This approach offers a holistic perspective on global metastability by considering the interplay among all the oscillators within the system. The collective behavior of the oscillator ensemble effectively quantifies the degree of phase synchronization among 21 channel EEG data and provides evidence of the persistence of certain states.
The variability in the synchronization estimated by the Kuramoto order parameter serves as an indicator of the overall metastability of the system. The study displayed an impact of recording conditions on metastability, in the EO and EC conditions. The metastability of the system was observed to be reduced in MCI-AD subjects specifically in the EO condition. The results from the study thus reveal that the EO condition has less variability and a reduced dynamic repertoire of system states. This is indicative of a system-reduced flexibility and efficiency.
Alterations in dynamic functional connectivity patterns were captured under the influence of EO and EC conditions in MCI-AD patients and control group. The methodology adopted in the study captured the changes in the meta-state activation sequences with notable changes being observed in the patient group. The study revealed reduction in modularity, leap size, and complexity, indicating a loss of meta-state activation sequences in the patient group in comparison with the controls under the EO condition. Modularity indicates how well defined and separated is each meta-state in the subjects.
Reduction in modularity was observed in the MCI-AD group under the EO and EC conditions. Average dwell time, TAS complexity, and leap size could infer the amount of variability and flexibility of the system. In our present study, no significant differences were observed in the average dwell time between the patient and control groups. TAS complexity is an indicator for temporal evolution of the meta-state sequences in the time series data. Reduction in TAS complexity coupled with metabolic cost (leap size) indicates reduction of meta-state sequences in MCI-AD subjects under the EO condition compared with the healthy controls. The findings from the study deduce an underlying structural change in neural functioning under the MCI-AD condition and is prominently observed in the EO condition.
Metastability estimation employing the three methods reveals certain converging inferences. One of the common features was the reduction of metastability property in the patient group. It implies an alteration in underlying neuronal activity in the MCI-AD condition contributing to the reduction of metastability. Reduced metastability infers the reduction of repertoire of brain states that allows the brain to spontaneously transition (Hellyer et al., 2015). Thus, reduction in metastability was linked to the reduction of brain flexibility, speed of information transmission, memory, and fluid intelligence (Alderson et al., 2020; Hellyer et al., 2015).
MCI-AD condition has been associated with symptoms of reduced cognitive ability and mild case of dementia (Brendan and Petersen, 2009; Sperling et al., 2010). Thus, a link between reduction in metastability and reduction of cognitive ability in MCI-AD subjects could be established. Further reduced metastability has been previously associated with alteration in structural connectivity (Alderson et al., 2020; Córdova-palomera et al., 2017; František et al., 2015; Hellyer et al., 2015). It should be noted that the structural connectivity studies in the MCI-AD condition have also reported the observance of significant changes in the network topologies (Tucholka et al., 2018).
Structural connectivity serves as the physical basis that supports functional connectivity within the brain. Alterations in structural connectivity can lead to changes in functional connectivity. This could influence the brain metastability thus giving rise to fluctuations in the brain dynamics and its adaptable traits. Further studies need to be conducted to develop a correlation between reduction in metastability and reduction of cognitive ability in MCI-AD. So far studies have linked alteration in metastability to senescence (Naik et al., 2017), cognitive task (Alderson et al., 2020), and autism spectrum disorder (Frohlich et al., 2014). This study also establishes the plausible variance of metastability to the resting sates of EO conditions in early stages of AD.
EO and EC conditions represent two different integration patterns in the brain (Marx et al., 2004; Marx et al., 2003). Earlier studies have reported that the brain tends to stay in hypoconnected state under the EO condition and in a hyperconnected state under the EC condition (Weng et al., 2020). It was reported that a large amount of mind wandering and presence of drowsy state at the EC condition may have caused large variability in brain activity. However, the analysis did not display significant differences between EO and EC conditions in healthy controls and MCI-AD patients.
Noticeable reduction in metastability was observed under the EO and EC states in MCI-AD patients with respect to the control group. The difference between EO and EC conditions was most prominently observed in global metastability, which was estimated through the Kuramoto order parameter and meta-state activation parameters. Variations were observed in leap size, TAS complexity, and modularity during the analysis of meta-state activation. It is inferred from this study that the reduction of metastability is more prominent in the EO condition in the MCI-AD patient group. It could be interpreted that reduction in variability in brain activity is more prominent in the presence of MCI-AD in the EO condition.
Earlier studies in MCI-AD and AD have reported a reduction in functional connectivity in the patient group (Das and Puthankattil, 2020; Jeong, 2004; Triggiani et al., 2017). Studies have proposed that the reduction of functional integration observed in MCI-AD could be more prevalent in the EO condition than in the EC condition (Das and Puthankattil, 2020; Miraglia et al., 2016). There have been studies that directly correlated the behavior of metastability with synchrony of the system (Alderson et al., 2020).
Thus, the reduction of metastability in the EO condition in the patient group could be correlated with a reduced synchrony. Furthermore, the studies have reported that the EO condition has more test–retest reliability (Zou et al., 2015), making it an ideal protocol for metastability analysis.
Conclusion
In this study, we have analyzed the metastability in subjects experiencing MCI-AD under the resting state EO and EC conditions. With three different methods employed for the estimation of metastability, the study shows a reduction in metastability in the chosen patient group. Regional analysis of metastability indicated a significant reduction of frequency stability in the central region. Global metastability study conducted using the Kuramoto order parameter displayed that the reduction is prominent under the EO condition in the MCI-AD condition.
Analysis of meta-state activation sequence displayed a reduction of meta-state sequences in the EO condition with the reduction of TAS complexity and metabolic cost. Reduced modularity observed suggests the diffusive nature of EEG state network in MCI-AD subjects both under the EO and EC conditions. Results of this study indicate that prodromal stages of AD have significantly altered the underlying network topologies influencing the metastability behavior of the system. Taken together, it may be concluded that the EO condition could be a more preferred recording condition to study altered neural dynamics in the MCI-AD condition.
Footnotes
Authors' Contributions
S.D. contributed to conceptualization, methodology, software, writing—original draft, writing—review and editing, and visualization. S.D.P. was involved in data acquisition, conceptualization, writing—review and editing, and supervision.
Author Disclosure Statement
No competing financial interests exist.
Funding Information
No funding was received for this article.