
Abstract
Background:
Individual differences exist in performance in tasks that require visual search, such as camouflage detection (CD). Field dependence/independence (FD/I), as assessed using the Group Embedded Figures Test (GEFT), is an extensively studied dimension of cognitive style that classifies participants based on their visual perceptual styles.
Materials and Methods:
In the present study, we utilized fMRI on 46 healthy participants to investigate the underlying neural mechanisms specific to the cognitive styles of FD/FI while performing a CD task using both activation magnitude and an exploratory functional connectivity (FC) analysis. Group differences between high and low performers on the two extremes of the accuracy continuum of GEFT were studied.
Results:
No statistically significant group differences were observed using whole-brain voxel-wise comparison. However, the exploratory FC analysis revealed an enhanced communication between various regions subserving the cognitive traits required for visual search by FI participants over and above their FD counterparts.
Conclusion:
These enhanced connectivities suggest additional recruitment of cognitive functions to provide computational support that might facilitate superior performance in CD task by the participants who display a field-independent cognitive style.
Impact statement
fMRI was carried out to assess the differential neural activation for a camouflage detection task in healthy individuals with differential cognitive styles of field independence/dependence, as evaluated by the Group Embedded Figures Test. The functional connectivity analysis revealed an enhanced connectivity between the regions dedicated to visual attention allocation, object identification, and complex figure analysis in the participants who displayed a field-independent cognitive style. These additional interactions might be providing cognitive resources facilitating superior performance in a visuospatial task such as camouflage detection by such individuals.
Introduction
Camouflage detection (CD) is a “visual search task” in which the participant is required to distinguish target objects among the “distracters” (Troscianko et al., 2009; Wolfe et al., 2002). This visual search task incorporates motion perception, edge detection, perceptual strategy, texture segregation, and shape recovery (Troscianko et al., 2009). In most real-world searches, the background is continuous and usually heterogeneous (Wolfe et al., 2002) and is often heavily loaded with noise, that is, distracters. A successful target recognition requires first observing the object as a separate foreground from the background (Wolfe et al., 2002). The background complexity causes a slowdown in the segmentation efficiency of an image, which may cause errors in target recognition (Boot et al., 2009; Wolfe et al., 2002). The individual's CD ability is an outcome of object encoding, grouping, and visual search (Troscianko et al., 2009).
CD involves an individual's figure-background separation ability in a perplexing background. It is a remarkable human ability with high individual variance (Rajagopalan et al., 2015). Field independence (FI)/Field dependence (FD) is one of the extensively studied cognitive styles (Messick, 1976), in which embedded objects are required to be isolated from the background (Witkin, 1950). The field-independent person tends to be less distracted by the visual field's information and can easily recognize complex figures as separate objects from their embedding backgrounds. In contrast, a field-dependent individual experiences events globally in an undifferentiated manner, exhibits more dependence on the surrounding field, finds it hard to perceive the embedded object, and performs poorly on such tasks (Hao et al., 2013; Messick, 1976; Witkin and Goodenough, 1977). A person's perceptual tendency is associated with several factors such as neurocognitive functioning, personality traits, and social behavior (Kozhevnikov, 2007).
Group Embedded Figures Test (GEFT) is an adaptation of the Embedded Figures Test (EFT), which is used to assess the FI/FD cognitive style and analytical competence by scoring the FD and FI propensity of an individual (Oltman et al., 1971). The GEFT score is a continuous distribution that measures the extent to which an individual reflects one perceptual tendency more than the other (FD/FI).
An earlier study on the perceptual differences in FI/FD (Canelos et al., 1980) has shown FI participants to outperform FDs in learning to perform for different levels of visual stimulus complexity. Earlier literature primarily focused on the behavioral differences in FI/FD (Frank and Davis, 1982; Lu and Suen, 1995), with a slight endeavor to demonstrate this theory using a neurobiological model to understand the neural correlates that might help to differentiate the participants of different cognitive styles. A study by Nisiforou and Andrew Laghos (2013) observed that differences in eye-gazing patterns entail differences in an individual's cognitive style. Attention to the nuances of a figure is a crucial factor in a visual perception test such as GEFT. Therefore, eye movements also play a role in an individual's figure background separation ability.
An electroencephalography (EEG) study of 26 participants classified into 2 groups of extreme FI and FD participants revealed that the FD/FI cognitive style influences conflict processing due to the differing capacity of FI and FD participants in allocating mental-attentional resources (Meng et al., 2012). Another EEG study (Farmaki et al., 2019) reported a higher peak amplitude as well as latency of the frontoparietal positivity in FD participants compared with FI. Furthermore, FD participants also had delayed responses at the occipital and central electrodes.
A volumetric study on field dependence/independence (FD/I) cognitive style revealed that increased gray matter volume in the left inferior parietal lobule (IPL) could be the structural basis behind high EFT scores (Hao et al., 2013). Furthermore, the resting state data analysis in the same study showed a significant positive correlation between the EFT score and amplitude of low-frequency fluctuations in the left IPL, frontoparietal network, and medial prefrontal cortex (mPFC) of the default mode network (DMN). The authors suggested that the mPFC might be associated with cognitive repression of the global visual processing bias, and the left IPL might be related to superior feature identification. Therefore, they emphasized superior local processing ability and cognitive inhibition as critical factors affecting an individual's FD/I cognitive style (Hao et al., 2013).
Using an fMRI study on EFT, it was proposed that the posterior parietal brain regions play an essential role in contextual information processing in several visuospatial tasks, and that the parietal and frontal brain regions coordinate this information processing in participants proficient in the task (Walter and Dassonville, 2011).
An earlier fMRI study on the FD/FI cognitive styles conducted at our center reported differential neural activation associated with FD/FI cognitive styles for a CD task (Rajagopalan et al., 2015). In the present study, we extended the analysis of regional activation and task-adaptive regional communication patterns for a CD task in FI and FD as identified using the GEFT.
We attempted to answer the following three research questions utilizing fMRI: First, which brain regions provide the functional underpinning for CD in the FI and FD population, and whether the groups (FD/FI) differ on standard voxel-wise brain activation-based measures? Second, we did an exploratory analysis to assess whether the functional connectivity (FC) between thresholded functional activation cluster-driven regions of interest (ROIs) and various other brain regions differs between FD and FI populations? Third, given that FD/FI participants might allocate differential attentional and working memory resources towards the perceptual task, we further explored the differential FC between the known functional brain networks. We sought to investigate if unique FC patterns present during CD may account for FI's superior performance in visual search tasks such as GEFT compared with FD participants. We hypothesized neural activation and FC differences between brain regions/networks as the functional basis for the high performance of the field-independent population.
Materials and Methods
Participants
The study was approved by the Local Ethics Committee of the Institute of Nuclear Medicine and Allied Sciences. Informed written consent was obtained from the participants, and the study procedure was fully explained to them. Participant's identity was kept anonymous during the entire study. All the participants were screened for underlying subclinical depression using the Beck's Depression Inventory (BDI-II) test (Steer et al., 1999). This study did not include participants with a BDI score of more than 12. A total of 48 healthy volunteers participated in this study. Participants had no clinical evidence or history of brain trauma, stroke, cardiovascular disease, drug dependence, and cognitive impairment, or neurological/psychotic disorder. T2-weighted MRI images were taken to confirm the absence of cortical infarctions and other such medical conditions.
The Group Embedded Figures Test
The BDI-screened participants participated in the GEFT. The GEFT consists of 18 complex figures and can be administered in 10 min, and is scored using answer templates (Witkin and Goodenough, 1977). The GEFT consisted of three sections and was conducted using a pen-and-paper method. The first section is for practice to make the participant comfortable and familiar with task instructions. The other two sections consist of nine questions, scored with one point for each correct answer. The task is to identify hidden simple forms in the perplexing background by drawing simple forms over complex images (Fig. 1). The participants thus can get a score between 0 and 18.
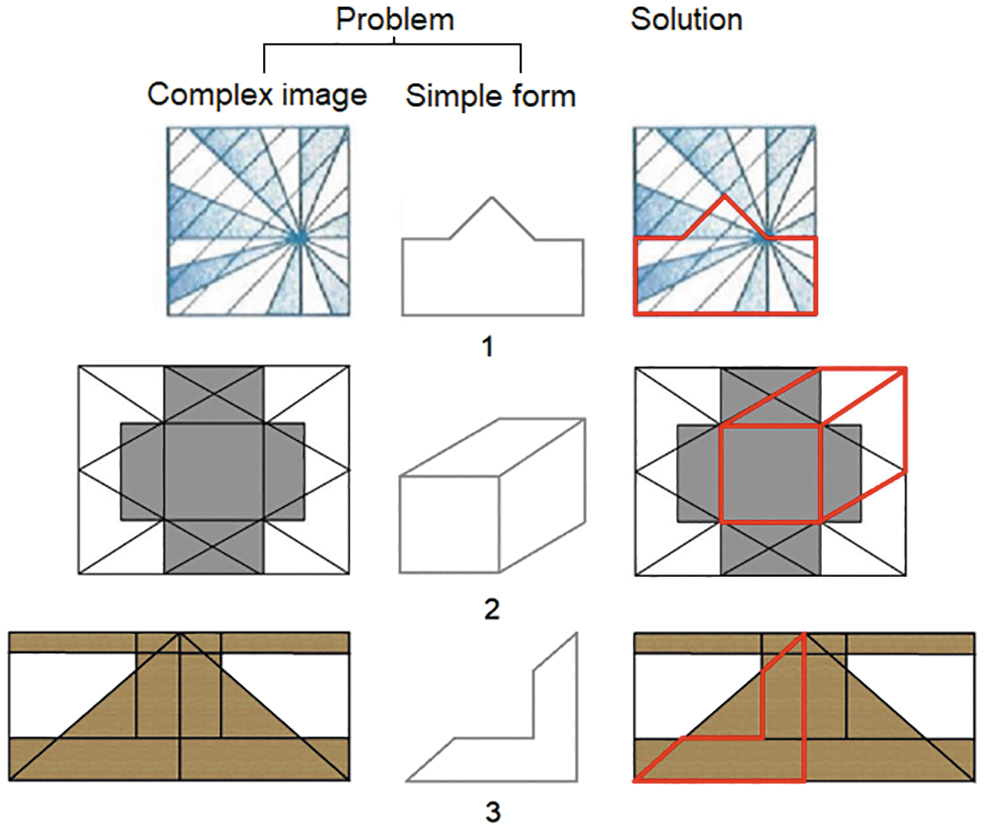
Sample images from GEFT. Simple forms have to be identified in the complex images. GEFT, Group Embedded Figures Test.
To classify participants into the FI and FD groups, we used a grouping approach to recognize GEFT performances at the extreme ends of the accuracy scale. The strategy classifies participants with a GEFT score more than or equal to mean + standard deviation in the FI group and participants whose GEFT score was less than or equal to mean − standard deviation as the FD group (n.b., Cohen's d effect size was found to be huge [d = 10.10] for this group classification) (Sawilowsky, 2009). This methodology to classify the participants into different performance groups is in accordance with the well-established neuropsychological norms (Heaton, 2004). As an additional analysis, we used a different grouping approach where we split the participants in two groups based on the median GEFT score (see Supplementary Data for details).
MRI protocols
Brain's anatomical and functional imaging data were acquired through a 3-Tesla MRI system (Magnetom Skyra, Siemens, Germany) using a 20-channel head and neck coil. The participant's head was kept minimally mobilized throughout imaging with soft foam cushioning around the head; this also reduced gradient coil-driven noise inside the gantry. T1-weighted anatomical brain volumes were acquired using a 3D magnetization prepared rapid gradient echo (MPRAGE) sequence (160 contiguous images with 0.9-mm-thick sagittal slices; repetition time [TR] = 1900 msec; echo time [TE] = 2.49 msec; flip angle = 9°; field of view [FOV] = 225 × 240 mm; voxel size = 0.9 × 0.9 × 0.9 mm; acquisition matrix = 256 × 240). Echo planar T2*-weighted sequence using blood oxygen level dependent (BOLD) signal was used to obtain functional brain volumes during the CD task.
The single session of echo-planar fMRI protocol acquires 177 brain volumes. Each brain volume comprised 36 interleaved ascending order 2, 4, 6,… 1, 3, 5,… slices, with slice thickness = 3 mm parallel to the Anterior Commissure − Posterior Commissure (AC − PC) axis (TR = 3000 msec; TE = 36 msec; acquisition matrix = 64 × 64; voxel size = 3.28 × 3.28 × 3 mm; flip angle = 90°; FOV = 210 mm).
CD task
An fMRI paradigm was adapted from Rajagopalan et al. (2015) to measure an individual's neural activation while performing a CD task. The paradigm consisted of two conditions: baseline and CD phases (active phase). The baseline condition consisted of a noncamouflaged image in which a visible object easily distinguishable from the background was present (Fig. 2A). In the active condition, the participant's task was to detect a camouflaged object hidden in a complex and perplexing background in the presented image (Fig. 2B). The hidden object in our paradigm was a human, an insect, or an animal. The participant indicated the presence of the noncamouflaged (baseline phase)/camouflaged (CD phase) object by pressing the left/right thumb button of the response device, corresponding to the left/right visual field in which the object was present.

The paradigm included seven CD blocks and eight baseline blocks with alternating phases of CD and baseline (Fig. 2C). Each CD block had six trials (images) of the CD task; one CD trial duration was 7000 msec. Each baseline block also consists of six trials; one baseline trial duration was 4000 msec. A white image with a 500 msec duration was interspersed between all 90 trials (42 CD trials and 48 baseline trials. The paradigm duration was 531 sec (8 min 51 sec), during which 177 fMRI volumes were acquired. The functional MRI hardware setup obtained from Nordic Neurolab was used to present stimuli and log the responses.
fMRI data analysis
A MATLAB-based toolbox, DPARSF [
All functional volumes were normalized using these spatial normalization parameters; anatomical images were also registered to the Montreal Neurological Institute (MNI) space. The next step was to smooth the normalized volumes using a 6-mm FWHM (full width at half maximum) Gaussian kernel. Low-frequency signal drift was eliminated by utilizing a high-pass filter with a cutoff period of 128 sec (0.0078 Hz).
The preprocessed data were then entered into a general linear model (GLM) analysis to determine whole-brain significant activations for CD versus baseline contrast, using 24 motion regressors (6 base motion parameters, 6 temporal derivatives of the base motion parameters, 6 squared terms of 6 base motion parameters, and 6 squared terms of temporal derivatives of 6 base motion parameters) (Friston et al., 1996). A group analysis using one-sample t-test was conducted for CD versus baseline contrast for both FD and FI groups separately and taking all the participants together (combined sample) (p
FDR corrected <0.05, cluster level). A two-sample t-test-based group analysis was also conducted to find the brain regional activation differences between the two groups (p
FDR corrected <0.05, cluster level). The anatomical regions corresponding to activated clusters were labeled using the Harvard Oxford cortical and subcortical structural Atlas (
ROI selection and creation
For the exploratory FC analysis, the MNI coordinates of the peak intensities of 22 activation clusters, obtained using a one-sample t-test, were chosen as the center of ROIs. A total of 22 spherical ROIs with an 8 mm radius were created using MarsBar (Brett et al., 2002). Along with the 22 spherical ROIs, 132 Harvard-Oxford cortical-subcortical brain atlas ROIs, and 32 brain network ROIs, as provided with the CONN toolbox (Whitfield-Gabrieli et al., 2012), were also used to study brain FC differences between FD and FI groups.
ROI-to-ROI functional connectivity analysis
The preprocessed brain volumes for each subject were imported into the CONN toolbox (Whitfield-Gabrieli et al., 2012). The gender and age of the participants were added as covariates to remove their effects on the obtained FC differences. Two FC analyses were performed. We first tried to determine if there are FCs to the critical activation regions (22 spherical ROIs given by the above GLM analyses) that serve as mediators of task performance during CD task in the FI group compared with the FD group. To accomplish this, we focused on the whole-brain FCs of the 22 seed ROIs to the 132 Harvard-Oxford brain atlas ROIs covering the entire brain. Next, we sought to identify FC differences between intrinsic brain networks (32 networks' ROIs) during task performance. This analysis resulted in a 32 × 32 FC matrix.
Results
Demographic results
Forty-eight (48) participants were recruited for the study whose neuroimaging data were acquired. Two data sets were discarded due to poor image quality. The remaining 46 participants (mean age = 22.33, age standard deviation = 1.90; male = 23, female = 23) were considered for subsequent analysis.
To study neural correlates of GEFT performance on the two extremes of the accuracy continuum, only those participants' neuroimaging data were used who showed extremely good/poor performance in GEFT. Participants whose GEFT score was higher than or equal to mean + standard deviation (mean GEFT = 10.17, GEFT standard deviation = 4.01) were classified as FI (GEFT ≥14; n = 13), whereas participants whose GEFT score was lower than or equal to mean − standard deviation were classified as FD (GEFT ≤6; n = 10). A total of 23 participants (mean age = 22.09, age standard deviation = 1.88; male = 12, female = 11) were analyzed to get inferences about functional activation and FC-based differences between FI versus FD group contrast (Table 1).
Descriptive Statistics for Demographic and Neuropsychological Data
FD, field dependence; FI, field independence; GEFT, Group Embedded Figures Test.
Relation between GEFT scores and performance of CD task
In addition to the participants' task performance inside the scanner, their offline responses were also taken immediately after completing the task-fMRI study. Participants were asked to recognize the camouflaged object with a stencil for all the images of the CD task as presented during fMRI data acquisition. A correlation study was conducted between participants' GEFT scores and CD accuracy (both inside the scanner and offline responses) to observe any relation between these variables. The performance scores inside and outside the scanner positively correlated with each other (r = 0.303; p = 0.041).
For the entire sample (N = 46), a positive correlation was obtained between the GEFT scores and the offline CD accuracy (r = 0.36; p = 0.013); however, no correlation was obtained between the GEFT scores and the task performance inside the scanner (r = 0.114; p = 0.450). It may have resulted from the fact that inside the scanner the participant was instructed to indicate the presence of the camouflaged object by pressing the left/right thumb button of the response device, corresponding to the left/right visual field in which the object was present. However, outside the scanner, the participant had to exactly point out the camouflaged object, and therefore, the reliability of offline performance scores is more than the scores inside the scanner. Furthermore, the FI group had an increased offline performance accuracy (n = 13; accuracy = 32.08 ± 3.23) than the FD group (n = 10; accuracy = 28.6 ± 5.68) with a marginal significance (p = 0.07) for 42 CD trials. The performance inside the scanner, however, did not differ significantly between the two groups (FI: 28.7 ± 4.29, FD: 26.6 ± 5.04).
GLM analysis of CD task activation and voxel-wise group comparison
Before assessing the group differences, we performed a one-sample t-test on all 46 participants to understand the neural correlates of CD in healthy participants (Table 2; Fig. 3). This analysis identified 22 brain areas as “regions of interest (ROIs)” for subsequent FC analysis between different groups. The activation was obtained primarily in the occipital pole (bilaterally), left insular cortex, right frontal-orbital cortex, anterior cingulate gyrus, paracingulate gyrus, vermis 9 of the cerebellum, right superior parietal lobule, precentral gyrus (bilaterally), right superior frontal gyrus, frontal pole (bilaterally), and right middle frontal gyrus.

Regional Activation Associated with Camouflage Detection Versus Baseline Contrast as Obtained Through One-Sample t-Test in All Participants
p FDR-corrected t-statistic <0.05, cluster level.
MNI, Montreal Neurological Institute.
Analyzing the groups separately for CD versus baseline contrast, the FI group showed activation in the occipital pole (bilaterally), left lingual gyrus, and the left paracingulate gyrus (Table 3; Fig. 4A). The FD group showed significant activation clusters predominantly in the occipital pole (bilaterally), cerebellum regions, and left superior lateral occipital cortex (Table 4; Fig. 4B). However, the voxel-wise direct comparison of the two groups using a two-sample t-test showed no significant differences after multiple comparison correction (family-wise error [p FWE < 0.05]).

Regional activation associated with CD versus baseline contrast in
Voxel-Wise Group-Level Comparisons for Camouflage Detection Versus Baseline Contrast in the Field-Independent Group
p FDR-corrected t-statistic <0.05, cluster level.
Voxel-Wise Group-Level Comparisons for Camouflage Detection Versus Baseline Contrast in the Field-Dependent Group
p FDR-corrected t-statistic <0.05, cluster level.
Differences in FC
The voxel-wise neuroimaging analysis failed to capture any group (FI vs. FD) differences at stringent standard levels of statistical testing. We, therefore, sought to determine if the group differences exist for the FC between the key areas that serve to perform the CD task (Research Question 2). To accomplish this, we utilized ROI to ROI FC analysis, focusing on the connectivity between the 22 seed regions as obtained in the GLM analyses (for the CD task vs. baseline contrast on the combined sample) and the 132 Harvard-Oxford atlas-based target ROIs covering the entire brain. The FI group showed an increased positive FC between the left anterior cingulate cortex and left anterior middle temporal gyrus (aMTG) and between the left paracingulate gyrus and the left temporal pole (TP) compared with the FD group.
On the contrary, left vermis 9 region showed a negative FC with the right hippocampus and increased positive FC with the left anterior and left posterior middle temporal gyrus (pMTG) in the FI group compared with the FD group (Table 5 and Fig. 5).
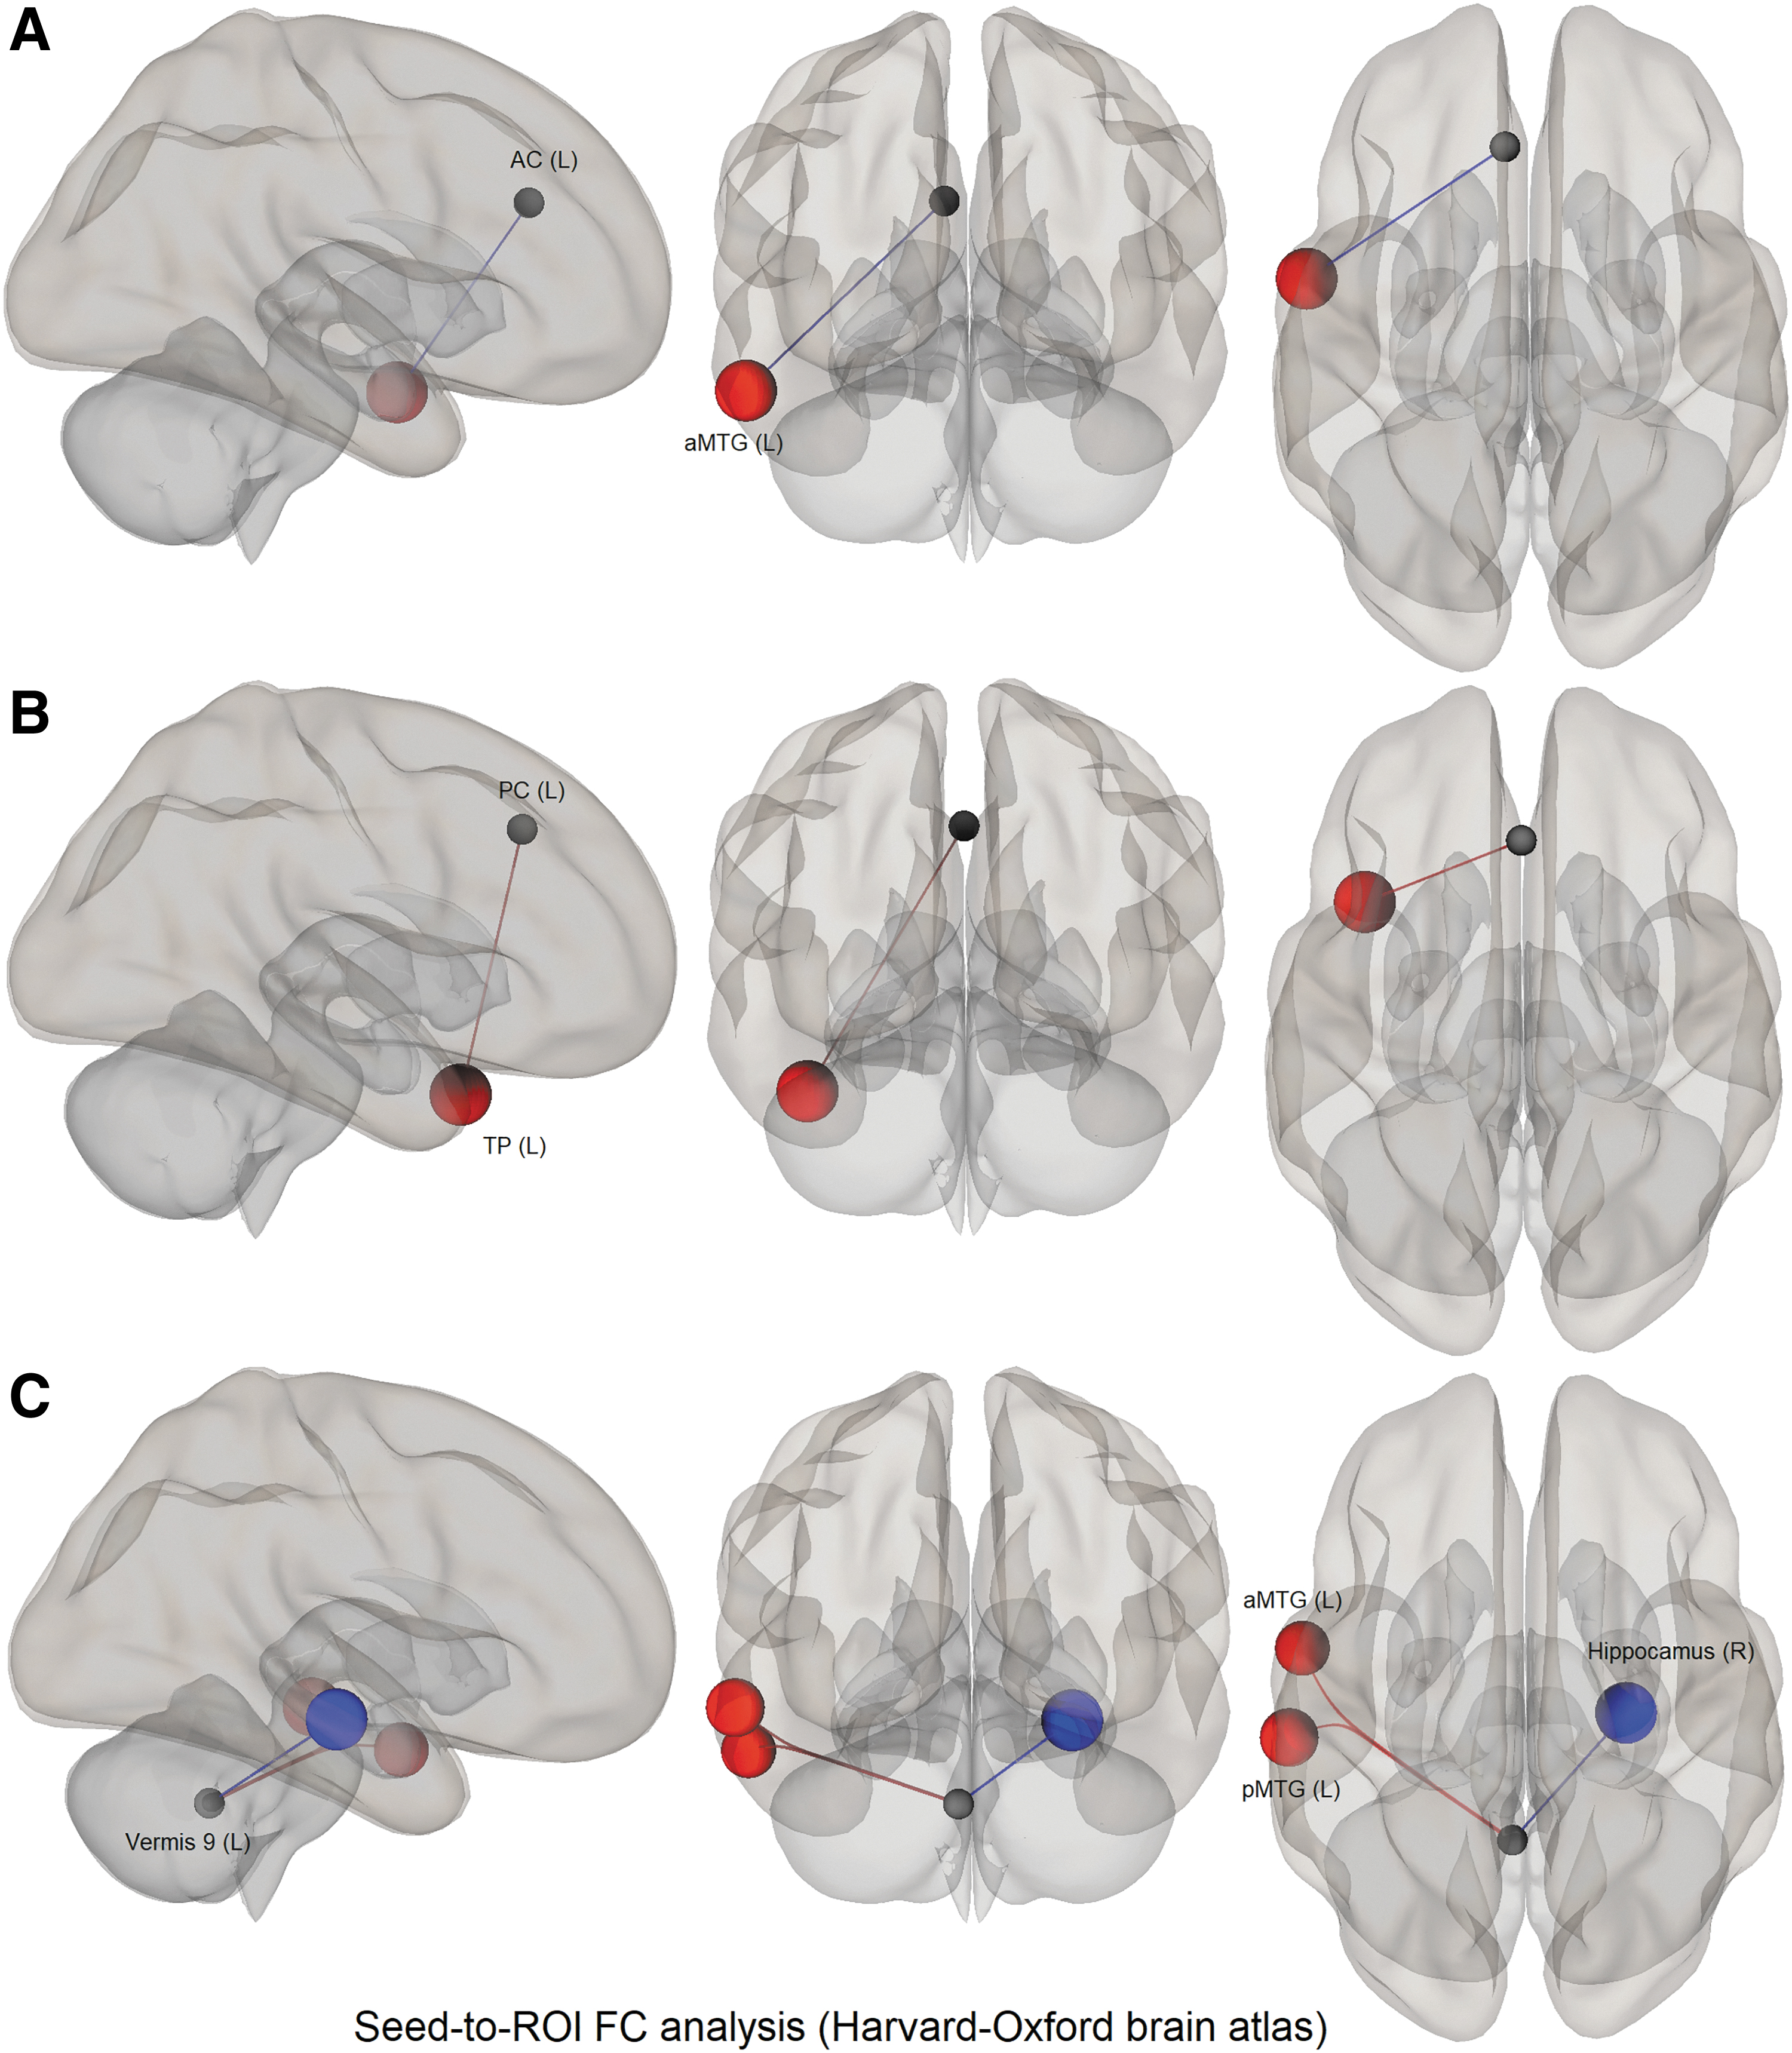
Seed (22 Regions of Interest Obtained from the Entire Sample)-to-Target (132 Harvard-Oxford Atlas Regions of Interest) Functional Connectivity in the Field-Independent Group Compared with the Field-Dependent Group During the Camouflage Detection Task
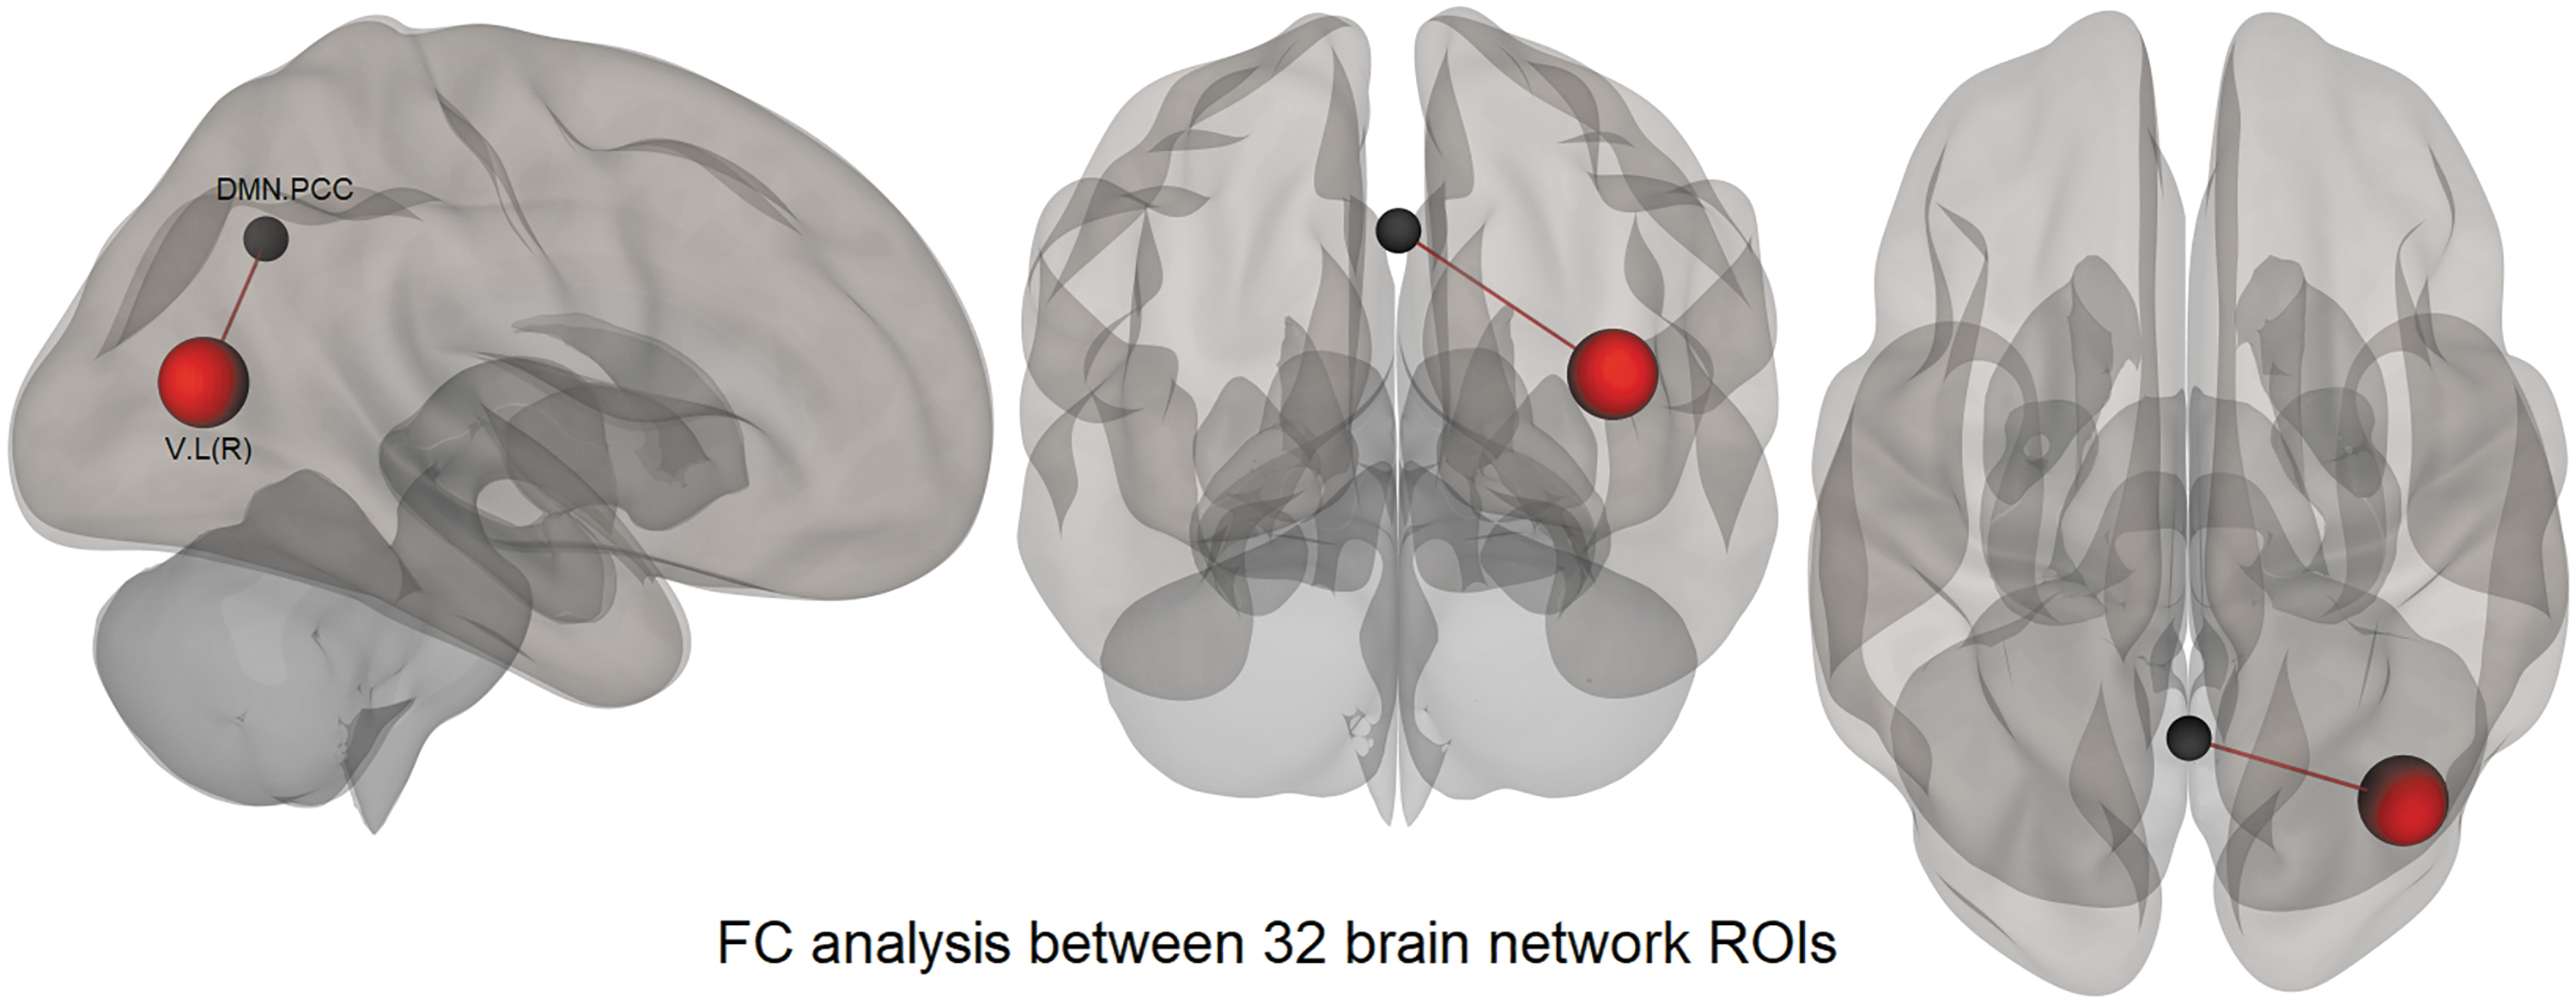
To further understand the differential mechanisms that could be at play during task performance in different groups, we assessed the FC between the known functional brain networks in the studied groups of participants (Research Question 3). Different participants might allocate differential attentional and working memory resources toward the perceptual task at hand, over and above the visual network, for successful task performance based on their visuoperceptual abilities. We assessed the FC between the experimental groups between the 32 intrinsic brain network ROIs available within CONN. The FI group showed increased FC between the posterior cingulate cortex (PCC) of the DMN and the right lateral visual network region compared with the FD group (Table 6 and Fig. 6).
Increased Network-to-Network Region of Interest Connectivity in the Field-Independent Group Compared with the Field-Dependent Group During the Camouflage Detection Task
Discussion
We utilized brain regional activation and FC to demonstrate the underlying neural mechanisms involved in a CD task in healthy participants. An analysis was conducted using the entire sample of participants to obtain the neural correlates of CD. The activation was obtained primarily in the occipital and frontal regions along with the left insular cortex, anterior cingulate gyrus, right superior parietal lobule, and vermis 9 of the cerebellum (Table 2). The primary visual cortex is responsible for visual information processing. It provides the functionality of edge detection (Thorpe et al., 1996), color perception (Zeki, 1990), and figure-background segregation (Lamme, 1995), which is crucial for CD.
The frontal pole has been found to be connected to the higher order sensory association cortex (Orr et al., 2015). It was shown that the orbital frontal pole and ventral medial pole coactivate with the lateral occipital cortex, and the ventral orbital frontal pole coactivates with the fusiform cortex and extrastriate cortex. The frontal cortex integrates different brain regions and has also been implicated in perceptual decision-making processing of higher order cognitive functions such as judgment and reasoning (Rahnev et al., 2016; Rajagopalan et al., 2015), with the middle frontal gyrus being implicated in encoding color in a categorical manner (Bird et al., 2014). Top-down projections of the orbitofrontal cortex to the primary visual cortex play a critical role in sensory-guided behavior, sensory processing, and visual associative learning (Liu et al., 2020).
Similarly, the anterior insula is known to be one of the salience network's core hubs that recognize the most relevant salient stimuli and propagate them to higher cognitive regions, thereby affecting behavior. The superior parietal lobule has been widely implicated in visuospatial and attentional processing and has also been found to have a role in manipulating information in working memory and spatial shifting (Koenigs et al., 2009; Vandenberghe and Gillebert, 2013). The dorsal stream has its projections from the visual cortex to the posterior parietal cortex and is involved in shape perception and the visual space analysis (Goodale and Milner, 1992; Rajagopalan et al., 2015).
Having identified the primary brain regions activated during the CD task, we carefully linked our fMRI analyses to the baseline cognitive style of an individual—FI/FD. We investigated the differential neural recruitment by participants of different cognitive styles involved using a stringent grouping criterion that separated participants based on their GEFT performance levels at the two extremes of the scores.
A few differential neural activation features for task performance were obtained in the two groups. Both groups activated the occipital pole in the primary visual cortex but with a more extensive cluster of activation in the FI group than the FD group (Tables 3 and 4). The heightened use of the primary visual cortex might be responsible for better task performance in the FI group. FI participants also activated the paracingulate gyrus, a region that contributes to visual attention regulation (Gennari et al., 2018). On the contrary, in addition to the primary visual cortex, the FD group was shown to activate the regions of the cerebellum that has been shown to be associated with visuospatial information (Van Es et al., 2019) and superior division of the lateral occipital cortex that plays a role in object recognition (Karten et al., 2013) (Table 4).
Thus, FD versus FI comparison highlighted the differential neural activation depending on the extent of FD/I of the participants. However, the distinction could not emerge quantitatively on direct comparison of the groups. It is probably because the differential activation magnitude of the brain regions was not sufficient enough to be captured in the GLM. It has been shown that the ROI approach can increase the statistical power of the test; therefore, to more precisely identify the brain features associated with a visuospatial task (such as CD) performance by participants with different cognitive styles, we conducted two exploratory FC analyses for the two groups, FD versus FI: (1) ROI to ROI FC analysis, between the 22 key regions present in our brain activation intensity and the 132 brain ROIs and (2) ROI to ROI FC analysis between the 32 brain network ROIs (see the Materials and Methods section for further details).
Significant FCs reflect the brain region's synchronized and correlated activity, suggesting their role as an intermediary behind above-par task performance, even without activation intensity being statistically significant enough to appear in our GLM findings.
The FC analysis between key regions to whole-brain ROIs (FC analysis-1 above) revealed that the FI group had reliable FC increases between the key regions, such as the paracingulate gyrus and anterior cingulate cortex with the left temporal regions such as the middle temporal gyrus and TP, respectively. The left vermis 9 region also showed increased FC with the pMTG and aMTG. The middle temporal gyrus is a part of the ventral or “what pathway” of the visual processing stream that is implicated in the identification of objects by processing their intrinsic visual properties (shape and color), conscious perception, along with the processing and storage of long-term object memory (Khan et al., 2011).
A recent review article has highlighted the role of the TP, as a higher order visual brain region implicated in complex visual tasks, with a preferential activation in complex figure analysis (Herlin et al., 2021). The authors concluded that the TP shows a predominance for visual recognition in humans. The regions showing increased task-related functional coupling (anterior cingulate cortex/middle temporal gyrus/TP/paracingulate gyrus) fall primarily within the DMN as defined by Yeo et al. (2011) and are the “hubs” that combine various elements of cognition as well as involved in memory processing (Tracy et al., 2021; Zhang et al., 2019).
Similarly, vermis 9 has been shown to have a role in ocular motor control (Kheradmand and Zee, 2011). These increased FCs indicate the broader regional communications involved in CD in the FI participants over and above the FD participants. However, there was a negative FC between the vermis 9 and right hippocampus in the FI group compared with the FD group (Table 5).
Similarly, the second (2) FC analysis between 32 brain network ROIs showed an increased FC between the right lateral visual ROI and the PCC of the DMN in the FI compared with FD group (Table 6). This result again points out that the visual region in the FI group is highly communicative with the regions (such as the posterior cingulate of the DMN) that belong to intrinsic functional networks closely linked to memory encoding mechanisms (Tracy et al., 2021).
The increased FC in FI groups compared with the FD groups is seen as enhanced communication that substantiates CD. This is essential to remember that most of these regions exhibiting task-driven FCs were not activated brain regions in the CD task. The FC data thus point toward computational support to task performance by task-driven increment in connectivity between regions reflecting the recruitment of cognitive functions that facilitate superior performance on a visuospatial task, such as CD by the participants who reflect a field-independent cognitive style. We suggest that these increased FCs provide additional cognitive resources dedicated to attention, working memory, and higher level visual processing.
The human brain works collectively as a squad of effective specific brain regions to detect targets while in the presence of a distracting background (Wolfe et al., 2002). CD is such a task that requires a higher level of visual processing, which includes the detection of hidden objects using visual closure ability; the task also requires visual search accompanied by a mental rotation task that requires participants to look for the orientation of object features such as edges and patterns. The distinction between the target object and background is termed a “border ownership issue” in target detection literature. It is a prominent issue in CD since the edges of an object generally merge with the background, leading to diminished visual separability (Lamme, 1995).
The efficient use of brain regions involved in color perception, attention, and working memory provides FI participants an edge in the accurate and fast detection of camouflaged objects. Effective coordination between brain regions with such high-level visual processing abilities empowers a field-independent individual's brain to parallel process CD task requirements (Boot et al., 2009). In summary, the present study provides evidence of enhanced communication between regions subserving the cognitive traits required for visual search during CD by field-independent participants (FI group), advancing our understanding of the cognitive styles of FD/I and visual search.
However, certain limitations in the current study require consideration, such as the small sample size, especially when the extreme performance grouping (based on GEFT scores) was considered, reducing the power and increasing the chance of type II error. Second, understanding the mechanism by which the field-independent population executes a CD task is incomplete without studying the associated white matter connectivity implementing information processing between many brain areas. White matter connectivity is likely an essential support system behind brain plasticity that ensures learning and task performance, which has not been accounted for here.
Conclusion
The present study shows that there is not a specific brain region but an interaction between certain brain regions such as TP, aMTG/pMTG, and vermis that creates the underlying framework for a field-independent individual to perform well in visuoperceptual tasks such as CD. However, considering the exploratory nature of the analysis, the results should be interpreted with caution.
Footnotes
Acknowledgments
We thank our volunteers who participated in the study. Special thanks also to Mr. Pawan Kumar for his help in data acquisition.
Authors' Contributions
S.M. and S.A. devised the experiments. M.S. and S.K. did the neuropsychological assessment of participants. P.K. acquired the neuroimaging data. D.S. conducted the experiments, analyzed the results, and wrote the article. S.M., G.B., and M.D. mentored throughout the research study, and all authors reviewed the interim drafts and finalized the article.
Author Disclosure Statement
D.S. received a research fellowship from the Defense Research and Development Organization for the research work presented in the article.
Funding Information
This work was supported and funded by the DRDO (Ministry of Defense) under project no. DIPR-S&T-734.
Supplementary Material
Supplementary Data
References
Supplementary Material
Please find the following supplemental material available below.
For Open Access articles published under a Creative Commons License, all supplemental material carries the same license as the article it is associated with.
For non-Open Access articles published, all supplemental material carries a non-exclusive license, and permission requests for re-use of supplemental material or any part of supplemental material shall be sent directly to the copyright owner as specified in the copyright notice associated with the article.