
Abstract
Background:
Properties of functional connectivity (FC), such as network integration and segregation, are shown to be associated with various human behaviors. For example, Godwin et al. and Sun et al. found increased integration with attention allocation, whereas Cohen and D'Esposito and Shine et al. observed increased segregation with simple motor tasks. The current study investigated how viewing video clips with different valence and arousal influenced integration–segregation properties in task-based FC networks.
Methods:
We analyzed an open dataset collected by Kim et al. We performed a generalized psychophysiological interaction (gPPI) analysis paired with network analysis and community detection to investigate changes in brain network dynamics when people watched four types of videos that differed by affective valence (unpleasant or pleasant) and arousal (arousing or calm).
Results:
Results showed that unpleasant arousing videos produced greater FC deviation from the baseline (task-induced FC deviation [tiFCd]) and perturbed the brain into a more segregated state than other kinds of video. Increased segregation was only observed in association systems, not sensorimotor systems.
Discussion:
Unpleasant arousing content perturbed the brain to a functionally distinct state from the other three types of affective videos. We suggest that the change in brain state was related to people disengaging from the unpleasant arousing content or, alternatively, staying alert while exposed to unpleasant arousing stimuli. The study also added to our understanding of how combining task-based gPPI analysis with community detection methods and network segregation measures can advance our knowledge of the links between behavior and brain state changes.
Impact statement
Network integration and segregation is an important property of the human brain. We address the question of how affective stimuli influence brain dynamics from a functional connectivity (FC) network integration–segregation perspective. By conducting a whole-brain generalized psychophysiological interaction (gPPI) analysis paired with community detection methods, we found that highly aversive video content induced significant FC changes and perturbed the brain to a more segregated state.
Introduction
Neural mechanisms of human emotion have been studied for decades (Lindquist and Barrett, 2012; Horikawa et al., 2020). Earlier studies looked for specific brain structures associated with affective processing (Aharon et al., 2001; Kringelbach et al., 2003; LeDoux, 2007; O'Doherty, 2004; Wilson-Mendenhall et al., 2013), whereas a more recent view suggests that the brain processes emotion in a more distributed manner (Hamann, 2012; Horikawa et al., 2020; Wager et al., 2015). For example, using multivariate pattern analysis (MVPA), a few research teams have shown that voxels containing important information about affective states are distributed widely across the brain (Baucom et al., 2012; Kragel and LaBar, 2015; Saarimäki et al., 2016). Related to this distributed view is advocacy for studying emotion from a network neuroscience perspective (Pessoa, 2017).
Nonetheless, although a small number of recent studies have shown that whole-brain functional connectivity (FC) patterns could be indicative of people's affective states (Saarimäki et al., 2022; Xu et al., 2023), our understanding of affective processing from a whole-brain-network perspective is still very limited. To advance our knowledge of emotion and whole-brain networks, we conducted an FC analysis on an open-source functional magnetic resonance imaging (fMRI) dataset acquired while subjects watched affective videos that varied along the dimensions of valence and arousal (Kim et al., 2016). We used a relatively novel approach by pairing a generalized psychophysiological interaction (gPPI) model (Gerchen et al., 2014; McLaren et al., 2012) with community detection methods (Bassett et al., 2011; Mucha et al., 2010) to analyze network integration and segregation related to exposure to affective media content.
FC networks in the human brain consist of specialized communities, and it has been suggested that the connection strength within and between communities fluctuates over time to support different behaviors (Shine et al., 2016). When FC between communities is strengthened, the brain shifts to a more integrated state. Conversely, when local connections within communities are strengthened and between-community connections are weakened, the brain shifts to a more segregated state (Deco et al., 2015). The integration–segregation of FC networks has previously been associated with various human behaviors. For example, Godwin et al. (2015) and Sun et al. (2020) found increased integration with attention allocation, whereas Cohen and D'Esposito (2016) and Shine et al. (2016) observed increased segregation with simple motor tasks. However, how affective stimuli (and in particular their valence and arousal) influence the integration–segregation property of FC networks has not been studied. The current study aims to address this question.
Given that increased integration has been linked to attention allocation in previous studies (Cohen and D'Esposito, 2016; Godwin et al., 2015; Shine et al., 2016; Sun et al., 2020), and people tend to allocate more attentional resources to negative stimuli (Bradley and Lang, 2000; Lang, 1995; Lu et al., 2017; Smith et al., 2006), we hypothesize that FC networks will be more integrated when people watch unpleasant videos than pleasant ones. This propensity for people to pay more attention and respond more strongly to aversive stimuli is called the negativity bias, which is thought to have an evolutionary advantage as it helps us quickly identify danger and avoid harm (Cacioppo and Gardner, 1999).
However, it is also well known that the influence of negativity on information processing has an inverted U shape such that moderately unpleasant stimuli capture the most attention compared with slightly or highly unpleasant stimuli. In addition, it is also known that extremely aversive stimuli can actually inhibit information processing (Clayton et al., 2019; Lang, 2006; Leshner et al., 2018; Leshner et al., 2011). Thus, considering this perspective, although our primary hypothesis is that aversive media will lead to more integration of FC networks, it is also possible that arousing unpleasant videos will produce the opposite effect, namely the FC networks will be more segregated (less integrated), because people may resist allocating attentional resources to overly aversive content.
In sum, the current study aims to examine how the brain responds to affective media content from an FC network integration–segregation perspective. We answer this question by analyzing an open-source dataset collected by Kim et al. (2016) and conduct a gPPI analysis coupled with network community detection (Godwin et al., 2015; Vinci-Booher et al., 2016). Unlike most other task-based FC analysis methods, a gPPI analysis controls for the edge-based background FC pattern that is epitomized in resting-state functional connectivity (rsFC) as well as the node-based task-induced effects fitted with standard mass univariate models. Thus, gPPI enables direct visualization and testing of FC changes caused by experimental manipulation of behavior. Our results showed that neither valence nor arousal alone significantly altered FC network integration–segregation at the whole-brain level. However, when examining the combined effects of negativity and arousal, we found that unpleasant arousing videos induced significant FC deviation and perturbed the brain to a more segregated state compared with other types of affective video.
Methods
Data description
This study used an open dataset collected by Kim et al. (2016) available from OpenNEURO (Accession No. ds000205). The dataset contained 11 subjects' fMRI data while they watched naturalistic audiovisual clips from 4 categories: pleasant calm, pleasant arousing, unpleasant calm, and unpleasant arousing. Each video was presented for 5 sec, followed by a 7-sec fixation. Pleasant calm videos included content such as birds singing and baby cooing, pleasant arousing content included crowd cheering and rollercoaster, unpleasant calm included coughing and snoring, and unpleasant arousing included men fighting and riot. The full list of video content is available in table S1 in Kim et al. (2016). As reported in the study by Kim et al. (2016), a separate group of subjects (N = 49) rated all video clips in terms of valence and arousal. This procedure validated that the selected content could be distributed into the four affective categories. fMRI data acquisition details and Institutional Review Board statement can be found in the study by Kim et al. (2016).
fMRI data preprocessing
We preprocessed the fMRI data using fMRIPrep with the following steps (Esteban et al., 2019). First, a reference volume and its skull-stripped version were generated using a custom methodology of fMRIPrep. Susceptibility distortion correction (SDC) was omitted. The blood oxygen-level dependent (BOLD) reference was then co-registered to the T1w reference using bbregister (FreeSurfer), which implements boundary-based registration (Greve and Fischl, 2009). Co-registration was configured with six degrees of freedom. Head motion parameters with respect to the BOLD reference (transformation matrices, and six corresponding rotation and translation parameters) are estimated before any spatiotemporal filtering using mcflirt (FSL 5.0.9) (Jenkinson et al., 2002). BOLD runs were slice-time corrected using 3dTshift from AFNI 20160207 (Cox and Hyde, 1997, RRID:SCR_005927). The BOLD time series (including slice-timing correction when applied) were resampled onto their original native space by applying the transforms to correct for head motion.
These resampled BOLD time series will be referred to as preprocessed BOLD in original space or just preprocessed BOLD. The BOLD time series were resampled into standard space, generating a preprocessed BOLD run in MNI152NLin2009cAsym space. Several confounding time series were calculated based on the preprocessed BOLD: framewise displacement (FD), derivative of root mean square variance over voxels (DVARS), and three region-wise global signals. The FD was computed using two formulations following Power (absolute sum of relative motions; Power et al., 2014) and Jenkinson (relative root mean square displacement between affines; Jenkinson et al., 2002). FD and DVARS are calculated for each functional run, both using their implementations in Nipype (following the definitions by Power et al., 2014). The three global signals are extracted within the cerebrospinal fluid (CSF), the white matter (WM), and the whole-brain masks.
Task-based FC
We constructed task-based FC networks using whole-brain gPPI (Gerchen et al., 2014; McLaren et al., 2012). To do so, we extracted preprocessed BOLD time series from 264 nodes following Power et al.'s (2011) parcellation using the nilearn library in Python. When extracting BOLD time series from target nodes, the following confounding variables were included: three global signals, six head motion parameters, as well as their quadratic terms, temporal derivatives, and squared derivatives (Satterthwaite et al., 2013), as well as FD, root mean square deviation (RMSD), DVARS, and standardized DVARS. A spatial filter with 4 mm FWHM was applied. Similar to a recent whole-brain gPPI study (Tompson et al., 2020), we also applied a temporal filter of 0.01–0.1 Hz to remove very high or low fluctuations in BOLD time series.
In essence, a gPPI analysis is a generalized linear model (GLM) with a seed region's BOLD signal predicted by three types of regressors: physiological (PHY), psychological (PSY), and psychophysiological interaction (PPI) (Friston et al., 1997; O'Reilly et al., 2012). In the current study, the PHY regressors were z-scored BOLD time series extracted from 264 nodes using Power et al.'s (2011) parcellation. The PSY regressors were constructed by convolving four boxcar functions, which represented the presentation time of the four types of videos, with SPM 12's hemodynamical response function (HRF). We then followed Di et al.'s (2017) suggestion and demeaned the four PSY terms.
The PPI regressors were constructed using the following steps. We first deconvolved PHY terms from HRF using the SPM 12's deconvolution algorithm. These deconvolved signals were then multiplied elementwise with the PSY predictors (i.e., boxcar functions indicating time periods when the videos were displayed) and re-convolved with HRF to produce the PPI terms (Gerchen et al., 2014; McLaren et al., 2012). We then fitted the GLM using BOLD signals across all 264 nodes as the criterion variable and the PHY terms, PSY terms, and PPI terms as the predictor variables. In addition, several nuisance variables (three global signals and six base head motion time course) and two constant terms denoting the scan session were also included in the model.
Fitting the gPPI model produced three types of whole-brain matrices, consisting of the estimated beta weights of PHY terms, PSY terms, and PPI terms (Fig. 1). In these matrices, each row represents the node to be predicted (i.e., the criterion variable in the gPPI model), whereas each column represents the node on the predictor side of the model. It is noticeable that weights from the PHY predictor resembled a typical rsFC network. In fact, a gPPI model can be seen as a partial correlation between the PHY time series while controlling the effects of PSY and PPI predictors and other nuisance variables. For the PSY matrices, the beta weights varied across the node to be predicted (i.e., across rows) but had very little variability across nodes on the predictor side (i.e., across columns). The PSY predictors are derived from the task-based experimental design, and the beta weights in the PSY matrices reflect the pattern of nodal activation across the brain induced by the experimental protocol.
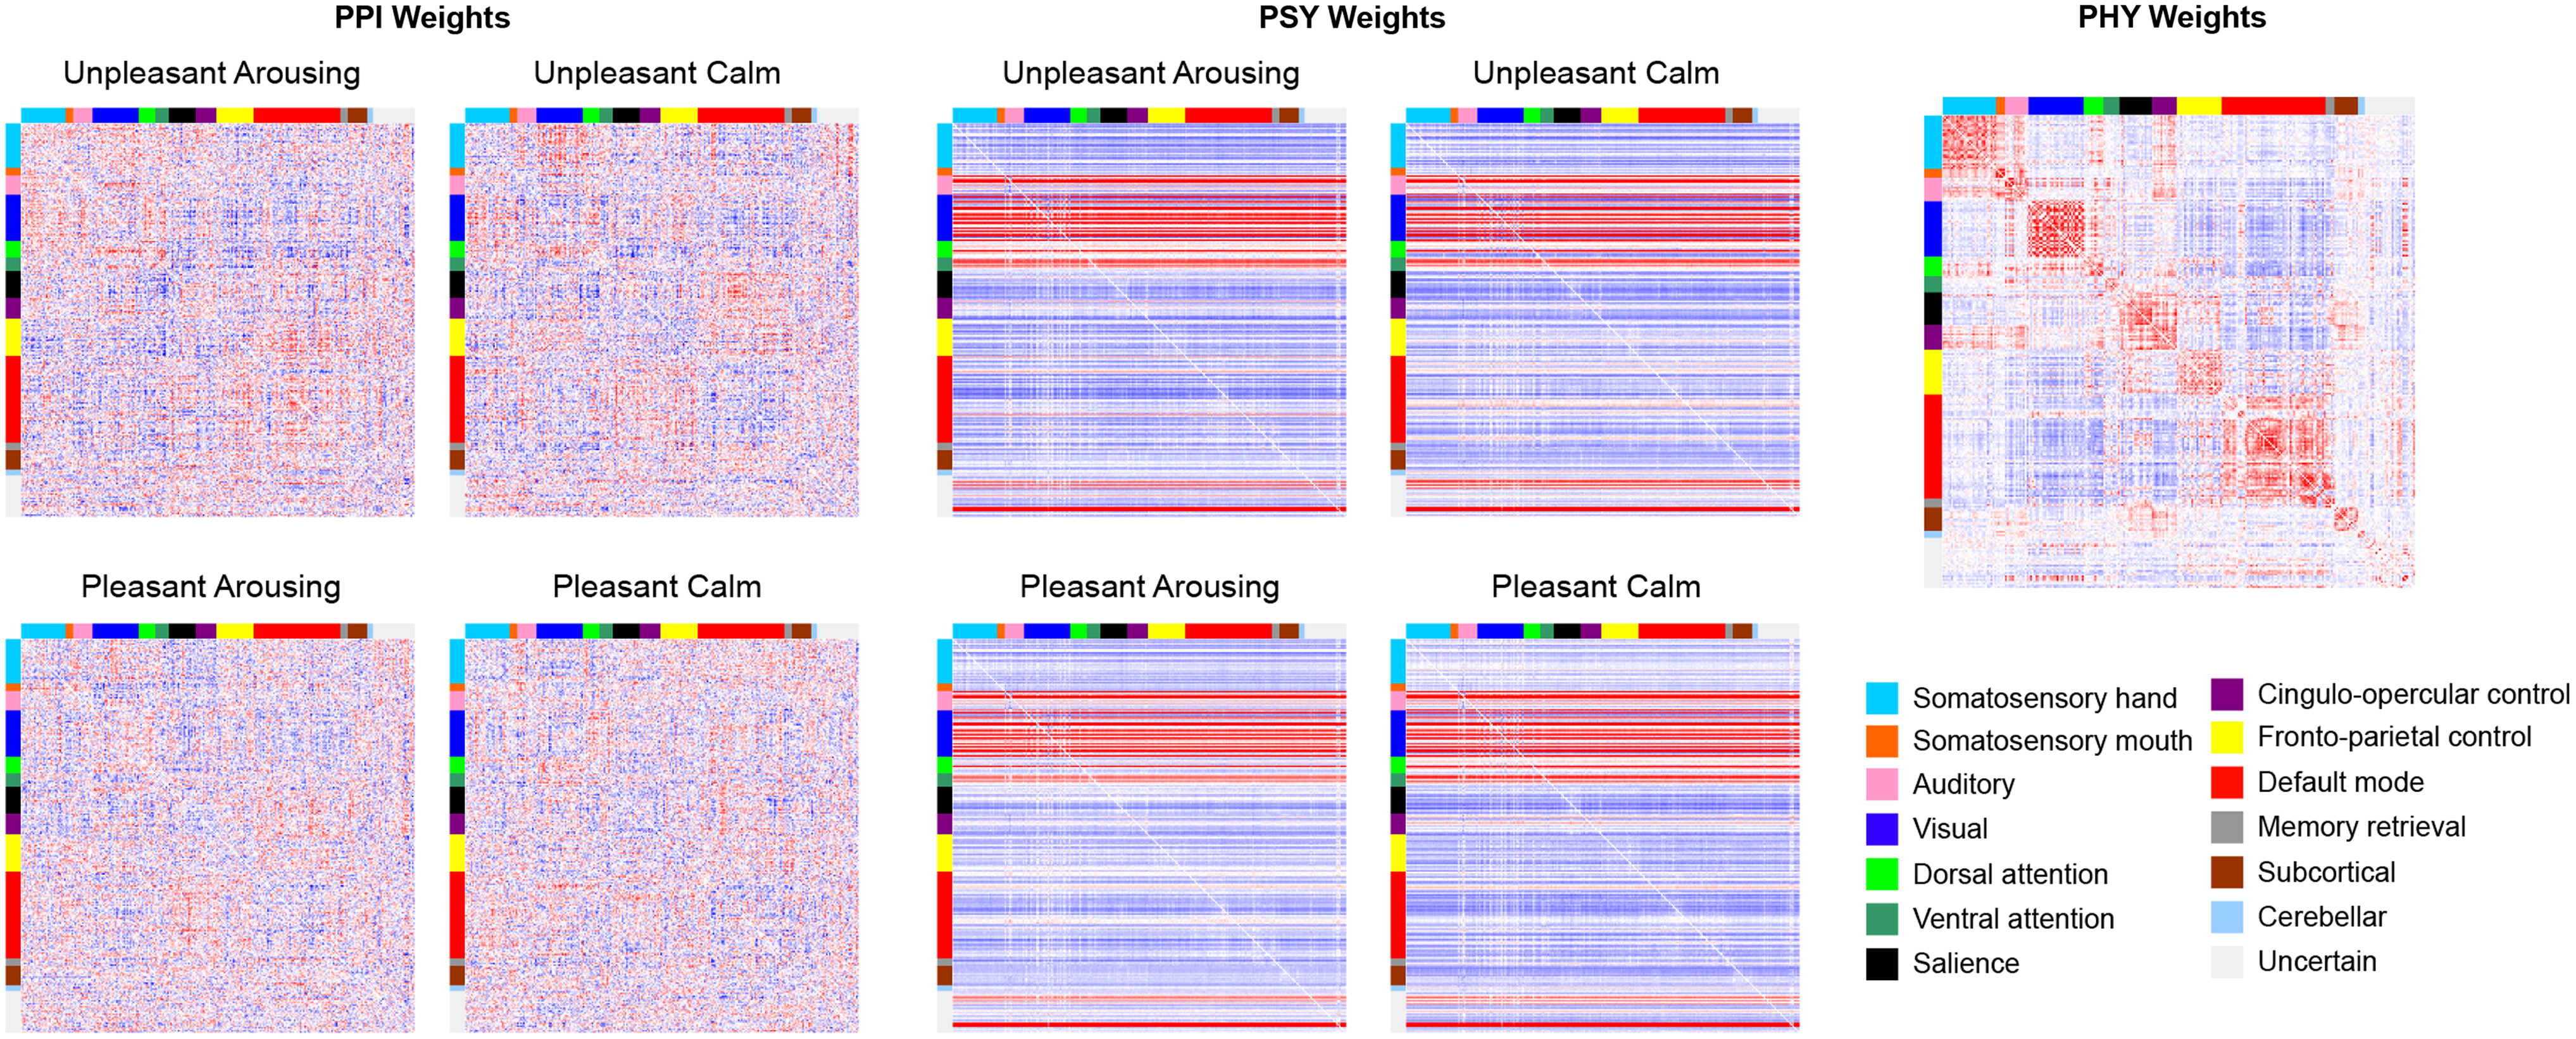
Network weights. PPI weight, PSY weight, and PHY weight matrices averaged across subjects. The nodes in the networks/matrices are ordered by Power et al.'s (2011) canonical communities and indicated by the color labels. PHY, physiological; PPI, psychophysiological interaction; PSY, psychological.
This nodal activation pattern has little to do with edge connections. If one considers the PSY variables as predictors and the other variables (PHY and PPI) as covariates, the PSY matrices are akin to a traditional mass univariate analysis. Finally, the PPI matrices are intended to capture any activation effects that cannot be explained by (or go above and beyond) the PHY and PSY matrices alone. In other words, if we superimpose the PSY matrices (i.e., nodal activation patterns) on the PHY matrices (i.e., rsFC backbone) to form a baseline, the PPI weights then reflect any task-induced FC deviations from this baseline (task-induced FC deviation [tiFCd]). Following this conceptualization, positive and negative PPI weights can be equally important as they represent meaningful task-induced FC increase and decrease from baseline, respectively. Thus, we did not impose any thresholds on the PPI matrices to exclude negative edge weights.
Community detection
Networks can exhibit mesoscale structure. That is, their elements can be meaningfully partitioned into subgraphs, typically called communities or modules. In general, the modular structure of a network is unknown a priori and must be detected using a data-driven procedure (Fortunato, 2010). One of the most popular community detection procedures is modularity maximization (Newman and Girvan, 2004). Briefly, modularity maximization works by comparing an observed network with what would be expected under some null model. Modules are graded based on their quality, which is assessed by the objective function, Q. A large number of algorithms have been proposed for optimizing Q outright, although the most popular is the greedy and stochastic “Louvain algorithm” (Blondel et al., 2008).
In the current study, the observed matrices are the PPI matrices constituted of the beta weights from the gPPI model. For the expected weights, we generated 1000 null datasets by permutating condition labels and reran gPPI to generate null PPI matrices (Tompson et al., 2020). The null PPI matrices within each condition were averaged to produce one null network per condition. The expected weights were the edge weights of the null networks, which can be scaled with a resolution parameter,
In most applications, modularity maximization is applied to individual matrices. However, to jointly detect communities across conditions and subjects, we used a multilayer analog of the traditional modularity maximization (Mucha et al., 2010). In this framework, individual networks—often representing the same network at different points in time (Bassett et al., 2011), networks of different connection modalities (Puxeddu et al., 2022), or networks of individual subjects (Betzel et al., 2019)—are modeled as layers that are linked together via interlayer connections. Modularity maximization, such as the Louvain algorithm, is carried out on these coupled layers and the strength of interlayer connections determines how similar the detected communities are across layers (Mucha et al., 2010). For the current study, we used both condition and subject as individual layers.
Each layer was a modularity matrix from one subject and one condition, and every layer was connected to every other layer. To obtain a group-level partition across subjects without averaging, and to generate a consensus partition across conditions, we set all interlayer connection strengths

Multilayer community detection.
Network properties
We computed within-community connectivity, between-community connectivity, and segregation score following Chan et al. (2014)'s conceptualization. Within-community connectivity was computed as the averaged PPI weights of edges connecting two nodes within the same module, whereas between-community connectivity was the averaged PPI weights of edges connecting two nodes from different modules. Subtracting between-community connectivity from within-community connectivity produced the segregation score. In addition, we conceptualize PPI weights as task-induced FC deviation from baseline (tiFCd). To summarize such FC deviation, we computed the mean and variance of PPI weights across conditions.
Statistical analyses
Each network metric contained 44 data points (11 subjects and 4 conditions). These data were submitted to a mixed-effect model with condition being the predictor and individual subjects as random intercept. In greater detail, the intercept term represented data in the unpleasant arousing condition (i.e., the reference group). The other three conditions (in the order of unpleasant calm, pleasant arousing, and pleasant calm) were represented using three binary coded variables. No random slopes were included because adding random slopes for conditions overparameterized the model and made the parameters “unidentifiable.” Three contrasts were set up to test the unpleasant conditions against the pleasant conditions (contrast of [1/2, 1/2, −1/2, −1/2]), the arousing conditions against the calm conditions (contrast of [1/2, −1/2, 1/2, −1/2]), and the unpleasant arousing condition against the other three conditions (contrast of [1, −1/3, −1/3, −1/3]).
Statistical significance was tested using a bootstrapping method. Specifically, for each network metric, we randomly resampled the observed data (44 data points) with replacement 5000 times and produced 5000 resampled datasets. We then ran the above-described mixed-effect model on these resampled datasets and generated distributions of bootstrapped contrast coefficients. With the three contrasts, we set family-wise error rate (FWER) to be 1.67% and constructed 98.33% confidence intervals (CIs) from the bootstrapped distributions. We then examined whether the CIs excluded zero for each network metric to decide statistical significance.
Results
Edge weights of gPPI matrices
We conceptualized edge weights of gPPI matrices as task-induced FC deviation from baseline (tiFCd) and showed their distributions in Figure 3. The mean and variance of gPPI edge weights were computed and compared across conditions. As shown in Figure 3, there were no significant effects of valence (

PPI weight distribution.
When assessing the variance of gPPI weights, we found that the unpleasant arousing condition induced a greater variance than the other three (
Community structure in gPPI networks
To further assess FC deviation induced by affective video stimuli, we studied the community structure of gPPI matrices. The multilayer community detection procedure produced a consensus nodal partition shown in Figure 4. Three primary communities were detected. The gray-colored community contained mostly default mode network (DMN) and subcortical nodes, as well as part of the frontoparietal task control and salience networks. The orange-colored community covered mostly somatomotor and auditory nodes, and some nodes in the default model and ventral attention network. The blue-colored community included mostly visual, dorsal attention, and cingulo-opercular control nodes, as well as some nodes in the frontoparietal control and salience networks.
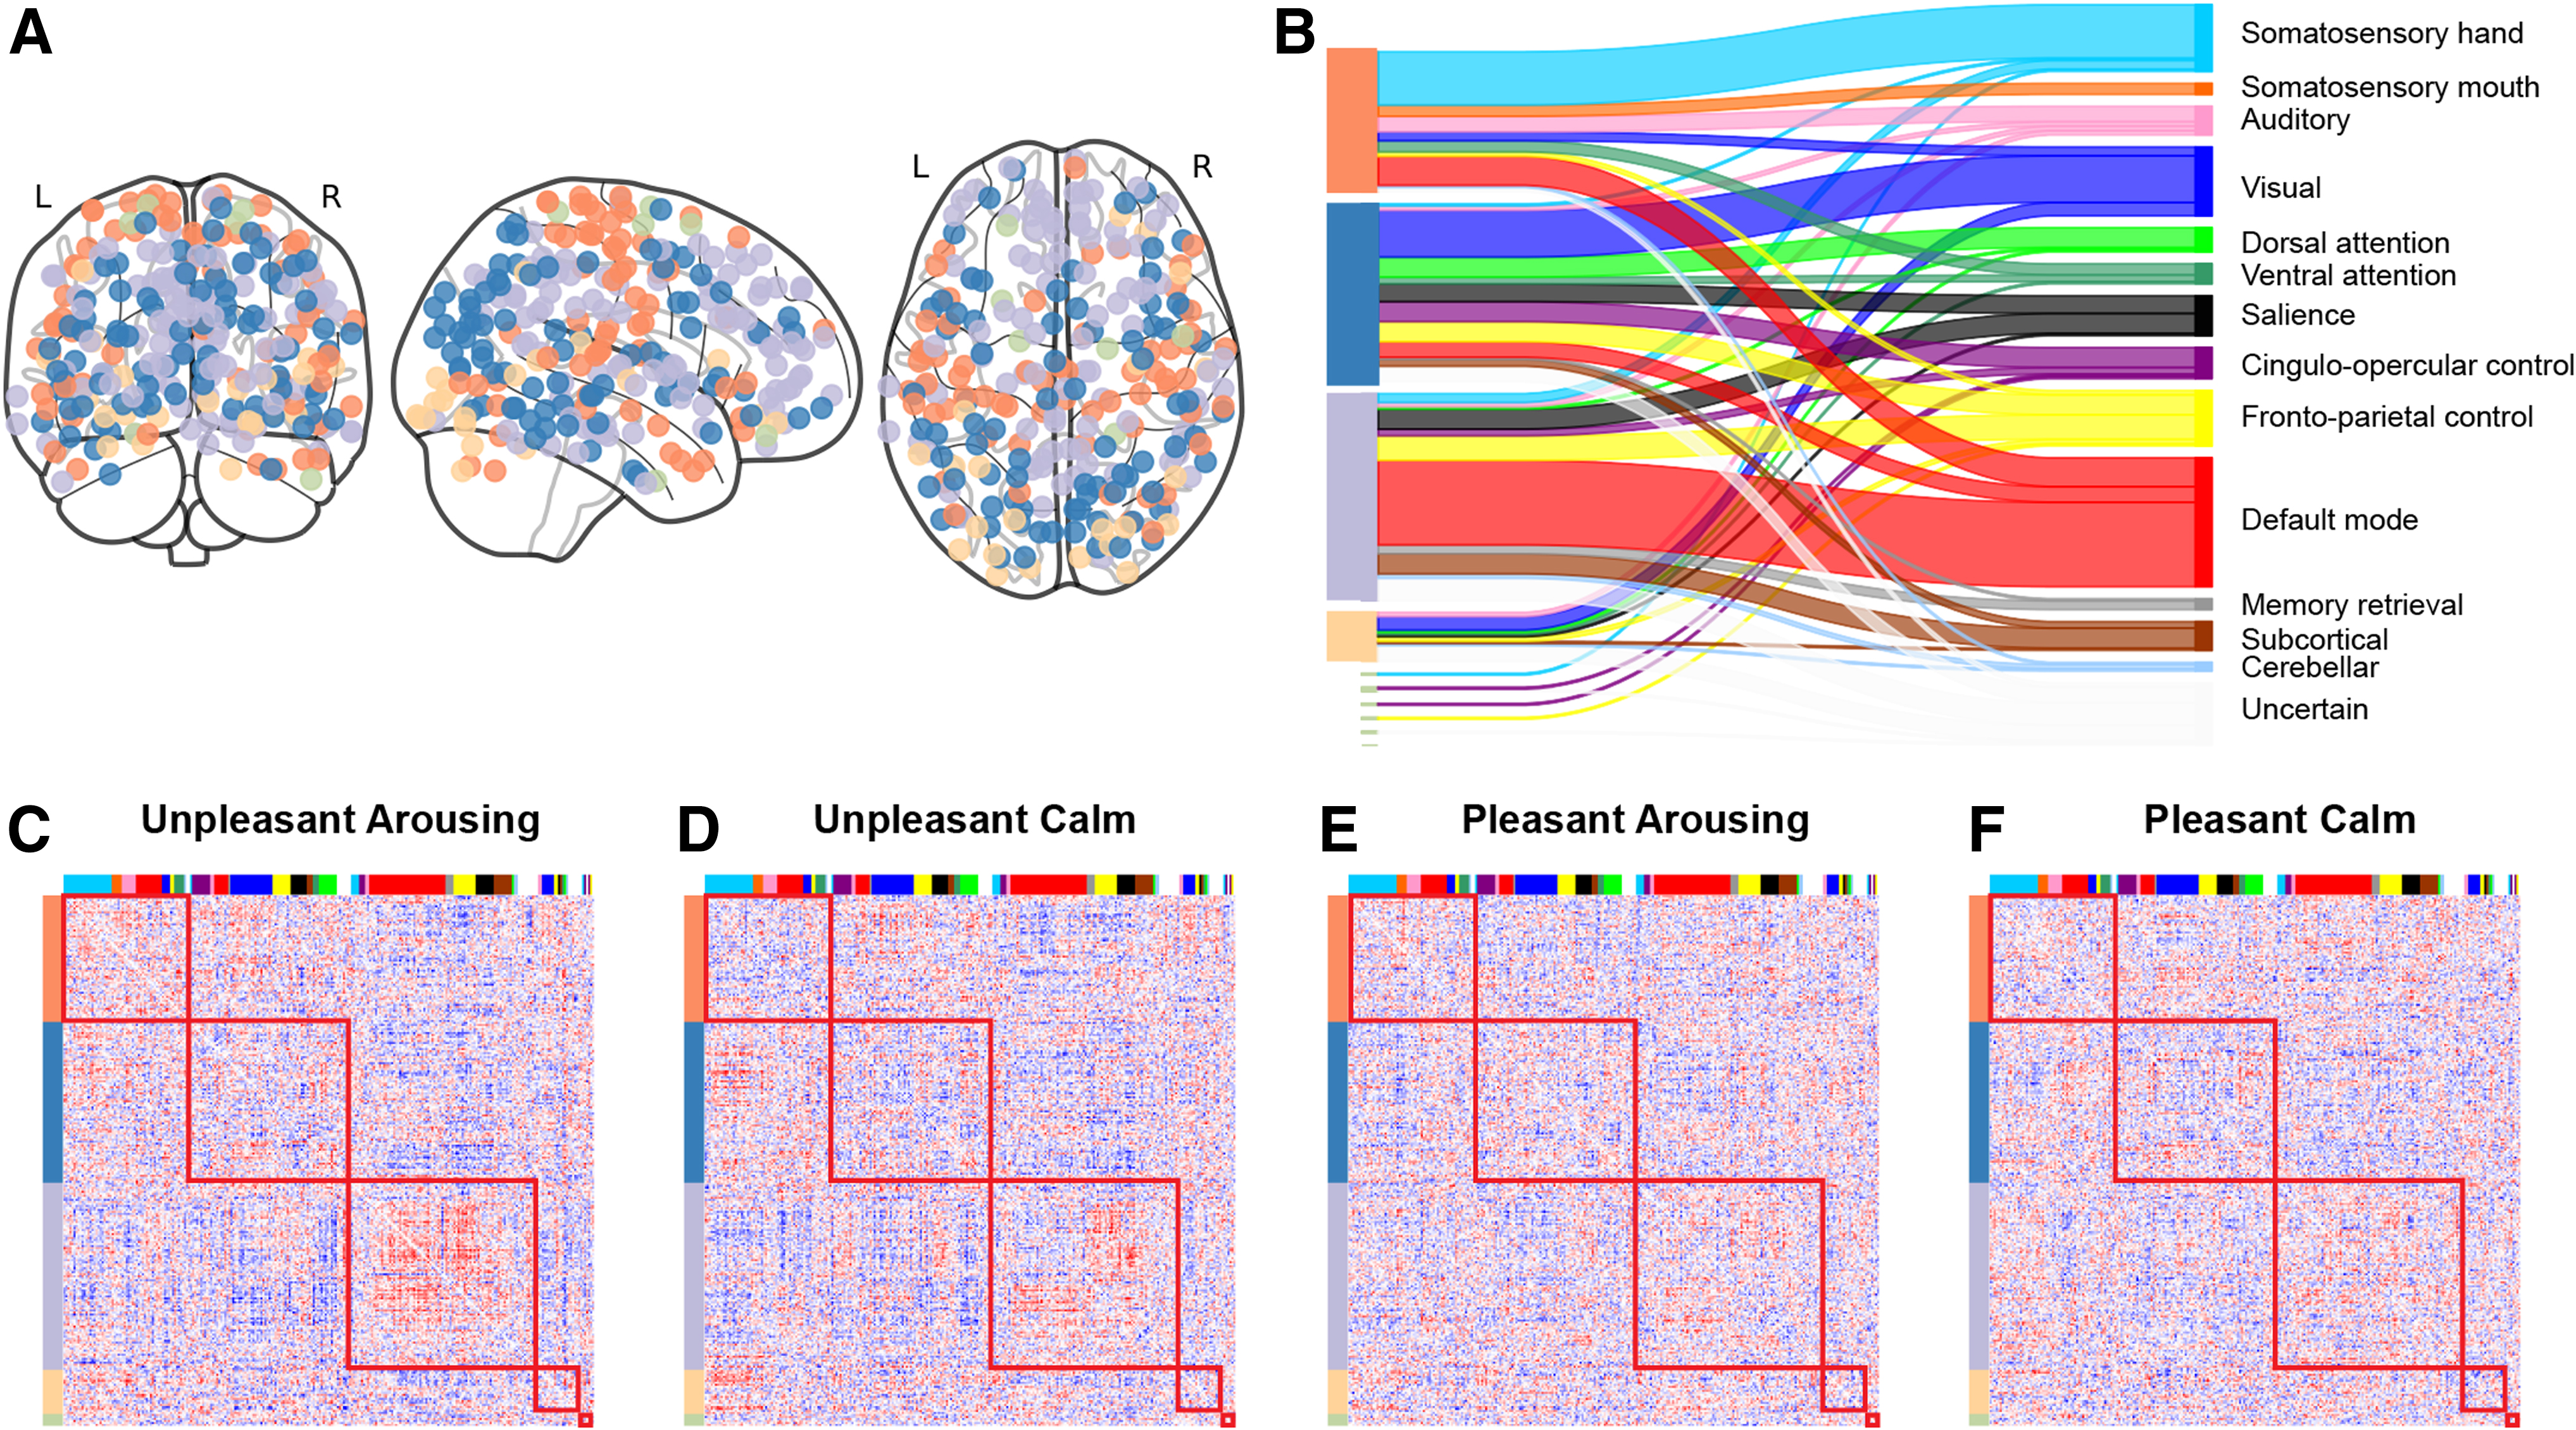
Consensus community detection across conditions.
In addition, a fourth community, although much smaller compared with the above three, was also detected. This community contained some nodes from the visual system and a few nodes from each of the frontoparietal control, ventral attention, and salience networks. Finally, a few singleton nodes were left, which did not belong to any of the four larger communities. The alluvial graph in Figure 4 shows the correspondence between our detected communities from gPPI networks with the canonical Power et al. (2011) communities.
Integration and segregation in gPPI networks
Using the detected communities, we computed within- and between-community connectivity as well as segregation score for each condition. Within-community connectivity is the average weight of edges connecting nodes in the same module, whereas between-community connectivity is the average weight of edges connecting nodes in different modules. Segregation score is the difference between within- and between-community connectivity.
A mixed-effect model showed a significant effect of valence (unpleasant subtract pleasant:
Regarding between-community connectivity, no effects of valence (
Using communities detected from the gPPI networks, the results above suggested that the unpleasant arousing condition induced a greater within-community connectivity but did not influence between-community connectivity, and overall perturbed the brain to a more segregated state than the other three conditions. However, we wanted to test if this result would hold with the canonical Power et al. (2011) system. To answer this question, we computed within- and between-community connectivity as well as the segregation score with the Power et al. (2011) brain systems and repeated the same statistical analysis. As shown in Figure 5, unpleasant arousing videos induced a greater within-community connectivity (
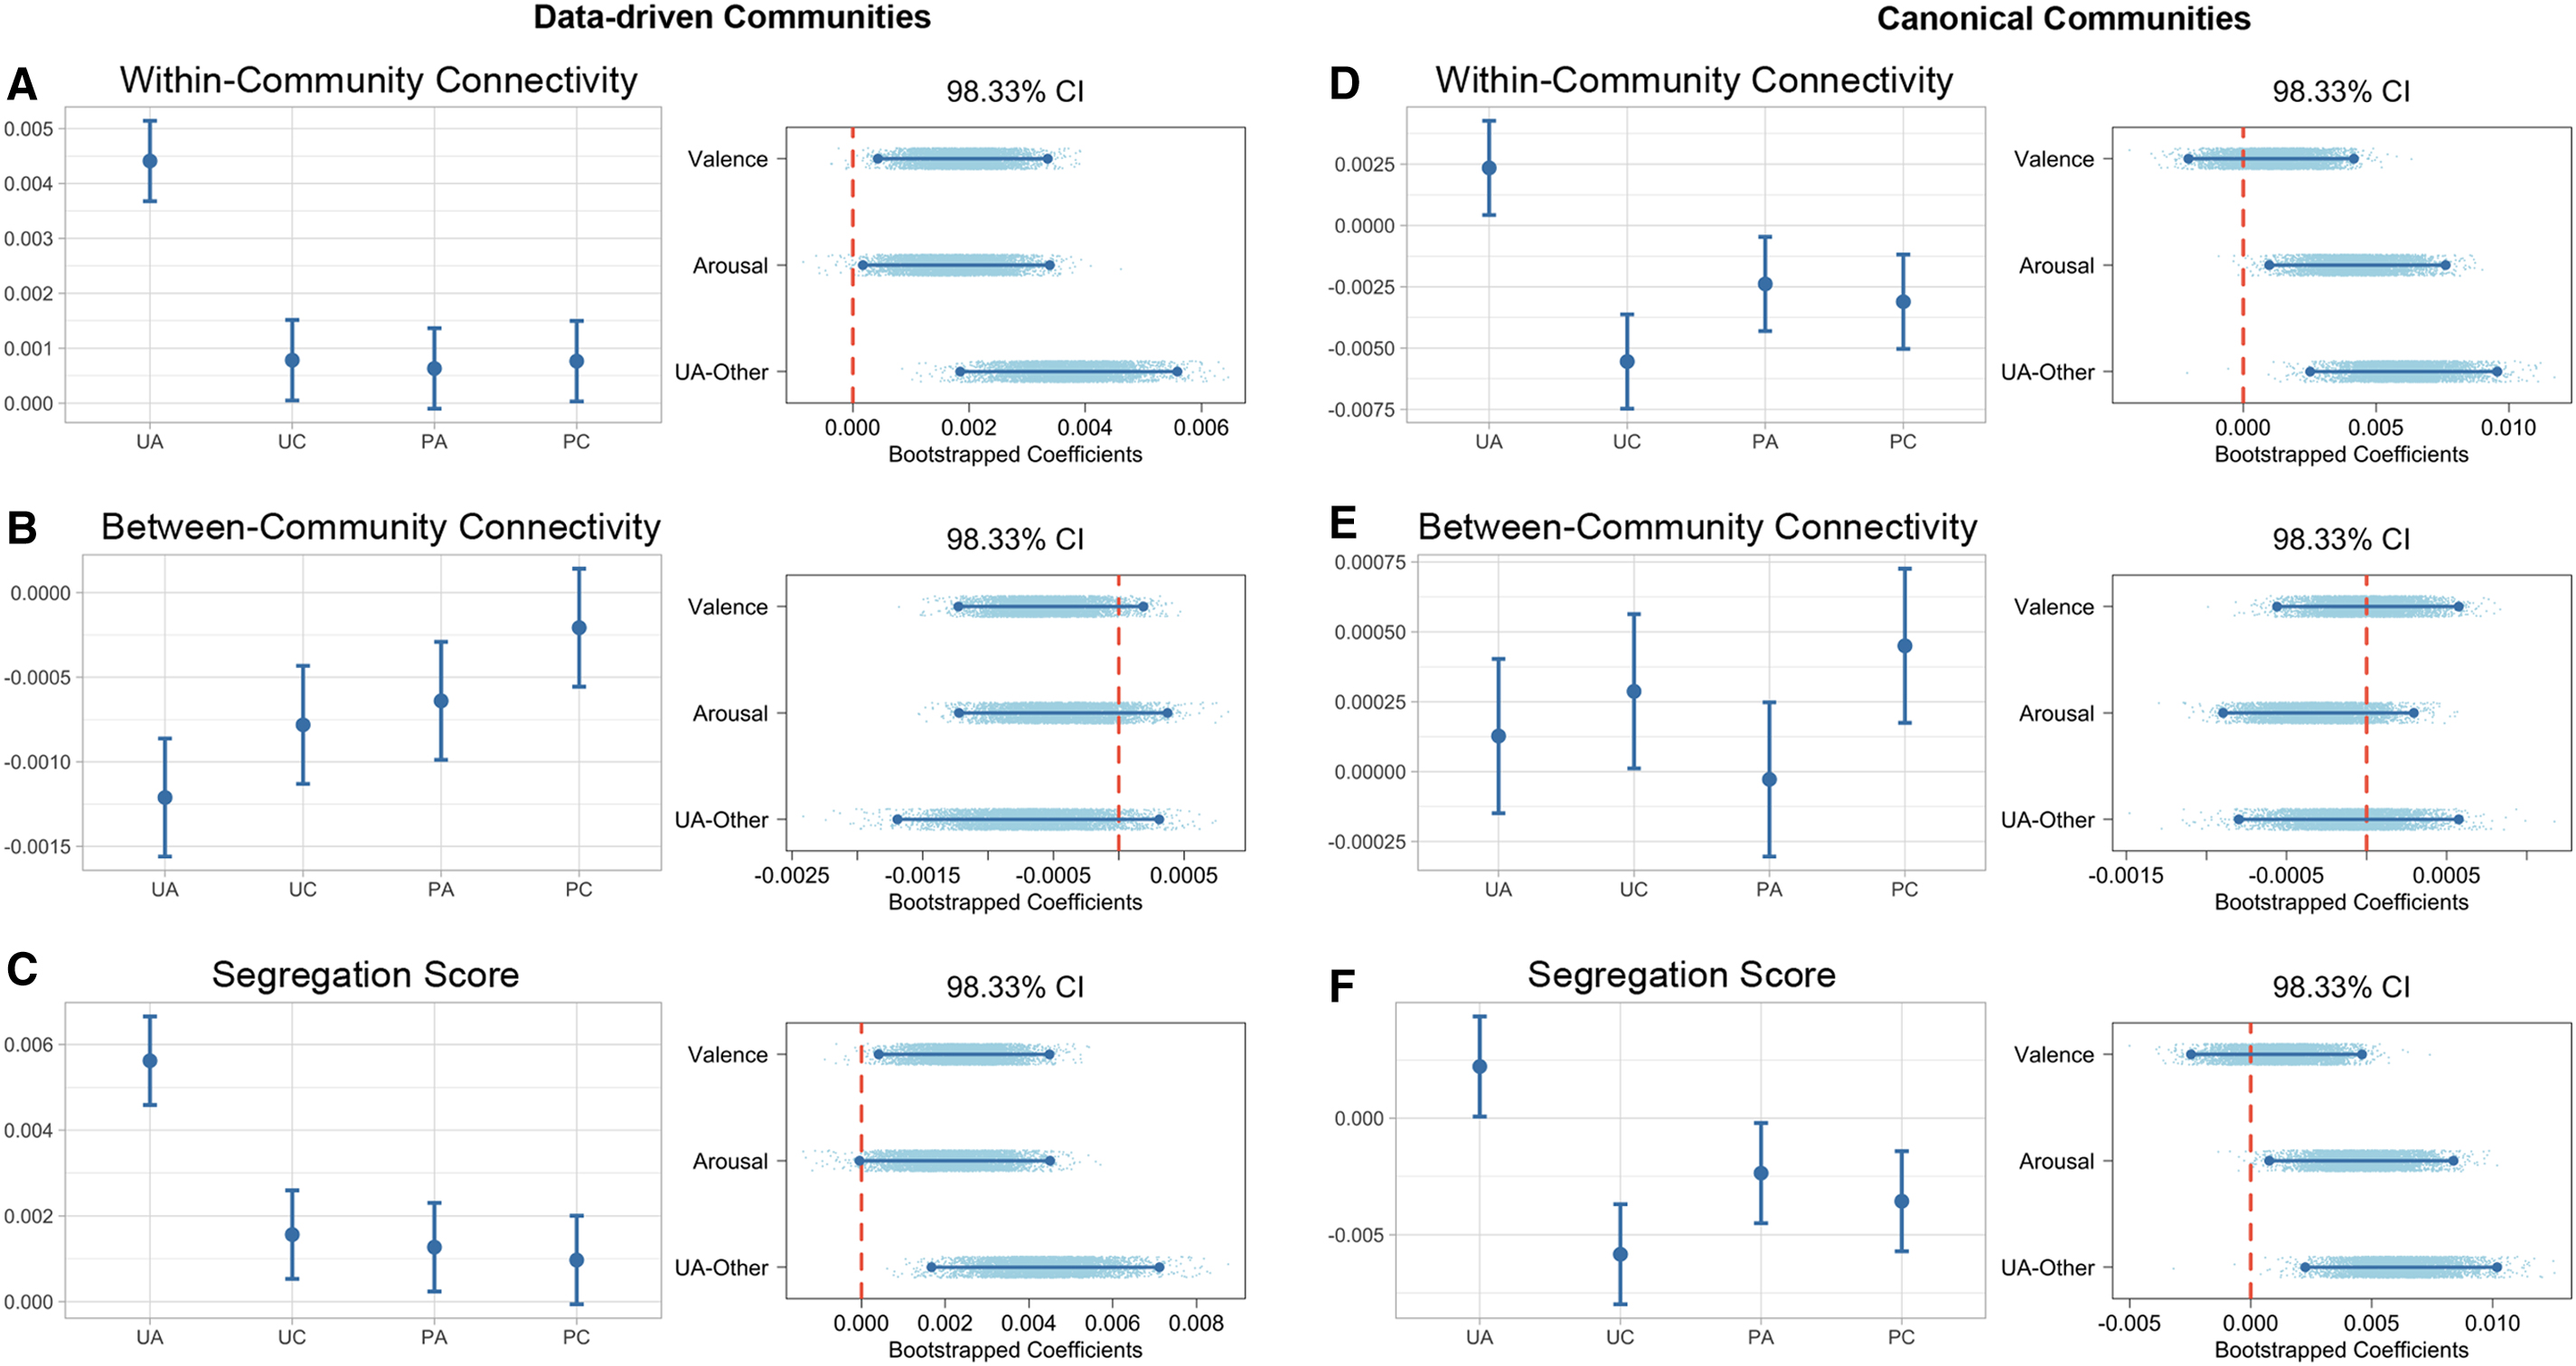
Community metrics with data-driven and canonical communities.
Meanwhile, between-community connectivity was not significantly different between the unpleasant arousing condition and the other three (
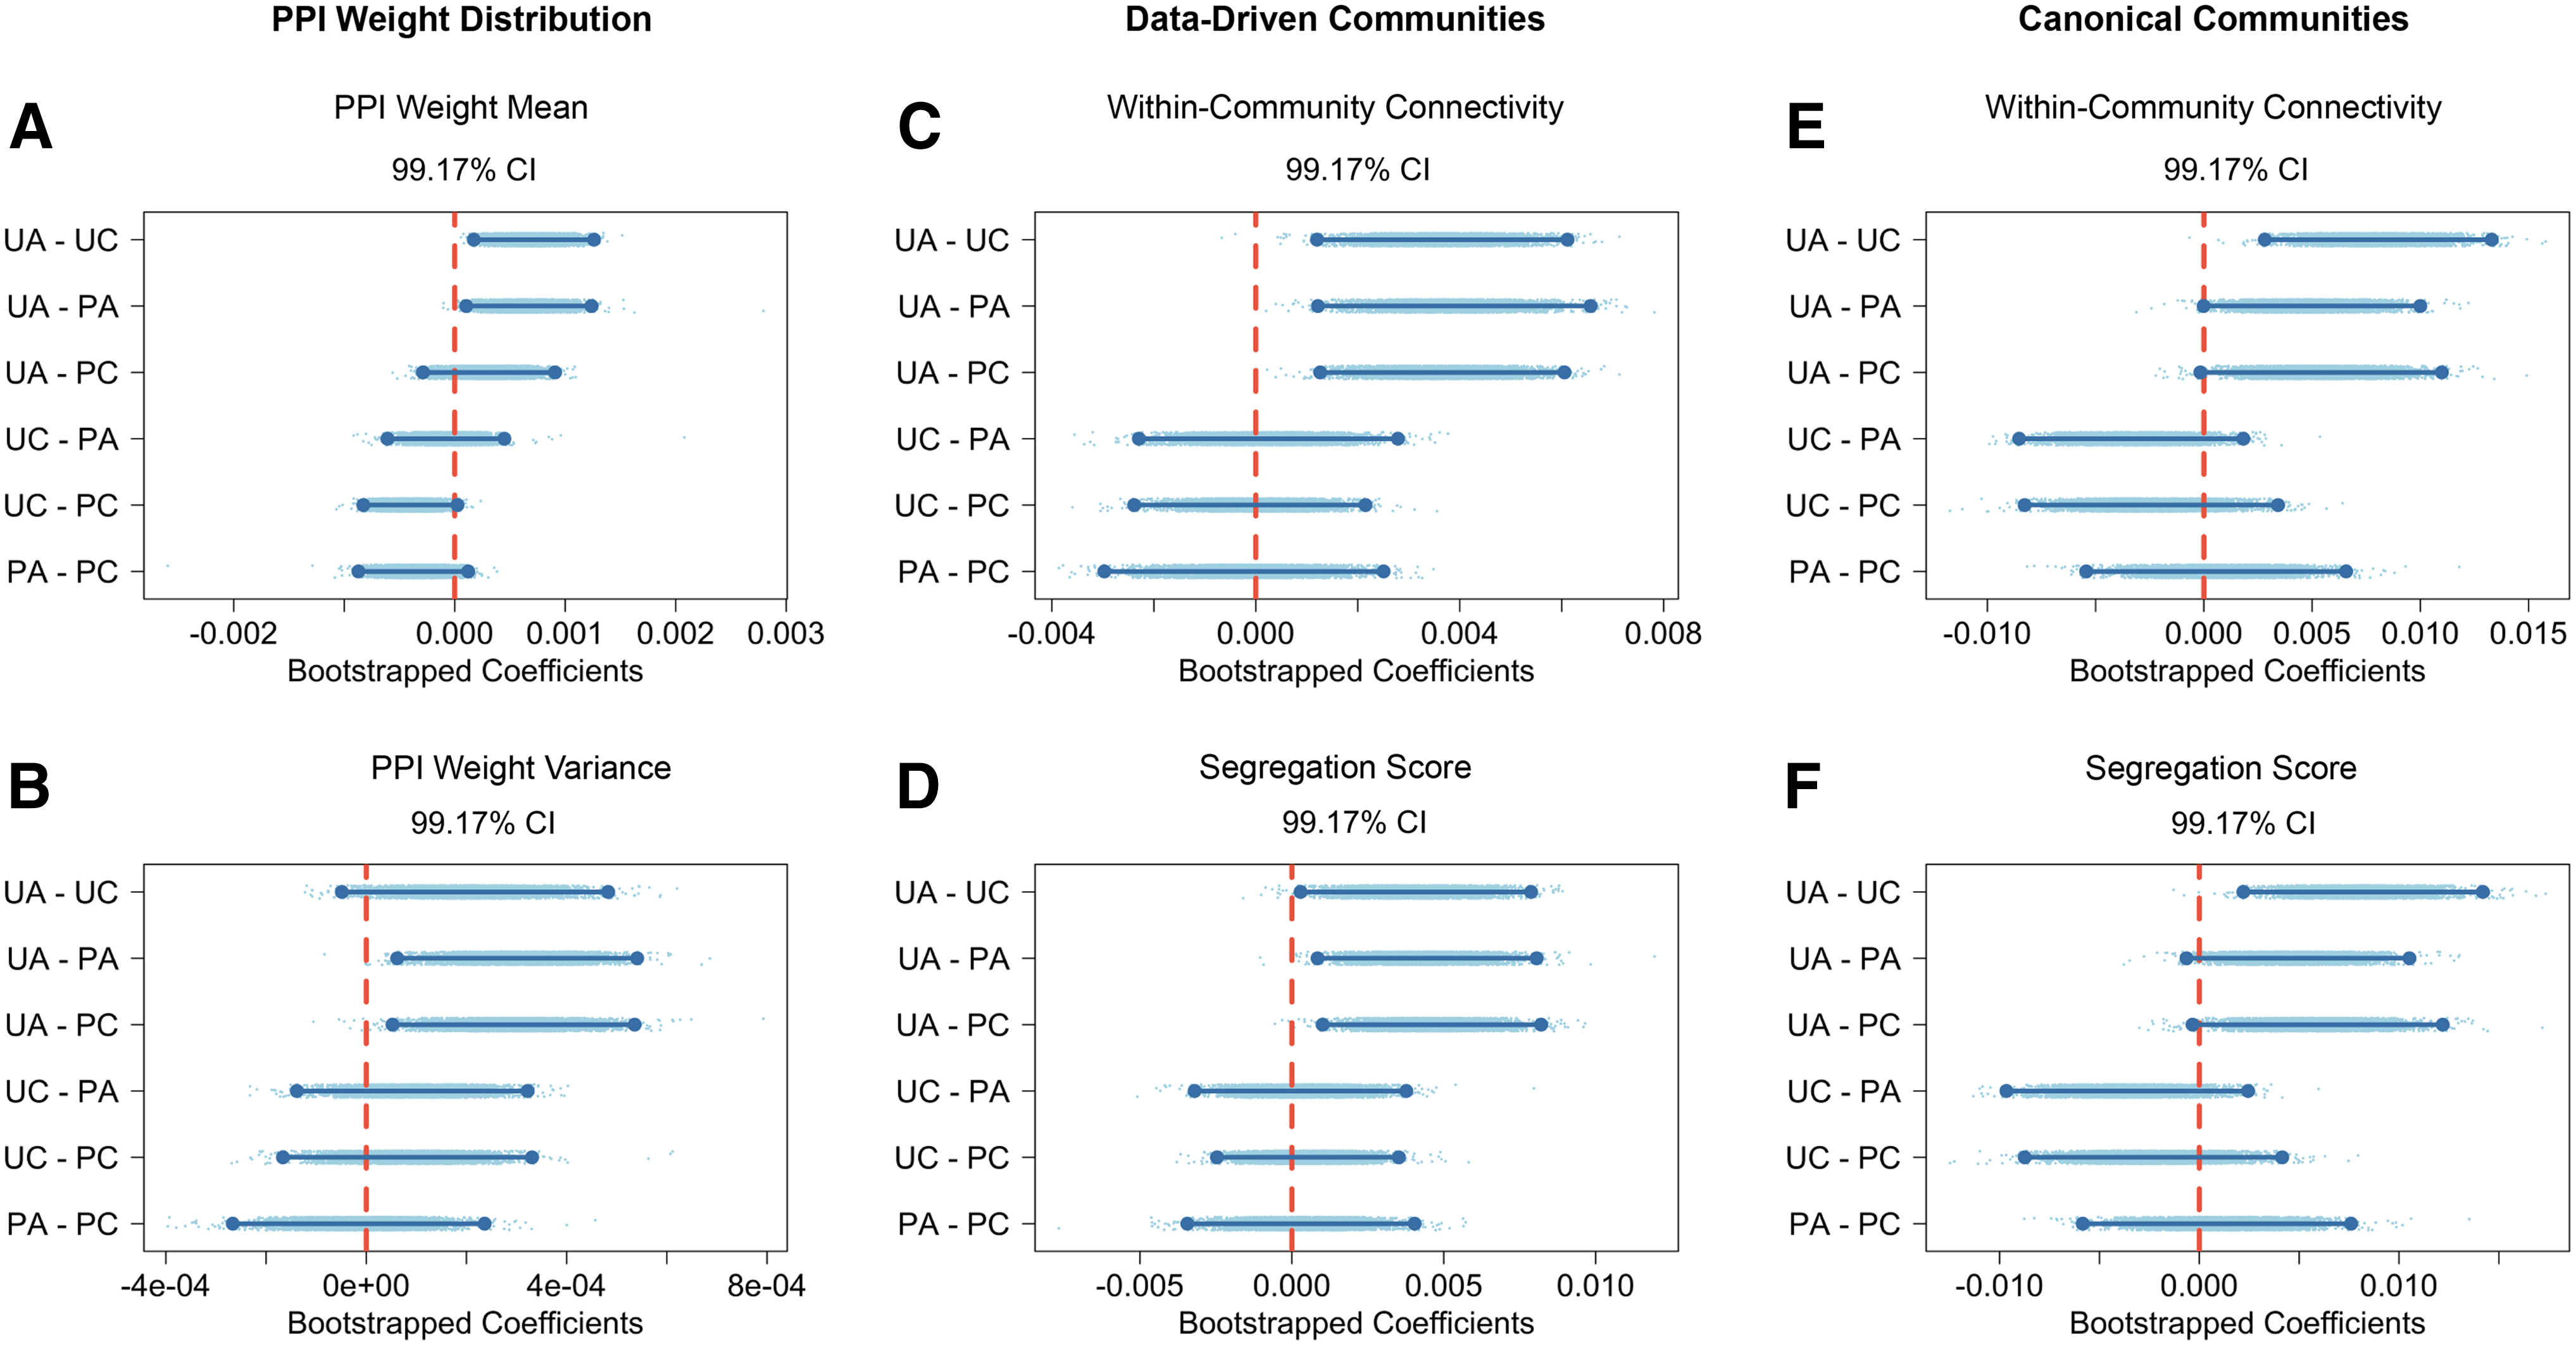
Post hoc pairwise comparison. Post hoc pairwise comparisons were conducted for the mean and variance of gPPI weight distributions
Integration and segregation in sensorimotor and association systems
The analyses so far studied the global effects of affective video on FC networks. Next, we assessed the influence of valence and arousal on FC across multiple separate brain systems. Prior studies have shown that subnetworks in the brain, such as visuo-auditory sensory systems (Thakral et al., 2022; Xu et al., 2023) and the DMN (Saarimäki et al., 2022; Xu et al., 2023), provide important information about people's affective state. In the current study, we categorized all subnetworks on a sensorimotor–association axis (Keller et al., 2023; Sydnor et al., 2021) and assessed network integration–segregation in the sensorimotor versus association systems. Specifically, we followed Chan et al.'s (2014) approach and categorized visual, auditory, and hand/mouth somatomotor systems as sensorimotor systems, and default mode, frontal–parietal, cingulo-opercular control, dorsal and ventral attention, and the salience network as association systems. We then repeated the same analyses above but separated into sensorimotor and association systems.
As shown in Figures 7 and 8, for sensorimotor systems, arousing videos induced greater within-community connectivity (
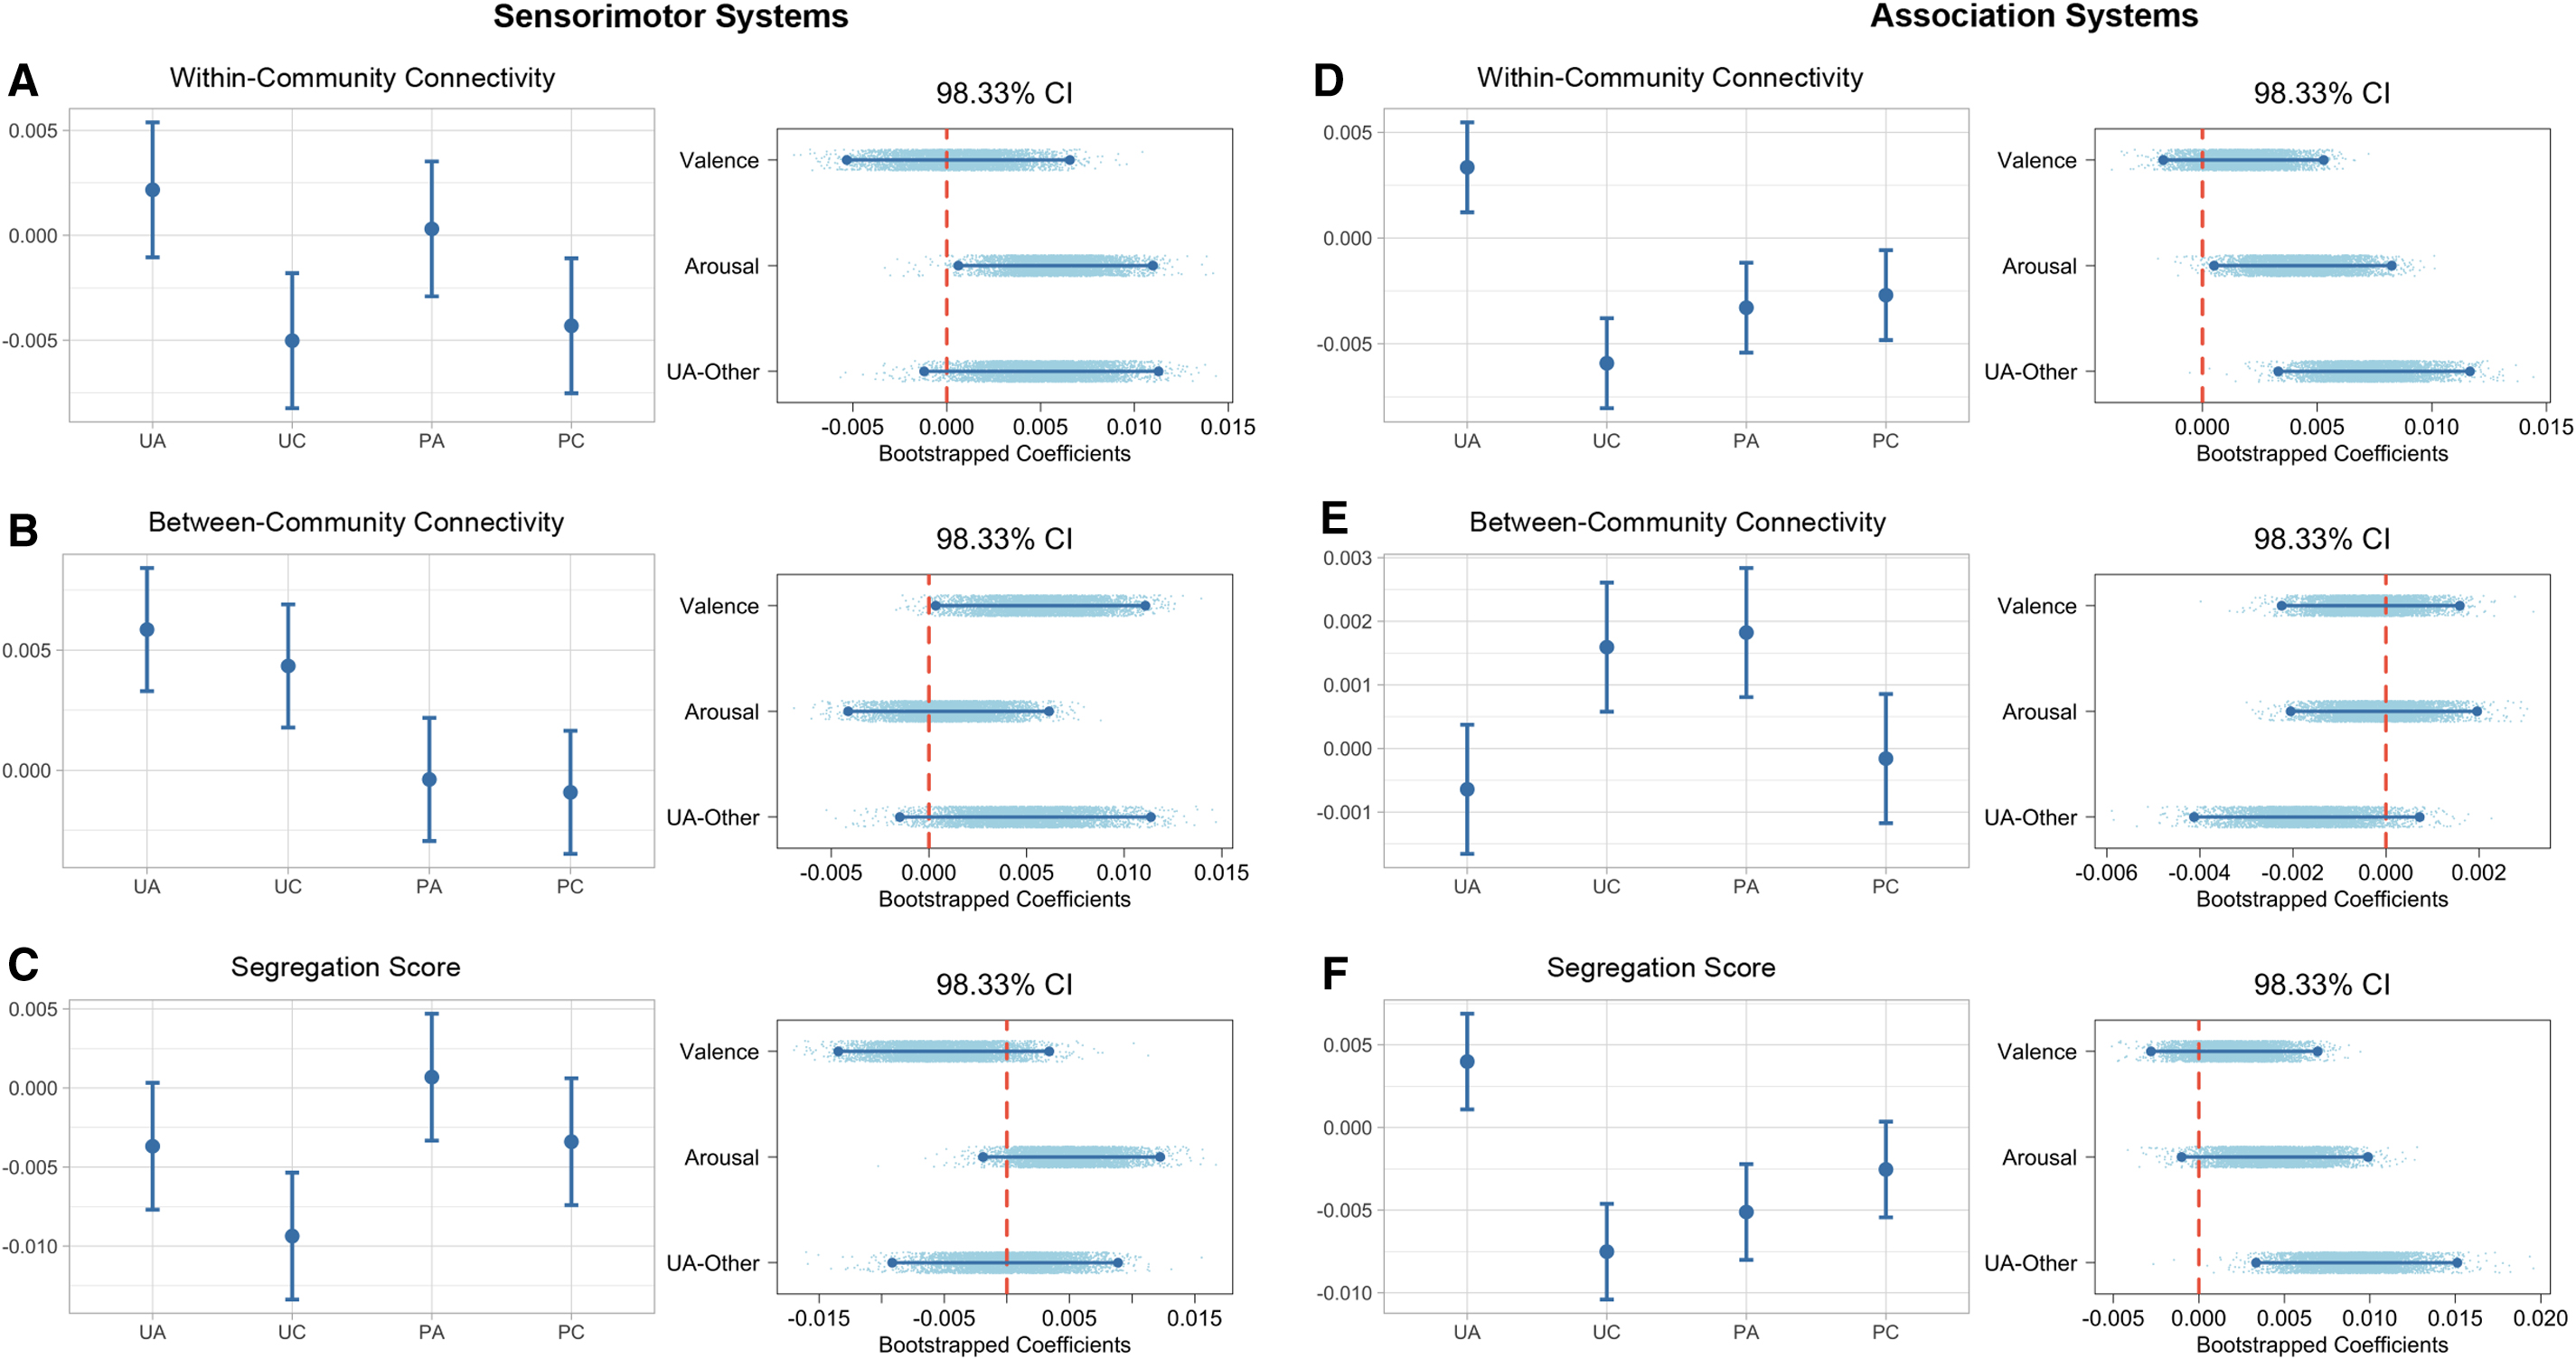
Community metrics for sensorimotor and association systems.
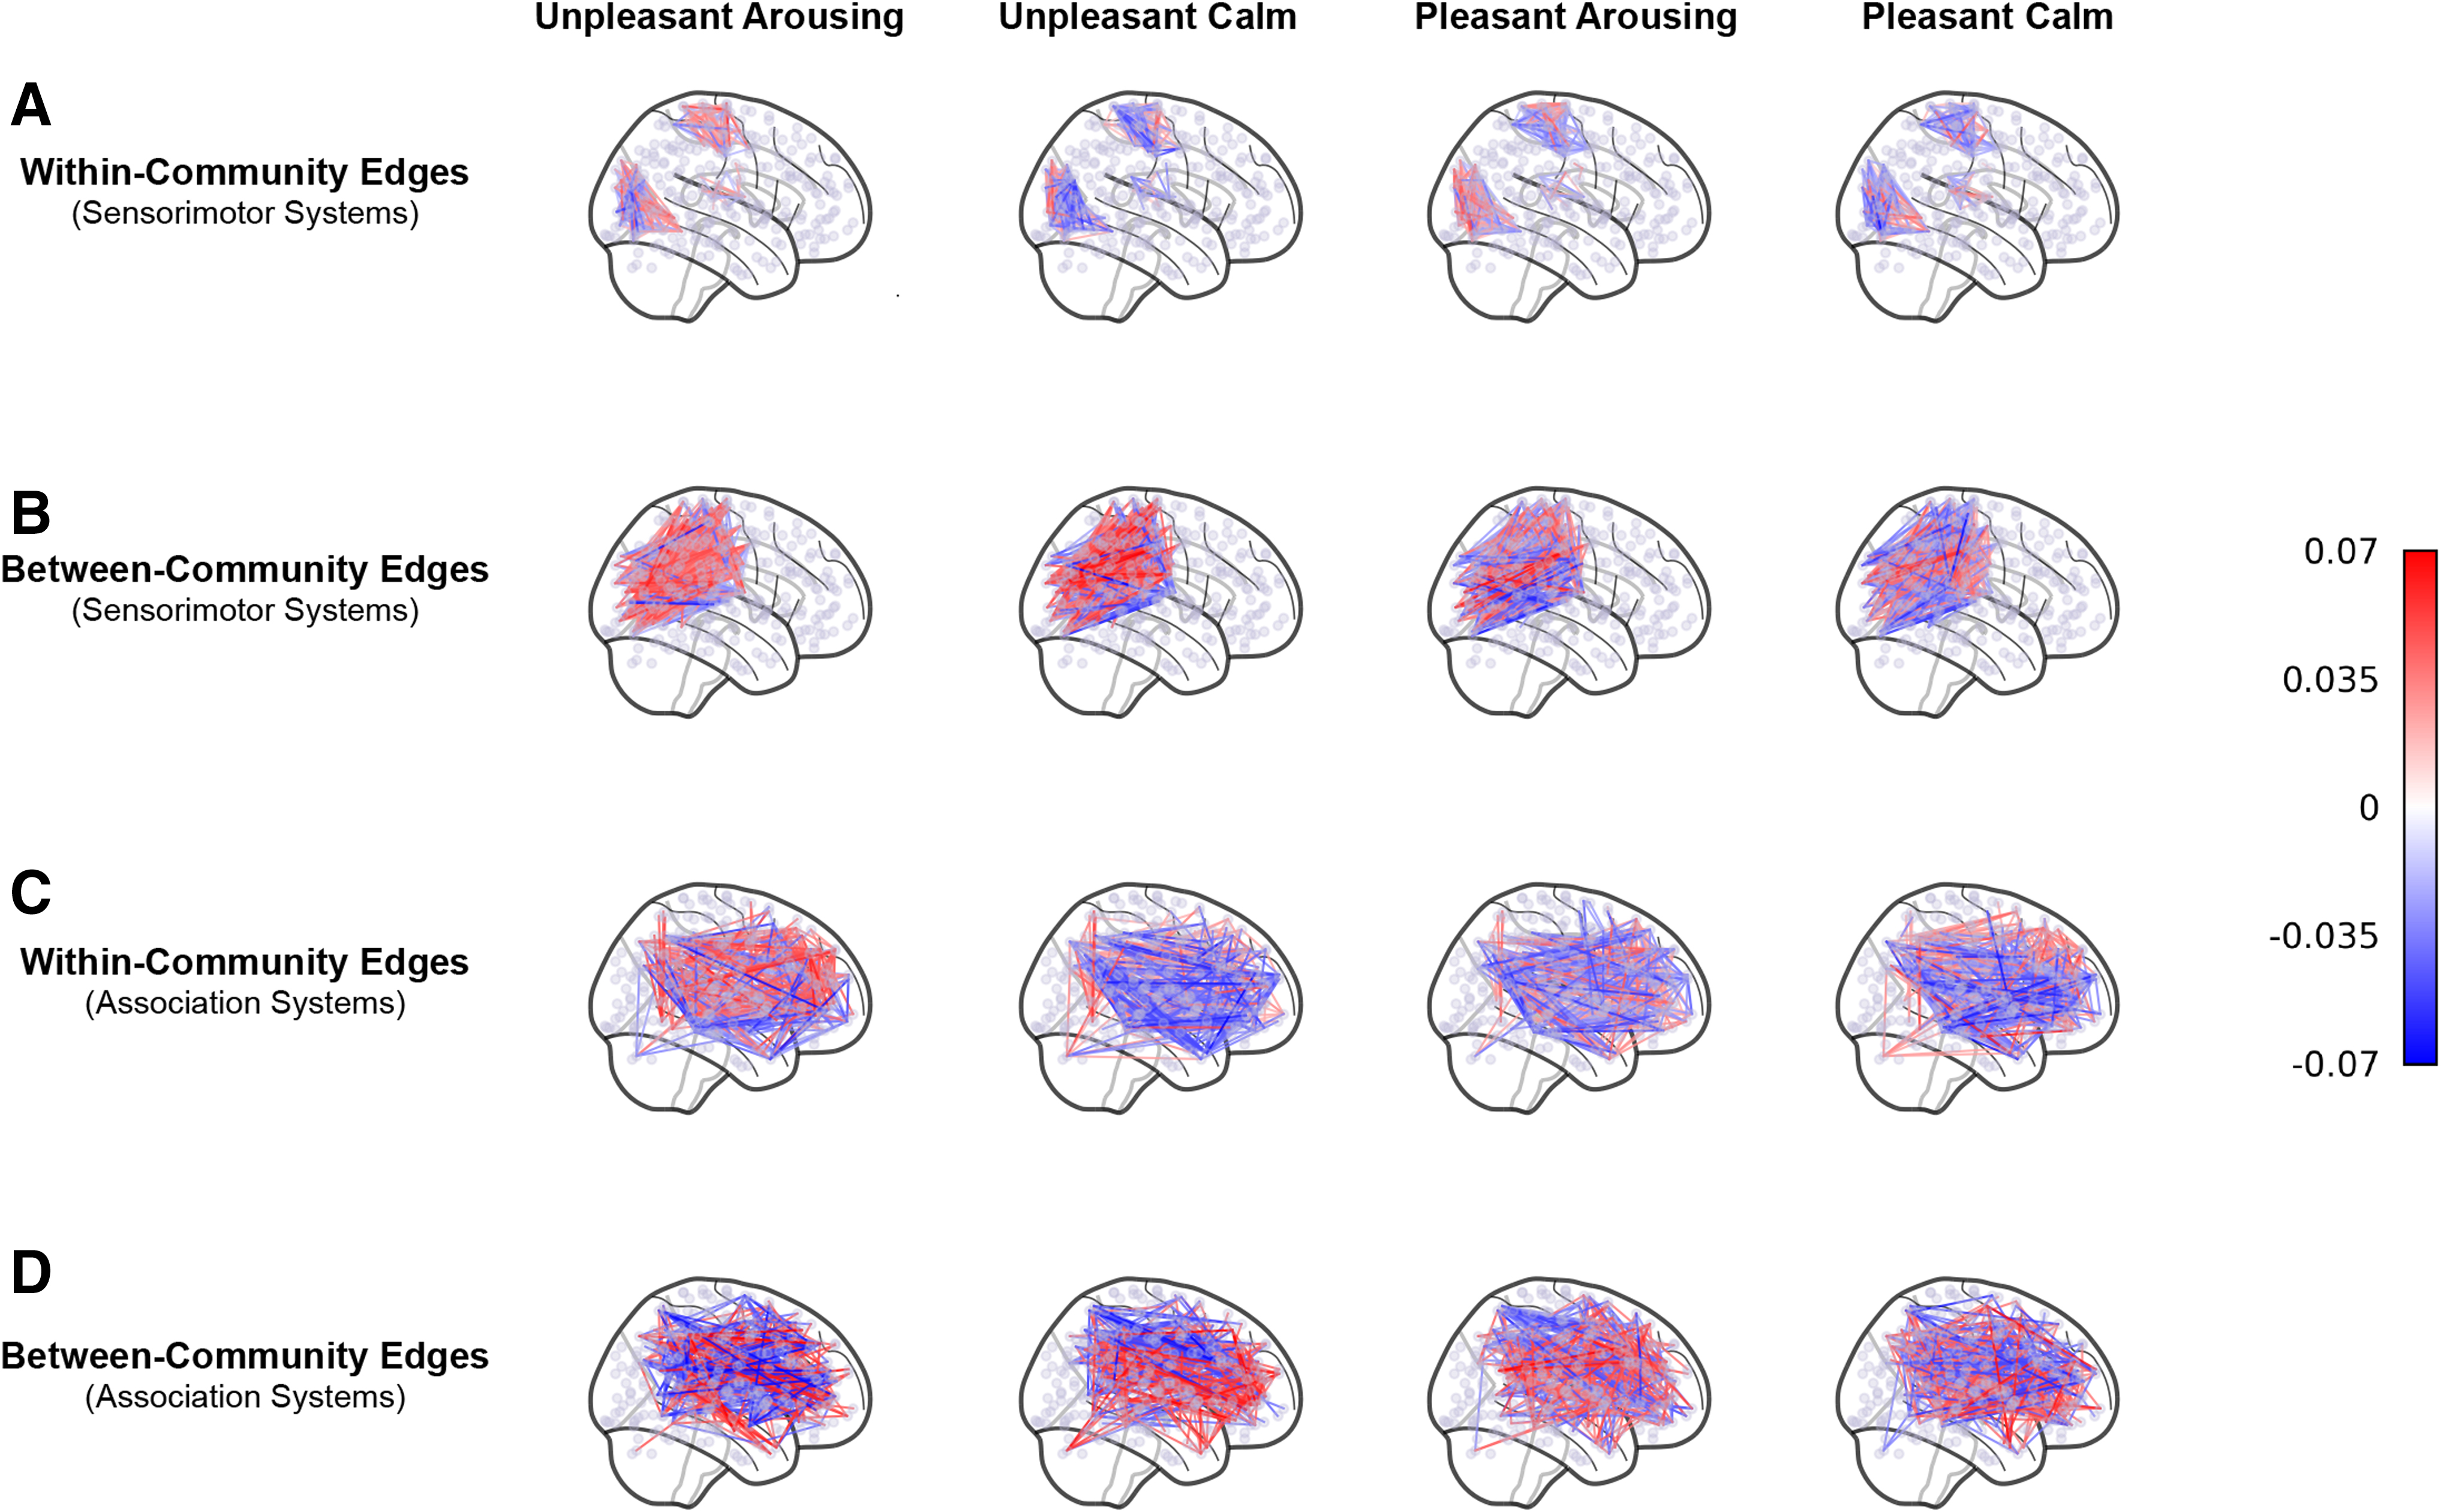
Within- and between-community edges in sensorimotor and association systems. The plotted edges are gPPI weights above the top 1% absolute values, averaged across subjects, and represented in anatomical space.
Discussion
We performed a task-based FC analysis paired with graph theoretics to investigate changes in brain network dynamics when people watched videos with different affective valence and arousal levels. The primary result was that only unpleasant arousing videos produced significant deviations of FC from baseline, whereas the other video types had relatively smaller effects on FC. Moreover, by applying community detection methods (Betzel et al., 2017; Newman and Girvan, 2004) and network integration–segregation measures (Chan et al., 2014) to gPPI networks, we found that the FC deviation produced by unpleasant arousing videos led to more segregation. We further examined FC network integration–segregation along the sensorimotor–association axis (Keller et al., 2023; Sydnor et al., 2021) and found that unpleasant arousing video increased segregation only among the association systems, not the sensorimotor systems. This study used a relatively novel approach by pairing gPPI analysis with community detection methods and contributes to our understanding of how changes in brain network dynamics may be influenced by exposure to naturalistic affective stimuli.
Effects of unpleasant arousing video on FC
We studied the influence of affective videos on brain dynamics by examining tiFCd reflected in PPI edge weights. Using data collected by Kim et al. (2016), we found that watching unpleasant arousing video content (e.g., men fighting and riots) induced an overall increase of FC across the brain, as shown in the increased mean of PPI weights relative to other conditions. In addition, the unpleasant arousing condition resulted in a wider distribution of PPI weights, as indicated by the relatively higher variance compared with other conditions. As shown in Figure 3, the distributions of PPI weights are nearly symmetrical around zero. Thus, the wider distribution of PPI weights in the unpleasant arousing condition could suggest that this type of affective content not only induced more FC increase but might also evoked more FC decrease in part of the brain.
To verify this claim, in Supplementary Figure S2 in the Supplementary Data, we further separated PPI edges into positive and negative weights and found that the mean of positive weights was greater, and the mean of negative weights was more negative for the unpleasant arousing condition than others. Taken together, these results suggest that unpleasant arousing videos caused the greatest tiFCd and perturbed the brain to a greater degree than the other types, potentially reflecting a functionally distinct brain state.
To further describe the characteristics of the tiFCd, we used community detection methods and analyzed gPPI networks from a community integration–segregation perspective. In the analysis, we first detected modules from the gPPI networks using a data-driven procedure. With the detected modules, we found that the unpleasant arousing videos induced a stronger within-community connectivity but had no effect on between-community connectivity. Because segregation is a relative measure quantifying the distance between within- and between-community connectivity (Chan et al., 2014), we found a higher level of segregation for the unpleasant arousing condition than all other types.
In other words, the unpleasant arousing content not only produced the greatest tiFCd, but it also shifted the brain to a more segregated state. To test if such results were still observed with canonical brain systems, we used the 14 communities detected from Power et al. (2011) and repeated the same analysis. A similar pattern was observed. Within-community connectivity was higher for the unpleasant arousing condition than others, but between-community connectivity did not differ across conditions. The segregation score, which measures the difference between within- and between-community connectivity, was significantly higher in the unpleasant arousing condition than others, further assuring that unpleasant arousing content increased segregation in FC network.
We hypothesized that unpleasant arousing video might increase network segregation because prior works have shown that people tend to avoid processing overly aversive media content (Clayton et al., 2019; Lang, 2006; Leshner et al., 2018; Leshner et al., 2011) and, also, increased FC network segregation (i.e., decreased integration) has been previously associated with decreased attentional resource allocation (Cohen and D'Esposito, 2016; Godwin et al., 2015; Shine et al., 2016). Our overall findings supported this hypothesis. However, it is important to note that our analyses are based on an open dataset that lacks behavioral measures of attention or engagement. Therefore, we do not have definite evidence claiming that the increased segregation in the unpleasant arousing condition is caused by people disengaging with this type of affective content. An alternative interpretation could be that people remain more alert and vigilant when exposed to unpleasant arousing content, which is also a phenomenon documented in the affective literature (Lang, 1995; Lee, 2017).
In Supplementary Figure S6 in the Supplementary Data, we show that FC within the cingulo-opercular network (CON) and DMN was strengthened in the unpleasant arousing condition compared with others, which possibly contributed to the overall increased within-community connectivity observed in unpleasant arousing condition. Previous research has associated CON activation with sustained alertness (Coste and Kleinschmidt, 2016; Sadaghiani and D'Esposito, 2015), while DMN activity has been linked to enhanced wakefulness and vigilance (Liu et al., 2015; Sämann et al., 2011). Thus, although speculative, it is possible that the enhanced alertness is a driver for the observed effects of increased within-community connectivity and the overall segregation. However, like our interpretation about disengagement, the current data do not contain direct measures of alertness, which prevents us from making definite conclusions. Future studies could add behavioral or physiological measures and assess if results in the current study can be extended.
Integration–segregation in sensorimotor and association systems
The above analysis provided a global assessment of FC segregation and integration across the brain. However, researchers have pointed out that brain systems can be placed on a sensorimotor–association axis based on their anatomy and function and can be generally categorized into sensorimotor systems and association systems (Chan et al., 2014; Keller et al., 2023; Sydnor et al., 2021). Prior works have also shown that neural responses in both sensorimotor (Thakral et al., 2022; Xu et al., 2023) and association systems (Saarimäki et al., 2022; Xu et al., 2023) provide important information related to one's affective state. Thus, we further asked if the unpleasant arousing videos increased segregation in both sensorimotor and association systems or if the effect was stronger in one or the other. To answer this question, we followed Chan et al.'s (2014) approach and analyzed segregation metrics for sensorimotor and association systems separately.
Results indicated that the unpleasant arousing content did not perturb the sensorimotor systems to a more segregated state. For the sensorimotor systems, we found that unpleasant videos induced a greater between-community connectivity than pleasant ones, whereas arousing content evoked a greater within-community connectivity than calm ones. These results are consistent with previous findings showing that sensory regions in the brain respond stronger to unpleasant than pleasant stimuli (Thakral et al., 2022) and respond stronger to arousing than calm stimuli (Lin et al., 2020). However, our results showed that although the sensorimotor systems responded stronger to both unpleasant and arousing stimuli, the mechanism might potentially be different. Specifically, when responding to arousal or emotional salient stimuli, local communication within sensory systems was strengthened, whereas when responding to unpleasant stimuli, communications across sensorimotor systems seemed to increase. This is a relatively new perspective when examining sensory responses to affective stimuli and these findings warrant further investigation.
We did observe increased segregation within the association systems in response to the unpleasant arousing condition. Similar to the global effects, the unpleasant arousing videos evoked a higher within-community connectivity than other conditions.
However, there were no significant differences in between-community connectivity between the unpleasant arousing video and other conditions.
Since unpleasant arousing condition did not increase segregation in sensorimotor systems, the observed global effect of increased segregation might be primarily driven by changes in the association systems. In other words, although valence and arousal influenced FC in both sensorimotor and association systems, the FC pattern in association system seems to contain crucial information differentiating the unpleasant arousing condition from others. This pattern of global effects largely driven by neural responses in the association systems has been previously reported in Saarimäki et al.'s (2022) MVPA study which showed that although whole-brain FC pattern could be used to classify people's affective state, when assessing the classification accuracy across subnetworks, only DMN passed the threshold.
PPI as a method for understanding brain states
The goal of this study was to examine how affective videos influence FC networks by using a relatively novel approach, namely paring gPPI networks with community detection techniques. As described in the Methods section, a gPPI network analysis produces three types of matrices, a resting-state-like PHY matrix representing the partial correlation between BOLD time series across all pairs of nodes, a set of PSY matrices reflecting task-induced nodal activation pattern, and finally, a set of PPI matrices that are intended to capture any activation effects that cannot be explained by (or go above and beyond) the PHY and PSY matrices alone. One way to conceive of the three components of the gPPI model is that the PHY and PSY weight matrices superimposed could be considered a baseline that reflects the combination of a resting-state-like backbone (PHY matrix) plus the nodal influence of the task manipulation (PSY matrices). The PPI weight matrix then reflects FC deviations from this baseline.
A gPPI analysis is an elegant way of studying task-based FC network as it uses a single GLM to account for the backbone of resting-state-like FC, the effects of task-induced nodal activation and tiFCd. Certainly, one can use other methods to study the above three effects or some combination of those effects. For example, when constructing task-based FC networks, researchers sometimes first regress out task-related activity and then run Pearson's correlation (Sun et al., 2020) or use a moving window technique to remove averaged BOLD activity level within short temporal windows (Betzel et al., 2020). In both approaches, task-induced effects on nodal activation (analogous to our PSY matrices) are removed, but the rsFC backbone is retained.
Therefore, the final matrices would be similar to a combination of PHY and PPI matrices from a gPPI analysis, which may be more difficult to interpret than the PPI matrices alone. A few other studies (Cohen and D'Esposito, 2016; Cole et al., 2021; Hermundstad et al., 2013) have taken a slightly different approach and computed Pearson's correlation for task periods and rest periods separately. The researchers then contrasted the task-period FC matrices against the rest-period FC matrix to generate task-induced deviation from resting state. All these are useful tools to study task-based FC, and we do not argue that gPPI is particularly advantageous. However, neuroscientists may consider adding gPPI to their toolbox, because as we stated earlier, it elegantly wraps the rsFC backbone, experiment-induced nodal activation pattern, and task-induced FC change in a single GLM.
Finally, the combination of community detection methods and PPI networks provides a relatively novel perspective of assessing task-induced perturbations on brain states. Community detection methods are more often carried out using resting-state data (Chan et al., 2014; Power et al., 2011) or task-based data but with the resting-state-like backbone retained (Betzel et al., 2020; Cole et al., 2014; Sun et al., 2020). In the current study, we showed that even without the resting-state-like FC backbone, a few communities can still be detected which appeared to resemble communities obtained from rsFC networks (Power et al., 2011).
Using a gPPI analysis, the rest-state-like backbone (PHY weight matrix), along with the task-induced nodal activation pattern (PSY weight matrix), is partitioned out. The communities detected from gPPI matrices thus encapsulate nodes which tend to increase FC strength together solely based on the experimental manipulation. The correspondence between the communities detected from PPI matrices and canonical modules could become evidence supporting Cole et al.'s (2014) claim of the existence of intrinsic network architectures in the human brain. However, it is important to realize that detecting communities from gPPI networks has rarely been carried out before, and therefore, the communities detected from the current study need confirmation by replication in future studies.
Conclusions
In this study, we analyzed the effects of affective videos on brain dynamics using a whole-brain gPPI analysis. We found that unpleasant arousing content induced the greatest FC deviation and perturbed the brain to a more segregated state than other conditions. The study also added to our understanding of how whole-brain gPPI analysis can be used to effectively investigate behavioral perturbations of brain states.
Footnotes
Authors' Contributions
Y.N.: Conceptualization, formal analysis, visualization, writing—original draft. X.Z.: Conceptualization, writing—review and editing. R.B.: Methodology, supervision, writing—review and editing. T.W.J.: Conceptualization, methodology, supervision, writing—review and editing.
Author Disclosure Statement
The authors have no conflicts of interest to disclose.
Funding Information
No funding was received for this article.
Supplementary Material
Supplementary Data
References
Supplementary Material
Please find the following supplemental material available below.
For Open Access articles published under a Creative Commons License, all supplemental material carries the same license as the article it is associated with.
For non-Open Access articles published, all supplemental material carries a non-exclusive license, and permission requests for re-use of supplemental material or any part of supplemental material shall be sent directly to the copyright owner as specified in the copyright notice associated with the article.