
Abstract
Purpose:
Growth hormone deficiency (GHD) refers to the partial or complete lack of growth hormone. Short stature and slow growth are characteristic of patients with GHD. Previous neuroimaging studies have suggested that GHD may cause cognitive and behavioral impairments in patients. Resting-state networks (RSNs) are regions of the brain that exhibit synchronous activity and are closely related to our cognition and behavior. Therefore, the purpose of the current study was to explore cognitive and behavioral abnormalities in children with GHD by investigating changes in RSNs.
Methods:
Resting-state functional magnetic resonance imaging (rs-fMRI) data of 26 children with GHD and 15 healthy controls (HCs) were obtained. Independent component analysis was used to identify seven RSNs from rs-fMRI data. Group differences in RSNs were estimated using two-sample t-tests. Correlation analysis was employed to investigate the associations among the areas of difference and clinical measures.
Results:
Compared with HCs, children with GHD had significant differences in the salience network (SN), default mode network (DMN), language network (LN), and sensorimotor network (SMN). Moreover, within the SN, the functional connectivity (FC) value of the right posterior supramarginal gyrus was negatively correlated with the adrenocorticotropic hormone and the FC value of the left anterior inferior parietal gyrus was positively correlated with insulin-like growth factor 1.
Conclusions:
These results suggest that alterations in RSNs may account for abnormal cognition and behavior in children with GHD, such as decreased motor function, language withdrawal, anxiety, and social anxiety. These findings provide neuroimaging support for uncovering the pathophysiological mechanisms of GHD in children.
Impact statement
Children with growth hormone deficiency (GHD) generally experience cognitive and behavioral abnormalities. However, there are few neuroimaging studies on children with GHD. Moreover, prior research has not investigated the aberrant brain function in patients with GHD from the perspective of brain functional networks. Therefore, this study employed the independent component analysis method to investigate alterations within seven commonly observed resting-state networks due to GHD.
The results showed that children with GHD had significant differences in the salience network, default mode network, language network, and sensorimotor network. This provides neuroimaging support for revealing the pathophysiological mechanisms of GHD in children.
Introduction
Short stature is a common growth and development disorder in pediatrics. The height of children with short stature is lower than the mean height of normal children of the same sex and age by more than two standard deviations (Polidori et al., 2020). Causes of short stature in children are mainly classified as idiopathic or growth hormone deficiency (GHD) (Backeljauw et al., 2021).
The probability of short stature is about 2.5%, of which the incidence of idiopathic short stature (ISS) is about 60–80% and GHD accounts for 10% (Hu et al., 2019). Unlike ISS, GHD is a pathological cause of short stature, characterized by growth hormone (GH) concentrations below 10 μg/L.
GH regulates multiple functions such as cognition, behavior, neuroendocrine changes, and metabolism (Wasinski et al., 2019). Children with GHD often exhibit anxiety and depression (Abe et al., 2009; Karachaliou et al., 2021). Although GH replacement can improve patients' cognitive and motor impairments (Falleti et al., 2006; Liu and Su, 2020), it is still important to explore the pathophysiological mechanism of GHD in children with GHD because childhood is an important period of brain development.
Currently, advanced neuroimaging techniques enable us to study the pathophysiological mechanisms of GHD (Dennis and Thompson, 2013). However, there are few neuroimaging studies on children with GHD. Resting-state functional magnetic resonance imaging (rs-fMRI) is a neuroimaging technique that is widely used to study brain activity in neuropsychiatric diseases (Ding et al., 2019; Fox et al., 2005). Using rs-fMRI, Hu et al. (2019) found abnormalities in functional connectivity density (FCD) in children with GHD.
Moreover, Zhang et al. (2021a, 2021b) observed that the regional homogeneity and amplitude of low-frequency fluctuation (ALFF) were altered in children with GHD compared with healthy controls (HCs). Recently, Tang et al. (2022) found that changes in dynamic functional connectivity (FC) were different from changes in static FC. Therefore, analyzing FC in children with GHD can help us explain the effect of GHD on cognition and behavior.
In recent years, studies using FC analysis have found that the activities of some brain regions are synchronized in the resting state (Damoiseaux et al., 2006; Smith et al., 2013) and these brain regions are called resting-state networks (RSNs) (Seitzman et al., 2019). RSNs are involved in primary perceptual functions such as motor, vision, and hearing, as well as higher cognitive functions such as memory, executive control, and language (Smith et al., 2013; Smith et al., 2009; Smitha et al., 2017).
Alterations in RSNs have been identified in many diseases, such as anxiety disorders (Northoff, 2020), brain tumors (Ding et al., 2019), and white matter lesions (Ding et al., 2018). Therefore, investigating RSNs can help us understand the pathophysiological mechanisms of GHD in children.
In light of previous findings, we hypothesized that children with GHD may exhibit alterations in RSNs. To test this hypothesis, we identified seven common RSNs using independent component analysis (ICA) on the rs-fMRI data of the GHD group and HC group. The seven RSNs were the executive control network (ECN), salience network (SN), default mode network (DMN), language network (LN), auditory network (AN), visual network (VN), and sensorimotor network (SMN).
In addition, we measured the correlations between clinical measures and FC values in abnormal brain regions in children with GHD. The purpose of the current study was to explore differences in RSNs between the two groups and provide imaging support for exploring abnormal cognition and behavior in children with GHD.
Materials and Methods
Participants
The magnetic resonance imaging (MRI) data of all subjects were the same as those used in earlier studies by our research group (Zhang et al., 2021a; Zhang et al., 2021b). These participants were enrolled from the Pediatric Clinic of Zhejiang Provincial People's Hospital. The Medical Ethics Committee of the hospital approved this study, and this study was consistent with the Declaration of Helsinki. All guardians of the participants consented to their children's participation and provided written informed consent. Participants were all right-handed. To rule out the influence of medicine on the brain, an MRI scan was conducted before the GH provocation test.
In the GH stimulation test, two or more abnormal results of the GH provocation tests can be judged as GHD (Chesover and Dattani, 2016). The first group comprised 26 children who showed complete or partial deficiency of GH (<10 μg/L) on arginine and clonidine GH provocation tests; this group was denoted as the GHD group. The second group consisted of 15 healthy children with normal height, weight, and GH level, matched for sex and age with the first group; this group was denoted as the HC group.
Participants were excluded according to the following criteria: (1) brain structural abnormalities related to GHD found on MRI; (2) abnormal thyroid hormone axis or multiple pituitary hormone deficiency; and (3) chronic liver or kidney disease, skeletal system disease, congenital heart disease, chromosomal abnormality, history of mental illness, or history of epilepsy.
Data acquisition
Imaging data of all participants were acquired using the 3.0-T MRI system (Discovery MR750; GE Medical, Milwaukee, WI). The echo-planar imaging (EPI) sequence is used to acquire functional data. The following scanning parameters were used for each participant: repetition time (TR) = 2000 msec, echo time (TE) = 30 msec, flip angle = 90°, slice number = 44 with no gap, slice thickness = 3.2 mm, matrix size = 64 × 64, field of view (FOV) = 220 × 220 mm2, voxel size = 3.44 × 3.44 × 3.2 mm3, and number of total volumes = 210.
High-resolution, T1-weighted anatomical images were acquired using the following fast-spoiled gradient echo sequence parameters: TR/TE = 6.79/3.04 msec, flip angle = 12°, slice number = 192, slice spacing = 1 mm, thickness = 1 mm, FOV = 256 × 256 mm2, and voxel size = 0.84 × 0.84 × 1 mm3.
Data preprocessing
The DPABI toolbox was used for preprocessing of all functional image data. Data preprocessing mainly includes the following steps. First, to ensure steady-state longitudinal magnetization and stabilization of participant status, the first ten volumes were excluded. Second, the slice-time differences of fMRI images were corrected. Then, motion corrections were carried out.
No subjects were removed due to excessive head movement (translation parameter >3 mm or rotation parameter >3°). The fMRI images were normalized to the Montreal Neurological Institute (MNI) space using the EPI template and resampled to 3 × 3 × 3 mm3 voxels. Finally, the normalized images were spatially smoothed with a full width at half maximum (FWHM) of 4 mm (Fu et al., 2015; Zhang et al., 2021a; Zhang et al., 2021b).
Group ICA and identification of RSNs
ICA, a generally used data-driven approach in fMRI data processing, can extract independent components (ICs) from mixed fMRI data (Calhoun and de Lacy, 2017). ICA was performed to identify ICs using the Group ICA of fMRI Toolbox. The number of ICs estimated by the minimum description length (MDL) criterion for both groups was 58 (Liu et al., 2021).
The infomax algorithm was repeated 100 times in ICASSO to ensure the reliability of ICA (Li et al., 2020). Then, DMN, SN, ECN, LN, SMN, VN, and AN were selected based on the RSN templates obtained from previous studies.
Statistical analysis
The demographic data and clinical variables of each group were assessed with SPSS software. The statistical analysis of all functional imaging data was carried out using the DPABI toolbox. One-sample t-test was performed for RSNs in the GHD and HC groups (p < 0.05, false discovery rate correction) (Liu et al., 2021). For each RSN, the two groups of corrected results were composed to construct a mask. The combined masks were then used to perform a two-sample t-test to compare each RSN among the two groups. Results were corrected using a permutation test based on threshold-free cluster enhancement (TFCE) (Xiong et al., 2020).
In addition, we also collected the FC values of abnormal brain regions and calculated the correlations of these values with clinical measures in the GHD group. The partial correlation coefficient (PCC) was used in the correlation analysis, and the effects of sex, age, and head movement were excluded.
Results
Subject characteristics
Demographic and clinical characteristics are exhibited in Table 1. There were no significant differences in age, sex, or body–mass index (BMI) between the GHD group and HC group. Children in the HC group had significantly higher measurements for height and weight than children in the GHD group. Insulin-like growth factor 1 (IGF-1), adrenocorticotropic hormone (ACTH), and free triiodothyronine (FT3) were all within normal levels in the GHD group.
Demographic and Clinical Characteristics of Children in the Growth Hormone Deficiency and Healthy Control Groups
Data are expressed as mean ± SD.
p-Value was determined using the two-tailed Mann–Whitney U test.
p-Value was determined using the two-tailed Fisher's exact test.
p-Value was determined using the two-sample two-tailed t-test.
ACTH, adrenocorticotropic hormone; BMI, body–mass index; FT3, free triiodothyronine; GH, growth hormone; GHD, growth hormone deficiency; HC, healthy control; IGF-1, insulin-like growth factor 1; SD, standard deviation.
RSN extraction
We identified seven RSNs from the rs-fMRI data of the GHD and HC groups. The spatial distributions of RSNs are exhibited in Figure 1, which are in accordance with the spatial distributions of RSNs found in previous studies (Damoiseaux et al., 2006; Ding et al., 2011; Shirer et al., 2012).

The spatial distributions of RSNs in children in the GHD and HC groups (FDR correction, p < 0.05). The color scale shows the t-value for each network. FDR, false discovery rate; GHD, growth hormone deficiency; HC, healthy control; RSN, resting-state network.
Differences within the RSN
The results of the two-sample t-test showed that the FC strength was significantly different between the two groups in the DMN, SN, SMN, and LN (Fig. 2 and Table 2), whereas the FC strength was not significantly different between the two groups in the VN, AN, or ECN (p < 0.05, permutation test based on TFCE).

Statistical differences in RSNs between children in the GHD and HC groups (p < 0.05, permutation test based on TFCE). The hot color indicates a significant increase and cold color indicates a significant decrease in the GHD group compared with the HC group. L, left; R, right; TFCE, threshold-free cluster enhancement.
Brain Regions with Significant Differences Between the Growth Hormone Deficiency and Healthy Control Groups
The threshold of statistical significance is p < 0.05 (permutation test based on TFCE).
a, anterior; ACG, anterior cingulate gyrus; CUN, cuneus; DMN, default mode network; INS, insula; IPG, inferior parietal gyrus; L, left; MNI, Montreal Neurological Institute; MOG, middle occipital gyrus; MTG, middle temporal gyrus; ORBinf, orbital inferior frontal gyrus; p, posterior; PCUN, precuneus; SFGmed, medial superior frontal gyrus; SMG, supramarginal gyrus; PoCG, postcentral gyrus; PreCG, precentral gyrus; R, right; SMA, supplementary motor area; SMN, sensorimotor network; SN, salience network; TFCE, threshold-free cluster enhancement.
Regarding the DMN, the bilateral anterior cingulate gyrus (ACG) and bilateral medial superior frontal gyrus (SFGmed) showed significantly increased FC strength in the GHD group compared with the HC group, whereas the bilateral precuneus (PCUN), right cuneus (CUN), and right middle occipital gyrus (MOG) showed significantly decreased FC strength.
Regarding the SN, the bilateral anterior supramarginal gyrus (SMG), left anterior inferior parietal gyrus (IPG), and right insula (INS) showed significantly decreased FC strength in the GHD group compared with the HC group, whereas the bilateral posterior SMG and left posterior IPG showed significantly increased FC strength. Regarding the LN, the left orbital inferior frontal gyrus (ORBinf) and middle temporal gyrus (MTG) showed significantly decreased FC strength in the GHD group compared with the HC group.
Regarding the SMN, the right precentral gyrus (PreCG) and right postcentral gyrus (PoCG) showed significantly increased FC strength in the GHD group compared with the HC group, whereas the left PreCG, left PoCG, and right supplementary motor area (SMA) showed significantly decreased FC strength.
Correlation analysis
For the GHD group, we calculated correlations among FC values in abnormal brain regions and clinical measures (ACTH, IGF-1, BMI, and GH). As exhibited in Figure 3, within the SN, the FC value of the left anterior IPG was positively correlated with the IGF-1 score (PCC = −0.464, p = 0.026) and the FC value of the right posterior SMG was negatively correlated with the ACTH score (PCC = −0.635, p = 0.001).
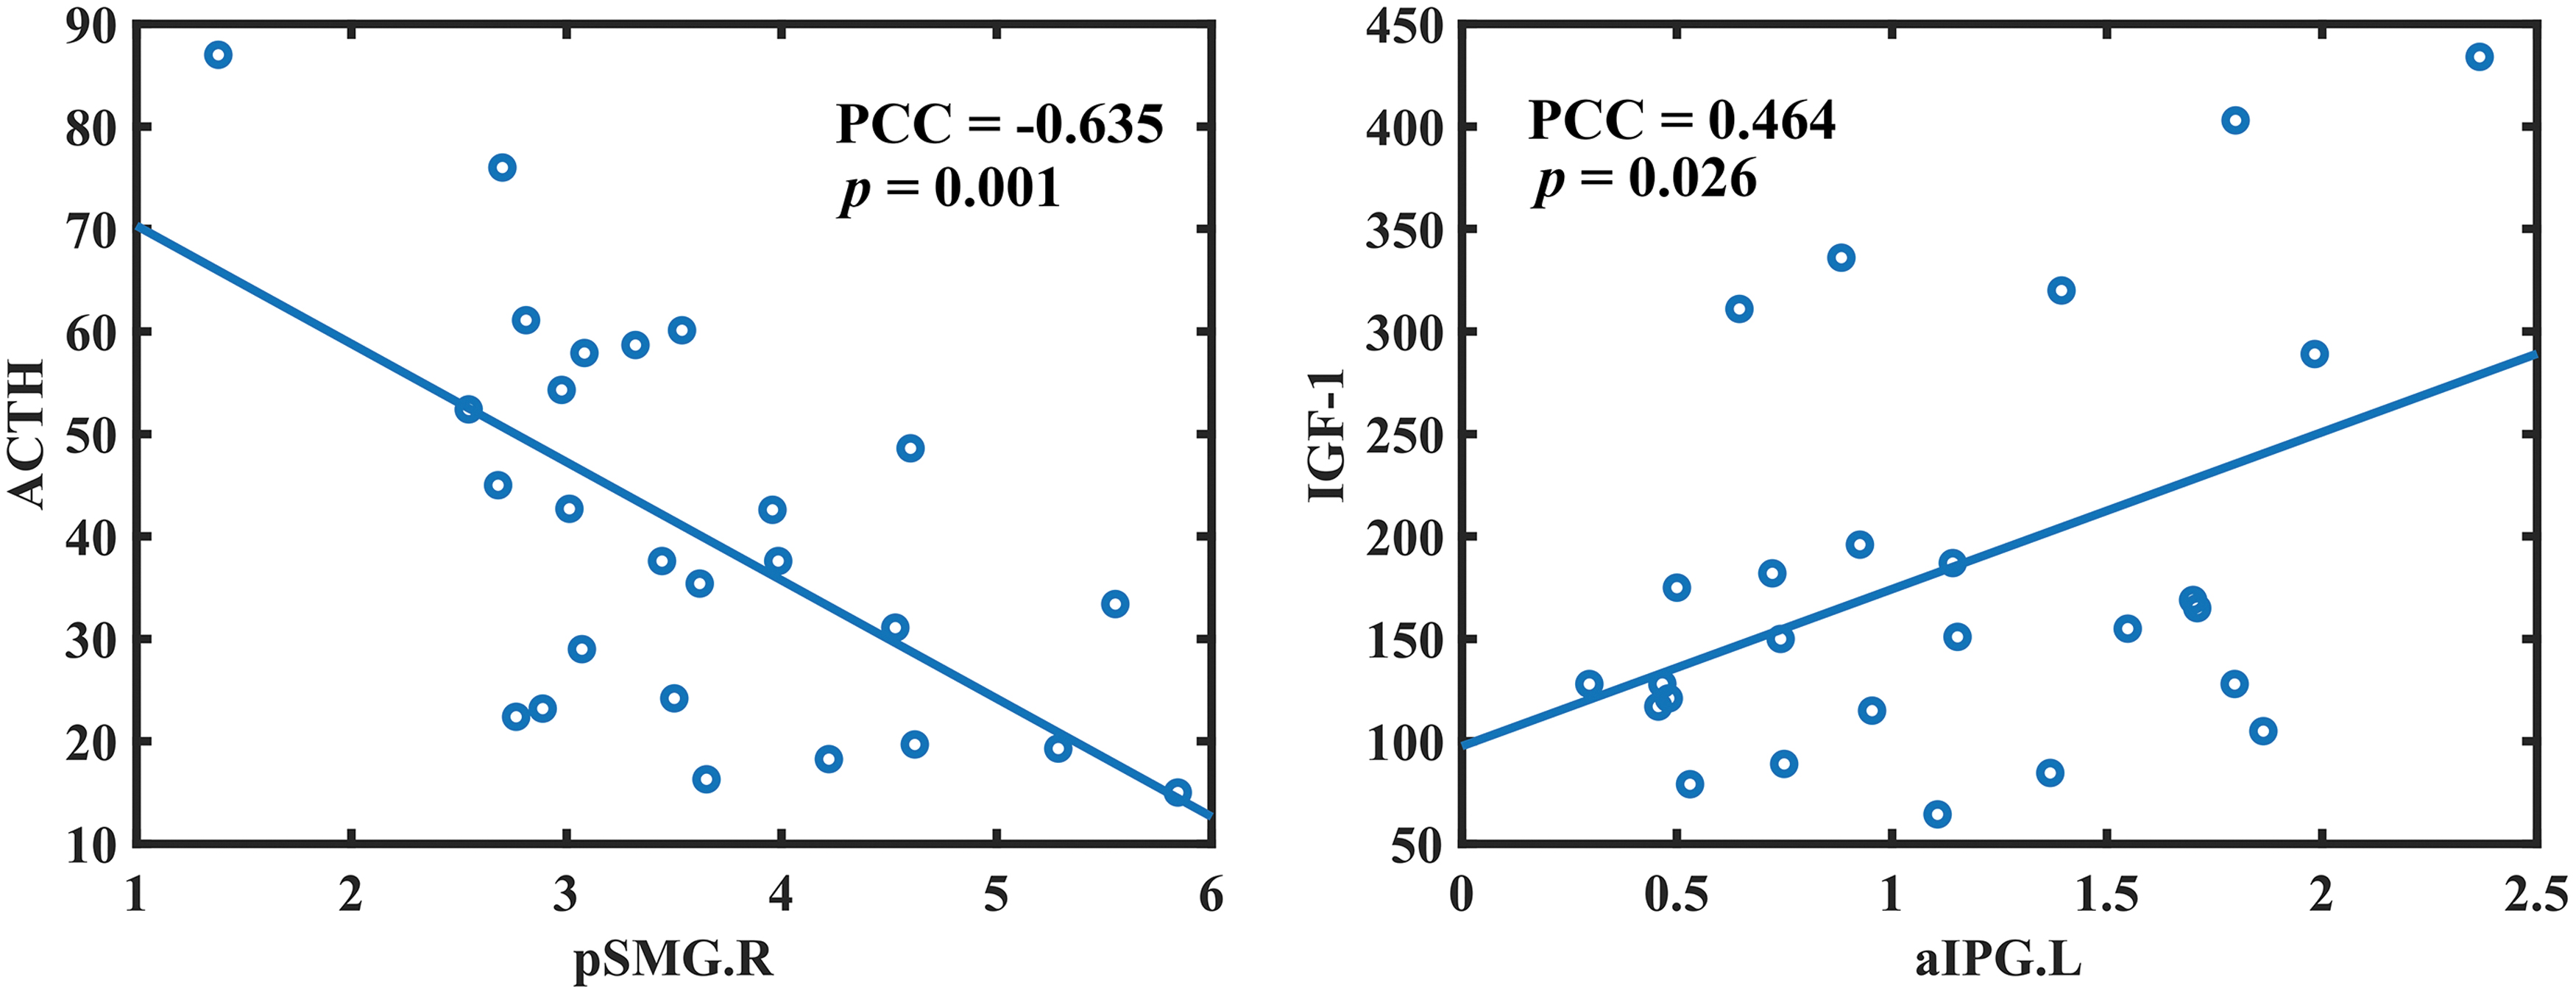
Correlations between clinical measures and abnormal functional connectivity within the network in children with GHD. ACTH, adrenocorticotropic hormone; aIPG.L, left anterior inferior parietal gyrus; IGF-1, insulin-like growth factor-1; PCC, partial correlation coefficient; pSMG.R, right posterior supramarginal gyrus.
Discussion
In this study, we explored the alterations of RSNs in the GHD children at rest. Using ICA, we extracted seven common RSNs from the rs-fMRI data of the GHD and HC groups. Some significant differences were found in the DMN, SN, LN, and SMN of the GHD and HC groups. These results supported our hypothesis that alterations of RSNs exist in children with GHD.
Altered FC within the DMN
Our results showed that the FC values for bilateral ACG and bilateral SFGmed were significantly increased in the GHD group, whereas the FC values for bilateral PCUN, right CUN, and right MOG were significantly decreased. Studies have found that psychopaths lack normal activation in the ACG, INS, and orbitofrontal cortex, and individuals with social phobia show hyperactivation of these regions (Stevens et al., 2011).
PCUN and CUN are involved in relatively low metabolism of patients with mild cognitive impairment (Mattioli et al., 2021). Thus, decreased activity of the bilateral PCUN and right CUN may indicate cognitive decline in children with GHD (Falleti et al., 2006; Maruff and Falleti, 2005), and increased activity of the bilateral ACG may indicate social phobia in children with GHD (Stabler et al., 1996). The medial prefrontal cortex (mPFC) includes the SFGmed (Lemogne et al., 2012), which affects emotion regulation and cognition (Xu et al., 2019).
Yoshimura et al. (2010) found that activation of the mPFC was significantly increased during self-negative condition in depressed patients and the degree of activity was related to the severity of depression. Zhang et al. (2016) found increased spontaneous neural activity in the mPFC of female patients with major depressive disorder (MDD). In addition, ALFF of the occipital cortex was also found to be decreased in MDD patients (Guo et al., 2012).
Therefore, decreased activity in MOG and increased activity in SFGmed may indicate depression in children with GHD, which may explain the presence of depression in patients with GHD (Stabler et al., 1998; Stabler et al., 1996).
Altered FC within the LN
The functional connection reduction within the LN is mainly concentrated in the left ORBinf and MTG. ORBinf is part of the inferior frontal gyrus (IFG), an important area for speech production and name extraction (Rivas-Fernández et al., 2021). The MTG is considered to be correlated with semantic processing (Davey et al., 2016). Therefore, according to the decreased activity of the left ORBinf and left MTG, we speculate that children with GHD have abnormalities in language processing, which is basically consistent with earlier research findings (Zhang et al., 2021b).
Altered FC within the SN
Compared with the HC group, FC values for the bilateral anterior SMG, left anterior IPG, and right INS were significantly decreased in the GHD group, whereas those for the bilateral posterior SMG and left posterior IPG were significantly increased. The IPG and SMG belong to the Wernicke area (Bogen and Bogen, 1976), which handles phonological retrieval and is related to the speech production task (Binder, 2015). Studies have found that the anterior SMG shows stronger activation for pseudoword reading and object naming and the posterior SMG is more responsive to production of words during speech generation tasks (Oberhuber et al., 2016).
Therefore, based on bilateral SMG and left IPG abnormalities and the results of the LN, we speculate that this may reflect abnormal language function in children with GHD. In the correlation analysis results, the right posterior SMG was negatively correlated with ACTH, which may indicate that activation of SMG inhibits secretion of ACTH. The left anterior IPG was positively correlated with IGF-1, which may indicate that the IGF-1 level is consistent with IPG activities.
The INS participates in emotional and sensory processing and higher cognitive activities (Uddin et al., 2017). An investigation of Parkinson's disease revealed decreased FC of the INS in Parkinson's disease patients with depression (Huang et al., 2020). This may explain the depression observed in children with GHD (Stabler et al., 1998).
Altered FC within the SMN
Within SMN, the FC strength values of the right PreCG and right PoCG were significantly increased, whereas the FC strength values of the left PreCG, left PoCG, and right SMA were significantly decreased. The PreCG is responsible for somatic movement, and the PoCG is responsible for somatosensory processing (Baldo et al., 2011; Corkin et al., 1970). Damage to the SMA will affect the movement of the body (Nelson et al., 2002).
Decreases in FC values for the left PreCG, PoCG, and right SMA may indicate decreased sensorimotor function in children with GHD and increases in the right PreCG and PoCG may demonstrate compensatory mechanisms in the early phases of the GHD. This may provide evidence explaining declining motor assessment scores in children with GHD (Webb et al., 2012).
To explain our findings, there are some limitations to be addressed in this study. First, the samples used in this study are not large enough, so the findings need to be validated in a study with a larger number of samples.
Second, clinical cognition and behavior scales of subjects were not collected. Nonetheless, our findings may explain changes in cognition and behavior in children with GHD based on previous research. In subsequent studies, it will be meaningful to investigate the associations between our findings and clinical scales to better explain the effect of GHD on patient's behavior and cognition.
Third, this study only explored changes within RSNs, not between RSNs. In future studies, it is necessary to explore the changes between RSNs in children with GHD.
Conclusions
The current study explored changes in seven RSNs between the GHD group and HC group. Our results showed that the SN, DMN, LN, and SMN exhibited alterations in children with GHD, which confirmed our hypothesis that RSNs might be altered in children with GHD. This current study suggests that alterations in the RSNs of children with GHD may reflect abnormal cognition and behavior, and results provide neuroimaging support for the pathophysiological mechanisms of GHD in children.
Footnotes
Authors' Contributions
J.-R.D. was involved in conceptualization; methodology; validation; writing—original draft; writing—review and editing; funding acquisition; supervision; and project administration. C.F. was involved in conceptualization; methodology; validation; formal analysis; writing—original draft; writing—review and editing; and visualization. H.Z. and Y.L. were involved in methodology; writing—original draft; and visualization. Z.T. and Q.C. were involved in formal analysis and writing—original draft. X.D. was involved in writing—original draft; funding acquisition; and project administration. M.W. was involved in writing—original draft; investigation; and resources. Z.D. was involved in writing—original draft; investigation; resources; data curation; supervision; and project administration.
Author Disclosure Statement
The authors declare that they have no conflicts of interest.
Funding Information
This work was supported by the National Natural Science Foundation of China (No. 81401482); the Research Foundation of Artificial Intelligence Key Laboratory of Sichuan Province (No. 2021RYJ08); the Science and Technology Department of Sichuan Province (No. 2020YJ0176); and the Science Medical Association of Sichuan Province (No. S19082).