
Abstract
Background:
The treatment of depressive episodes is well established, with clearly demonstrated effectiveness of antidepressants and psychotherapies. However, more than one-third of depressed patients do not respond to treatment. Identifying the brain structural basis of treatment-resistant depression could prevent useless pharmacological prescriptions, adverse events, and lost therapeutic opportunities.
Methods:
Using diffusion magnetic resonance imaging, we performed structural connectivity analyses on a cohort of 154 patients with mood disorder (MD) and 77 sex- and age-matched healthy control (HC) participants. To assess illness improvement, the patients with MD went through two clinical interviews at baseline and at 6-month follow-up and were classified based on the Clinical Global Impression-Improvement score into improved or not-improved (NI). First, the threshold-free network-based statistics (NBS) was conducted to measure the differences in regional network architecture. Second, nonparametric permutations tests were performed on topological metrics based on graph theory to examine differences in connectome organization.
Results:
The threshold-free NBS revealed impaired connections involving regions of the basal ganglia in patients with MD compared with HC. Significant increase of local efficiency and clustering coefficient was found in the lingual gyrus, insula, and amygdala in the MD group. Compared with the NI, the improved displayed significantly reduced network integration and segregation, predominately in the default-mode regions, including the precuneus, middle temporal lobe, and rostral anterior cingulate.
Conclusions:
This study highlights the involvement of regions belonging to the basal ganglia, the fronto-limbic network, and the default mode network, leading to a better understanding of MD disease and its unfavorable outcome.
Impact Statement
Different treatments have been developed for patients suffering from mood disorder (MD). Yet, more than one-third of depressed patients do not respond to them. The present study provides statistical analysis of brain structural networks using the threshold-free network-based statistics and graph theoretical approaches based on a large cohort of patients with MD. This enabled the identification of salient regions involved in MD and the process of treatment-resistant depression. Some of the findings are coherent with the results based on functional connectivity, which strengthens the motivation to jointly study both structural and functional connectivity.
Introduction
Mood disorder (MD) is a mental health condition, with occurrences of depressive episodes that impact nearly all aspects of a person’s daily life (Corponi et al., 2020). Despite the improvement and increased availability of treatments since the 1980s, no decrease of depressive episodes or prevalence has been reported (Ormel et al., 2022). The emergence of the COVID-19 pandemic even contributed to a 25% increase in the global prevalence of depression in 2020 according to the World Health Organization. Previous studies have shown that only 40–60% of patients with major depressive disorder (MDD) respond to their first-line treatment (Carvalho et al., 2007; Gartlehner et al., 2011; Trivedi et al., 2006) and that the remission rate with standard antidepressant treatments reaches 30–40% (Rush et al., 2006). A lack of appropriate treatment could lead to increased duration of symptoms, greater risk of suicide, and trial-and-error pharmacological prescriptions strategy, which might be responsible for adverse events and induce increased chronicity. It is, therefore, crucial to identify markers that would help identify individuals at the risk of pharmacological resistance and opt for alternative therapeutic strategies.
Over the past 20 years, magnetic resonance imaging (MRI) has played an important role in deciphering the pathophysiology of MDD (Zhuo et al., 2019). Some MDD studies found widespread gray matter changes in the frontal lobe and the hippocampus (Arnone et al., 2012; Zou et al., 2010), as well as volume reductions in prefrontal and anterior cingulate cortices and also in the basal ganglia (caudate, putamen, and globus pallidus) (Bora et al., 2012). Other findings highlighted key regions involved in emotional processing like the amygdala (Sandu et al., 2017), insula (Johnston et al., 2015), or thalamus (Batail et al., 2020) in treatment-resistant depression (TRD). Besides volumetric MRI analysis, other works have investigated the brain structural connectivity in MDD, especially with the emergence of advanced neuroimaging technics such as diffusion-weighted imaging (DWI). Numerous DWI studies revealed significant white matter modifications, such as decreased fractional anisotropy (FA) in the corpus callosum, bilateral anterior limb of the internal capsule, and the superior longitudinal fasciculus (Ota et al., 2015), suggesting a dysfunction in cortical–subcortical pathways (Coloigner et al., 2019; van Velzen et al., 2020). Previous diffusion tensor imaging (DTI) studies also reported decreased white matter integrity in subcortical regions including the thalamus, caudate, and putamen in patients with late-life depression (LLD) (Alexopoulos et al., 2009; Yuan et al., 2007). More recently, a review focusing on functional and structural connectivity in patients with MDD under treatment found modified FA in the white matter tracts of multiple regions, such as the hippocampus, raphe nucleus, or amygdala in treatment responders compared with nonresponders. Alterations in other DTI parameters, namely, the axial diffusivity and radial diffusivity, were also associated with the clinical response in white matter tracts (Tura and Goya-Maldonado, 2023). In these articles, voxel-wise combined with mass-univariate linear analyses were key in identifying these regions. Here, we propose to extend these methods by performing a connectomics analysis (Hagmann et al., 2007) in order to highlight the disrupted network connections in depression.
Recently, graph theoretical approaches have been increasingly used to study cerebral networks. This framework usually models the brain as a complex graph composed of nodes associated with regions of interest (ROIs) and connections representing the density of white matter tracts connecting cortical and subcortical regional nodes (Bullmore and Bassett, 2011). By mapping the whole brain as an interconnected network, one can conduct statistical analyses on both connections and nodes to unravel the human connectome. On the one hand, the network-based statistic (NBS) has been widely used in the last decade to examine variations on connections, as it controls the family-wise error (FWE) by hypothesizing that altered edges form connected components (Zalesky et al., 2010). However, its statistical properties have been questioned because of the necessity of relying on an arbitrary threshold in the first step of the algorithm. More recently, the threshold-free cluster network-based statistics (TFNBS), based on the NBS, was designed to remove this prior parameter by using multiple thresholding steps, while maintaining statistical power at least comparable to that of the NBS (Baggio et al., 2018). On the other hand, graph theory is also increasingly considered to perform analyses on nodes as it can be used to compute topological metrics. They quantify aspects of integration and segregation in order to detect differences in connectome organization (Rubinov and Sporns, 2010).
With these advances in graph theoretical approaches, several studies used such innovative yet validated connectomics technics described previously in order to find biomarkers of MDD and TRD (Korgaonkar et al., 2020; Korgaonkar et al., 2014; Yun and Kim, 2021). A recent study assessed network differences in functional connectivity to identify connectomic predictors of treatment response using the NBS (Korgaonkar et al., 2020). In this work, a connectomic signature characterized by an elevated intra-network intrinsic functional connectivity was identified within the default mode, fronto-parietal, and somatomotor brain networks. Using graph theory, another functional study reported an increase in degree centrality (number of links held by each node) and local efficiency (measure of local network connectivity) in regions mostly belonging to the default mode network (DMN) in patients with MDD compared with healthy controls (HC) (Ye et al., 2015). In functional brain networks, high degree centrality suggests a topological reorganization of nodes around central hubs, whereas high local efficiency is indicative of segregated neural processing (Rubinov and Sporns, 2010). Graph metrics also displayed significant differences in structural connectivity as illustrated by higher nodal efficiency in the thalamus, inferior-middle-superior temporal gyri, and lingual gyrus in patients with MDD compared with HC (Yun and Kim, 2021; Zheng et al., 2019) but lower nodal efficiency in the thalamus, putamen, and caudate nucleus in patients with remitted LLD compared with HC (Wang et al., 2020) The changes in regions of the basal ganglia, in volumetric, DWI, or structural connectome studies, highlight the role that these structures play in the patterns of depressive symptoms (Lafer et al., 1997). In fact, the basal ganglia have long been studied in patients with MD mainly because of its role in motor response, response to reward, and in motivation (Macpherson and Hikida, 2019). Thus, its investigation remains a key concern with regard to the pathogenesis and the clinical management of depressive disorders, especially in a context with more advanced technics in brain imaging.
Yet, despite all these findings, some studies revealed that graph metrics were not significantly different between structural connectomes of patients with MDD and HC (Korgaonkar et al., 2014; Liu et al., 2018; Xu et al., 2021) or within the patients with MDD with different disease statuses (acute, partial remission, and full remission) (Repple et al., 2020). This suggests that there is no strict consensus on the brain regions involved in MD, and studying whole-brain structural connectivity is thus necessary to capture patterns of MD.
In this article, based on the literature, we hypothesized that the brain regions belonging to the basal ganglia and the fronto-limbic network would likely characterize patients with MD versus HC, whereas those from the DMN would be a marker of treatment resistance at 6-month follow-up in our sample. To assess the network modifications, we conducted statistical connection-wise and node-wise analyses to estimate structural patterns of MD and its unfavorable outcome. We performed the TFNBS on structural graphs and permutation tests on topological metrics, based on a large cohort of patients with MD compared with HC. Some of the patients were followed over 6 months to study illness improvement and were thus defined as improved (I) or not-improved (NI). Therefore, we also examined whole-brain connectomics between the I and NI groups with these methods.
Materials and Methods
Participants and study design
This prospective cross-sectional cohort study included 154 patients with MD. They were recruited from routine care units in the psychiatric university hospital of Rennes between November 2014 and January 2017. Prior to enrollment, all patients were informed of the study’s complete description, and their written informed consent was obtained. The study was approved by Rennes University Hospital ethics committee and is registered at https://www.clinicaltrials.gov (NCT02286024). The patients suffered from MD, and all of them were experiencing a major depressive episode according to the Diagnostic and Statistical Manual of Mental Disorders, Fifth Edition (DSM-5) criteria (Montgomery and Åsberg Depression Rating Scale [MADRS] [Montgomery and Åsberg, 1979]
Intergroup Comparison of Demographic and Clinical Characteristics of the Mood Disorder, Improved and Not-Improved Groups at Baseline
Mann–Whitney U test.
Chi-square test.
Fisher test.
t-test.
AES, apathy evaluation score; MADRS, Montgomery and Åsberg Depression Rating Scale; MD, mood disorder; NI, not-improved; PTSD, post-traumatic stress disorder; SD, standard deviation; SHAPS, Snaith Hamilton Pleasure Scale; STAI, State Trait Anxiety Inventory.
In addition, 77 sex- and age-matched HC with no psychiatric disorders were recruited. The same MRI sequences were performed as for the patients.
Clinical assessment
All patients were assessed once at baseline and a subset of them at 6-month follow-up (n = 69) by a trained senior psychiatrist. The Clinical Global Impression-Improvement (CGI-I) scale was used to measure treatment response (Guy, 1976), considering the patient’s history, social circumstances, symptoms, and the impact of the illness on the patient’s ability to function (Busner and Targum, 2007). The CGI-I item has been repeatedly reported as a suitable scale for everyday clinic practice. It has been validated and well correlated with other standard scales such as MADRS clinician rating scale (Busner and Targum, 2007; Min et al., 2012; Mohebbi et al., 2018). A meta-analysis has shown it to be reliable (Spielmans and Mcfall, 2006), and other authors pointed out that it was a good predictor of the long-term outcome of depression (Simon, 2000). Based on previous studies (Leucht et al., 2013; Min et al., 2012), the I and NI groups were created by cutting off the CGI-I score at 2. Patients with a score of 1 or 2 were considered as I (i.e., very much improved or much improved), whereas those with a score of 3–7 were considered as NI, resulting in 36 I and 33 NI. The 6-month timescale was chosen because it corresponds to the median duration of a mood depressive episode (Have et al., 2017). In addition, other clinical scales were assessed: Clinical Global Impression-Severity (CGI-S) (Busner and Targum, 2007) and MADRS to measure depression severity, State Trait Anxiety Inventory A and B (Spielberger, 1970) to measure state and trait anxiety, Snaith Hamilton Pleasure Scale (Snaith et al., 1995) to measure anhedonia, and Apathy Evaluation Scale (Marin et al., 1991) to measure apathy.
The treatments received by the patients at baseline and at 6-month follow-up are described in Supplementary Table S3.
MRI acquisition
MRI was carried out on the subjects within 5 days after clinical assessment on a 3T whole-body Siemens MR scanner (Magnetom Verio, Siemens Healthcare, Erlangen, Germany) with a 32-channel head coil. The 3D T1-weighted image was acquired using the following parameters: TR = 1.9 s, TE = 2.26 ms, flip angle = 9°, in-plane resolution = 2
DWI was acquired on 60 slices using an interleaved slice acquisition with the following parameters: slice thickness of 2 mm without gap, in-plane resolution = 1
Data preprocessing
The diffusion-weighted images were preprocessed using the open-source medical image processing toolbox Anima (https://anima.irisa.fr), including the following steps: The DWI images were corrected for eddy currents by registering linearly and then nonlinearly each subvolume of the EPI series to the first subvolume, ensuring an opposite symmetric transformation (Hédouin et al., 2017). Rigid realignment was performed to correct for subject motion. EPI distortion correction of the images was performed using the reversed gradient method (Voss et al., 2006), coupled with a symmetric block-matching distortion correction method (Hédouin et al., 2017). Denoising was handled using blockwise nonlocal means filtering (Coupe et al., 2008). Skull stripping was performed using an atlas-registration-based method by transforming the structural image of each patient to the atlas image, using the linear and nonlinear block-matching algorithms (Commowick et al., 2012a; Ourselin et al., 2000). Diffusion tensor estimation was performed using a log-Euclidean estimation method (Fillard et al., 2007). Whole-brain white-matter tractography was achieved using fiber assignment by continuous tracking (FACT) method (Mori et al., 1999).
The T1-weighted images were coregistered to the b = 0 images in the DWI space (Commowick et al., 2012b). Finally, the parcellation of the cerebral cortex of each participant into 80 ROI, including 66 cortical and 14 subcortical regions, was performed using FreeSurfer (Dale et al., 1999).
Brain network construction and graph metrics
Connectivity matrices were constructed using the parcellation mentioned previously. The connections between two regions i and j were obtained by calculating the total number of fiber tracts connecting i and j and normalizing them by the mean volume of those two regions. Those connections were further thresholded to include only links found in at least 70% of participants, in order to suppress false-positive fibers arising from tractography errors (Maier-Hein et al., 2017).
Graph metrics were then computed on undirected weighted matrices to examine changes in network structure (e.g., reflecting segregation and integration). The following global graph metrics were calculated: (1) characteristic path length, which is computed as the average number of edges in the shortest path between all pairs of nodes in the graph; (2) global clustering coefficient, which is the ratio of the number of triangles (set of three different nodes where each node is connected to the other two) to the number of connected triplets (set of three nodes where consecutive nodes are connected to each other); and (3) global efficiency, which reflects the capacity for network-wide communication, computed as the inverse of the average characteristic path length between all nodes. To describe each region individually, the following local graph metrics were also considered: (1) clustering coefficient, which is the probability that two neighbors of a given node are also connected to each other; (2) local efficiency, which is the inverse of the shortest average path length of all neighbors of a given node among themselves; (3) degree centrality, which is the number of edges connected to a node; (4) betweenness centrality, which is the fraction of all shortest paths that pass through a given node; (5) participation coefficient, which determines if the edges of a node tend to be clustered into one module of the network or link different other modules, computed as the ratio of the number of edges connecting a given node within its module to its degree; (6) node curvature, which is derived from the concept of graph curvature to analyze brain robustness (Farooq et al., 2019); and (7) strength, which is the sum of the weights of the adjacent edges of a given node.
Statistical analysis
A general linear model was applied to the edges as well as to the global and local metrics to remove the potential effects of age and sex covariates. Global and local properties of the structural brain networks were analyzed using the bctpy toolbox with Python (https://github.com/aestrivex/bctpy). The pipeline of the statistical analysis is summarized with each step detailed in Figure 1.
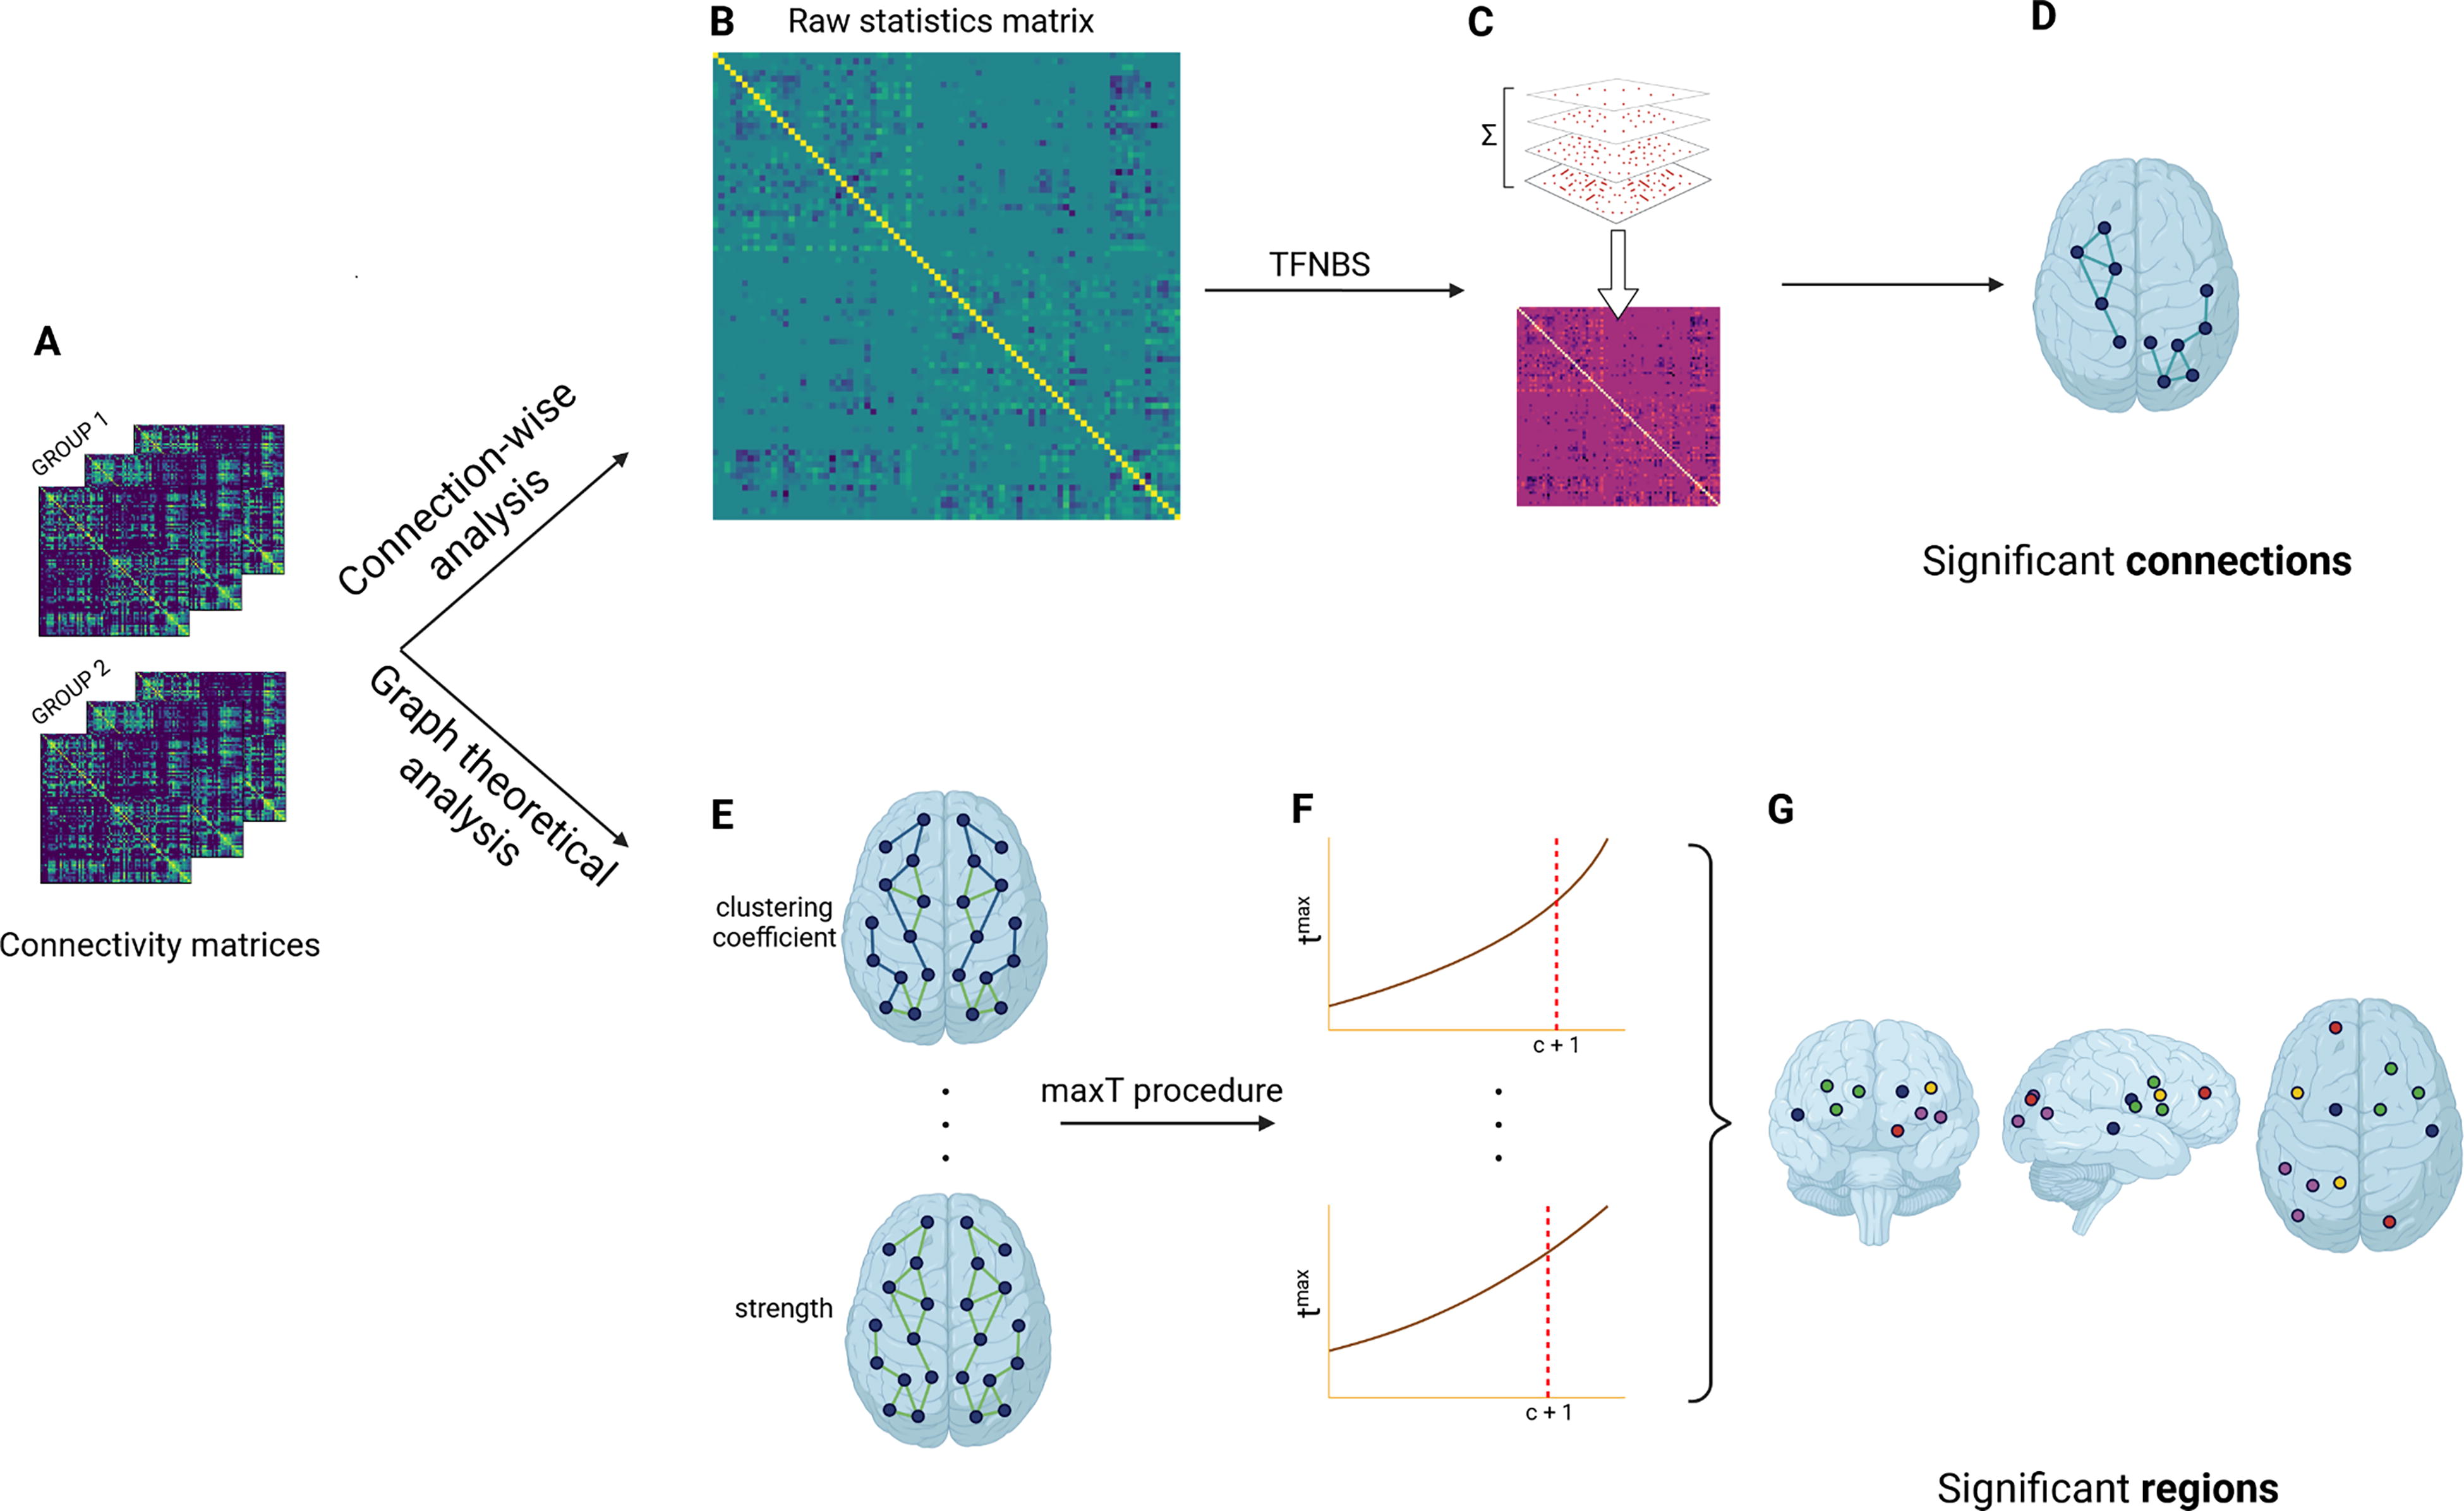
TFNBS
The TFNBS combines the NBS and the threshold-free cluster enhancement algorithm for voxel-wise analysis adapted to graphs. A raw statistics matrix M is first computed by performing t-tests on each connection of the connectivity matrices between the two groups studied, before thresholding it at different steps h with intervals dh. Then, at each threshold h, we find the connected components and count the number of connections e(h) in each of them. Finally, the entries in M are replaced by their TFNBS score, producing the final TFNBS score matrix. The TFNBS score of edge i, j is calculated as follows:
Topological metrics
A t-test was applied for each global metric to examine disruptions in the topological organization of whole-brain networks (p < 0.05). The same test was performed on each region for the local metrics to identify the regions displaying significant differences between the groups. To correct for multiple comparisons, the maxT procedure using nonparametric permutation tests was considered (100,000 permutations) (Westfall and Young, 1993). At each permutation i = 1, …, N, the labels were exchanged randomly between the two groups studied. Then, the maximal statistic over all regions
Results
Demographic and clinical measures
The groups of HC and patients with MD were comparable in terms of age (HC: 48.7
Improved and Not-Improved Description at Baseline and at 6-Month Follow-Up
McNemar test.
Wilcoxon test.
AES, apathy evaluation score; MADRS, Montgomery and Åsberg Depression Rating Scale; PTSD, post-traumatic stress disorder; SD, standard deviation; SHAPS, Snaith Hamilton Pleasure Scale; STAI, State Trait Anxiety Inventory.
Whole-brain mapping of connectivity deficits
Between patients with MD and HC, the TFNBS revealed 15 significant connections including the media orbitofrontal, precuneus, middle temporal, left and right superior parietal, the thalamus of both hemispheres, the hippocampus, the caudate, and the right putamen, as displayed in Figure 2. All these connections were found to exhibit lower connectivity among participants with MD except between the right thalamus and the right caudate. A single edge including the left inferior temporal and the left insula was found between the I and NI groups, showing increased connectivity among the I group (Fig. 2).

Significant connections characterizing mood disorder and treatment-resistance depression using the threshold-free network-based statistics.
Whole-brain differences in topological metrics
Compared with HC, patients with MD showed significantly higher global characteristic path length (p

Regions exhibiting significant differences between the mood disorder and healthy control groups according to the results obtained with the maxT procedure on the topological metrics. L, left; R, right.

Significant regions that characterize differences between improved and not-improved using t-tests on graph metrics at an uncorrected threshold (p
The Topological Measures’ Change Between the Improved and Not-Improved Groups
Up and down arrows indicate significant increased and decreased mean topological metric in the improved group compared with the not-improved group obtained with a two-sample t-test (uncorrected p < 0.05). The acronym NS means no significant differences were found.
BC, betweenness centrality; CC, clustering coefficient; LE, local efficiency; MT, middle temporal; NC, node curvature; PREC, precuneus; RAC, rostral anterior cingulate; ROIs, regions of interest; S, strength.
Discussion
In this study, we identified alterations in the thalamus as well as regions belonging to the basal ganglia, namely the caudate and putamen, which are predominately involved in the limbic–cortical–striatal–pallidal–thalamic network in patients with MD compared with HC. This is in agreement with previous studies that found disruptions in these regions by means of widespread volume reductions in patients with MDD, specifically the bilateral thalamus (Arnone et al., 2016), left putamen, and right caudate (Korgaonkar et al., 2014; Lu et al., 2017). There is growing evidence that dysfunctions in these circuits may regulate the disturbances in autonomic regulation and neuroendocrine responses associated with mood disorders (Herane-Vives et al., 2018; Peng et al., 2013). The identification of such predictors is clinically relevant, as detecting neuroendocrine dysregulation could help clinicians tailor treatments used for depressed patients. Besides, another work highlighted the role of the basal ganglia in cognitive and emotional behaviors, showing that alterations in these networks could lead to depressive disorder (Haber, 2022). In addition, the insula and amygdala were found to display important differences between patients with MD and HC, as well as I and NI. These are the core regions belonging to the fronto-limbic network and are involved in emotion regulation. Indeed, they are part of the salience network (SN), a large-scale brain network known to contribute to many functions such as self-awareness through the integration of sensory, emotional, and cognitive information (Menon, 2015). Hamilton et al. further highlighted the crucial role of this network, suggesting that the occurrence of repetitive, preservative, negative thinking, and biases in attention to negative events may underlie aberrant SN response and connectivity in depression (Hamilton et al., 2013).
The present study investigated the topological organization of structural brain networks in patients with MD compared with HC. The results revealed that patients with MD exhibited increases in both characteristic path length and global clustering coefficient. These metrics are parameters of the small-worldness that reflect the intrinsic principles in a network: integration and segregation (Sporns, 2011). Small-world networks are characterized by high clustering and short path length. Here, the changes in the global metrics indicated significant increases in small-world features in the brain networks of depressed patients, suggesting a less integrated and more segregated organization in the whole-brain networks. Moreover, the local clustering coefficient in patients with MD displayed higher values in important regions such as the lingual gyrus, insula, and amygdala compared with HC. Likewise, the lower global efficiency observed in the MD group is relevant to a disrupted small-world organization. These changes could be associated with a reorganization of the structural brain networks centered around the limbic system or the SN with longer distance connections, suggesting that information transfer is predominant across those networks in depression. This is in agreement with a previous study that identified functional and structural alterations in limbic regions in youth depression, especially in the amygdala (Redlich et al., 2018). Another study associated a stronger clustering coefficient of the right amygdala with higher levels of depression symptom levels and duration of depressive episodes among patients with MDD (Jacob et al., 2022). These findings might reflect the attenuation of positive information contrasted with intensification of affective information, according to cognitive theories of depression (Beck, 2008; Stuhrmann et al., 2013). Such modifications in small-world parameters and network efficiency are also found in other brain diseases, such as epilepsy (van Diessen et al., 2014) or Parkinson’s disease (Pereira et al., 2015), describing widespread changes affecting the whole network and a reorganization of the networks’ hubs in diseases. We also observed increasing local metrics in patients with MD, as measured by local efficiency and betweenness centrality in the right amygdala and the left thalamus, respectively. This is in line with a previous study suggesting that both regions are involved in emotional perception (Ye et al., 2015). Our findings additionally revealed a decrease in degree centrality in the left cuneus and an increase in local efficiency in the right RAC, which have not yet been reported by other DWI studies. Other results reported an increased degree centrality in these regions but in functional connectivity, which may encourage us to further study the relationship between structural and functional connectivity (Ye et al., 2015; Zhang et al., 2011).
Abnormal changes in the DMN connectivity are well established in TRD (Li et al., 2013). Within the network, connectivity changes are deemed as a plausible explanation of brain responses associated with cognitive demands and processing of emotions in depression (Wise et al., 2017). As such, the network has been hypothesized as a predictor to treatment response because of its role in the generation of self-referential processing, negative rumination, emotion regulation, and depressive symptoms (Long et al., 2020; Wise et al., 2017). Compared with the NI group, we found a reduction in local clustering coefficient, efficiency, and strength of the RAC in the I group using graph theoretical analysis. The RAC is a key hub of the DMN, for which previous studies indicated hyperactivation or hyperconnectivity related to depressive symptom improvements in functional connectivity (Gerlach et al., 2022; Jamieson et al., 2022). A study examining electroencephalography (EEG)-based connectivity in theta and beta bands reported that the RAC and the insula were predictors of depression remission (Whitton et al., 2019). Previous studies also suggested that the functional activity of the RAC is a therapeutic target of choice in noninvasive brain stimulation (Weigand et al., 2018) and invasive deep brain stimulation (Mayberg et al., 2005) for TRD. Indeed, numerous studies have investigated the effects of treatment on functional connectivity in the DMN and its relationship with clinical improvement (de Kwaasteniet et al., 2015; Pang et al., 2022). Although these works did not analyze graph metrics, their results might still indicate important regions that characterize response to antidepressants (Chin Fatt et al., 2020; Lui et al., 2011). More specifically, a previous study reported a correlation between increased within-network functional connectivity of lateral DMN regions including the precuneus, superior, and middle temporal cortex and improvement in depression (Kilpatrick et al., 2022). A prior study focusing on LLD reported increased DMN functional connectivity for posterior DMN regions such as the precuneus following antidepressant treatment (Andreescu et al., 2013). Another similar study showed a correlation between increased DMN functional connectivity in lateral DMN regions like the middle temporal gyrus and treatment response to antidepressants (Karim et al., 2017).
To the best of our knowledge, our study is the first to identify the DMN as a key structural hub associated with treatment response over a 6-month follow-up. The present work revealed significant differences in the precuneus, the middle temporal lobe, and the RAC that are part of the DMN. In addition to the literature on functional connectivity patterns of DMN in TRD, our results suggest that white matter integrity might also be a determinant of treatment response. Few studies have investigated the relationship between structural and functional abnormalities associated with depression. One recent meta-analysis has pointed out a negative relationship as illustrated by reduced gray or white matter in the DMN associated to hyperconnectivity within the DMN in depressed patients as compared with HC (Scheepens et al., 2020). With our study, we can hypothesize that treatment response could be associated with both DMN structural and functional connectivity as well. Furthermore, some authors have suggested that functional brain activity (as measured by EEG) may depend on underlying structural integrity (Babaeeghazvini et al., 2021). Based on our work and the literature on DMN functional connectivity in TRD, we could then hypothesize that network structural integrity could be a necessary condition for functional response and, by consequence, clinical improvement. Multimodal studies are warranted to test this dual condition.
There may be some possible limitations in this study. The population was not perfectly equally distributed between women and men, but it remains representative of depression sex ratio as illustrated by a higher prevalence in women (Kessler, 2003). It can be noted that our sample presented some aspects of heterogeneity in terms of clinical profile (bipolar depression and anxiety disorders), which may have limited our statistical power. The presence of comorbidities and medication is also important in this regard. However, our sample is representative of the TRD population (Dudek et al., 2010; Kautzky et al., 2019), which strengthens the generalizability of our findings. This study should be replicated in a larger population of I and NI to assess whether such analysis could provide clearer information on brain changes between these two groups. Another limitation is its cross-sectional design where the brain imaging was performed at a single time point, which precludes causal inferences or capturing progressive changes over time. Thus, it would be interesting to corroborate our findings in longitudinal studies. In the future, it would be helpful to combine multimodal imaging data to study the interaction between functional and structural connectivity as more networks contributing to treatment response such as the DMN might be identified.
Footnotes
Acknowledgments
The authors thank Mr. Stéphane Brousse and Mr. Jacques Soulabaille for their involvement in the conduct of the study.
Authors’ Contributions
S.D.: Conceptualization, formal analysis, methodology, software, visualization, and writing—original draft. J.-M.B.: Data curation, funding acquisition, investigation, resources, validation, and writing—reviewing and editing. G.H.R.: Data curation, investigation, resources, and writing—reviewing and editing. D.D.: Data curation, funding acquisition, investigation, and resources. P.M.: Conceptualization, methodology, project administration, resources, supervision and validation, and writing—reviewing and editing. J.C.: Conceptualization, methodology, project administration, resources, supervision, validation, and writing—reviewing and editing.
Author Disclosure Statement
No competing financial interests exist.
Funding Information
MRI data acquisition was supported by the Neurinfo MRI research facility from the University of Rennes. Neurinfo is granted by the European Union (FEDER), the French State, the Brittany Council, Rennes Metropole, Inria, Inserm and the University Hospital of Rennes.
Supplementary Material
Supplementary Figure S1
Supplementary Figure S2
Supplementary Table S1
Supplementary Table S2
Supplementary Table S3
References
Supplementary Material
Please find the following supplemental material available below.
For Open Access articles published under a Creative Commons License, all supplemental material carries the same license as the article it is associated with.
For non-Open Access articles published, all supplemental material carries a non-exclusive license, and permission requests for re-use of supplemental material or any part of supplemental material shall be sent directly to the copyright owner as specified in the copyright notice associated with the article.