
Abstract
Background:
Balance between brain structure and function is implicated in aging and many brain disorders. This study aimed to investigate the coupling between brain structure and function using 18F-fludeoxyglucose positron emission tomography (PET)/magnetic resonance imaging (MRI).
Methods:
One hundred thirty-eight subjects who underwent brain 18F-FDG PET/MRI were recruited. The structural and functional coupling at the regional level was explored by calculating within-subject Spearman's correlation between glucose metabolism (GluM) and cortical thickness (CTh) across the cortex for each subject, which was then correlated with age to explore its physiological effects. Then, subjects were divided into groups of middle-aged and young adults and older adults (OAs); structural connectivity (SC) based on CTh and functional connectivity (FC) based on GluM were constructed for the two groups, respectively, followed by exploring the connective-level structural and functional coupling on SC and FC matrices. The global and local efficiency values of the brain SC and FC were also evaluated.
Results:
Of the subjects, 97.83% exhibited a significant negative correlation between regional CTh and GluM (r = −0.24 to −0.71, p < 0.05, FDR correction), and this CTh-GluM correlation was negatively correlated with age (R = −0.35, p < 0.001). For connectivity matrices, many regions showed positive correlation between SC and FC, especially in the OA group. Besides, FC exhibited denser connections than SC, resulting in both higher global and local efficiency, but lower global efficiency when the network size was corrected.
Conclusions:
This study found couplings between CTh and GluM at both regional and connective levels, which reflected the aging progress, and might provide new insight into brain disorders.
Impact statement
The intricate interplay between brain structures and functions plays a pivotal role in unraveling the complexities inherent in the aging process and the pathogenesis of neurological disorders. This study revealed that 97.83% subjects showed negative correlation between the brain's regional cortical thickness and glucose metabolism, while at the connective level, many regions showed positive correlations between structural and functional connectivity.
The observed coupling at the regional and connective levels reflected physiological progress, such as aging, and provides insights into the brain mechanisms and potential implications for the diagnosis and treatment of brain disorders.
Introduction
The human brain is an intricately organized system where the structures and functions of different regions work together to accomplish complex tasks. Disruption of the delicate balance between brain structure and function has been proven to be implicated in many brain disorders (Cao et al., 2020; Kuceyeski et al., 2016; Wang et al., 2018; Zhang et al., 2019).
Cortical thickness (CTh) and glucose metabolism (GluM) are two widely used measures to investigate the brain structures and functions. CTh, measured by magnetic resonance imaging (MRI), refers to the distance between two borders of the gray matter; and GluM, measured by 18F-fludeoxyglucose (FDG) positron emission tomography (PET), reflects the functional activity of an organ.
Trajectories of CTh and GluM might not change synchronously during aging or in disease states, as it is reported that aging was negatively correlated with CTh in many cortical regions, but with decreased GluM only in the temporal lobe (Baik et al., 2023). Thus, we would expect that coupling of the two modalities would provide new insight into the underlying neuromechanism.
Large-scale brain networks have emerged as a promising tool to study the brain. In brain network models, nodes correspond to brain regions, whereas edges correspond to connections between the nodes. The structural connectivity (SC) matrix, constructed based on brain CTh, defines anatomical connections between two regions showing statistically significant correlations with CTh. The CTh-based SC matrix provides crucial connective information in the human brain (He et al., 2008; Qi et al., 2016) and is consistent with known neuroanatomical pathways measured by diffusion imaging (He et al., 2007).
On the other hand, the functional connectivity (FC) matrix constructed using 18F-FDG PET images assumes that brain regions with similar metabolic demands are also functionally connected (Horwitz et al., 1984; Macko et al., 1982). Compared with the most widely used BOLD functional MRI (fMRI) connectivity, FC constructed based on GluM in an intersubject way could reveal similar neural networks and provide complementary insight into the neuromechanism (Di et al., 2017).
Previous studies proved that most functional links were not supported by an underlying structural link, and functional communities tend to encompass spatially distributed systems with perceptual, cognitive, and affective relevance, while structural networks tend to be more spatially constrained (Suarez et al., 2020). Such observations highlight the need to consider multimodal brain networks simultaneously.
In the present study, we aimed to investigate the coupling between the human brain CTh and GluM using 18F-FDG PET/MRI. We (1) explored the within-subject regional correlation between CTh and GluM across the cortex, that is, CTh-GluM coupling at the regional level, and whether this coupling reflected physiological progress such as aging; (2) constructed the SC and FC matrices and explored SC-FC correlations, that is, SC-FC coupling at the connective level; and (3) compared the topological properties of the two modal brain connectivity.
Materials and Methods
Experimental subjects
Two hundred one subjects who underwent whole-body and brain 18F-FDG PET/MRI for examination of body disorders between August 2020 and September 2021 in the Department of Nuclear Medicine, Shanghai East Hospital, were retrospectively enrolled. All subjects were clinically evaluated and their whole-body PET/MRI images were reviewed by two nuclear medicine physicians (N.Q. and J.Z). Subjects who had a stroke, major head trauma, neuropsychiatry disorders, brain tumor and body malignancy, uncontrolled diabetes, medicine abuse, or alcohol addiction were excluded, as shown in Figure 1a.
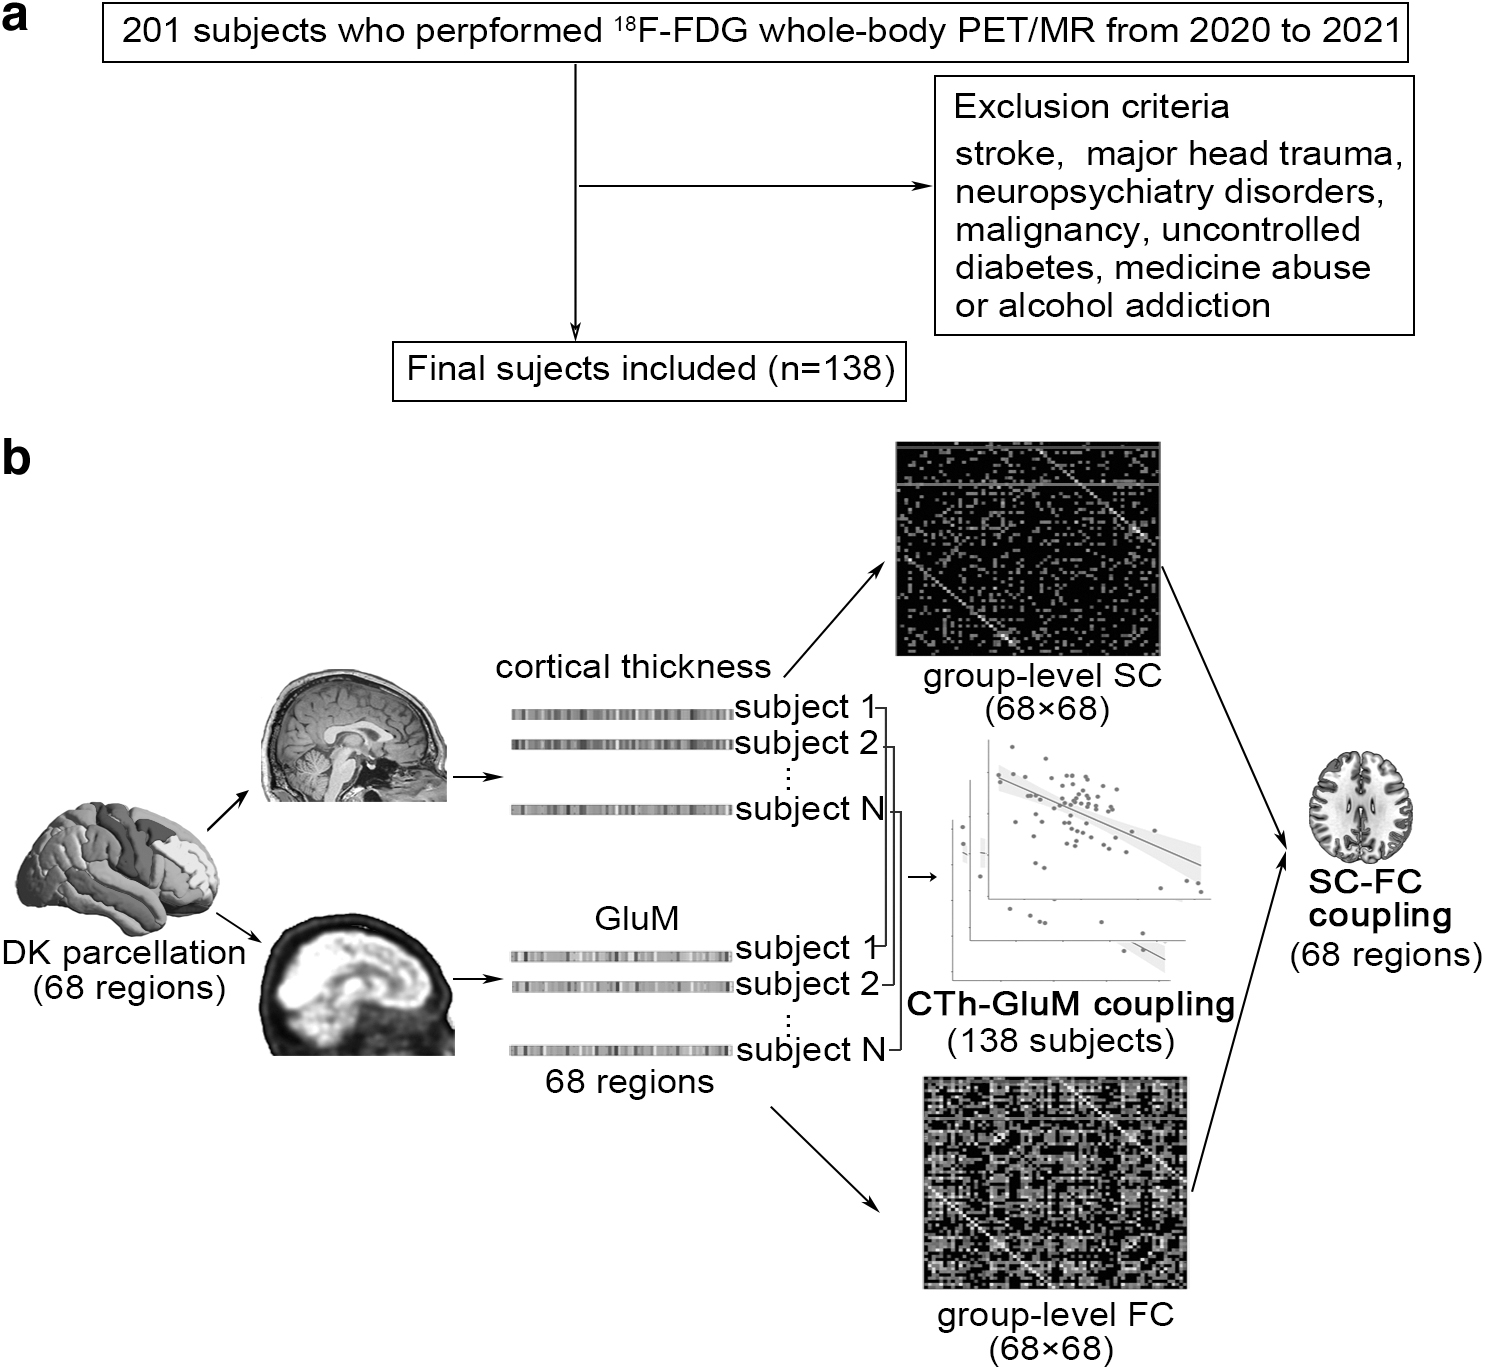
Flowchart for subjects' enrollment
Considering the sample size and sex distribution, 138 subjects were included and divided into two groups according to their age, that is, middle-aged and young adults (MYAs, age <50 years) and older adults (OAs, age ≥55 years). The study was approved by the medical ethics committee of East Hospital, Tongji University, and all participants or their guardians provided informed consent before their inclusion. The study was conducted according to the 1964 Helsinki Declaration and its later amendments or comparable ethical standards.
PET/MR scanning
All subjects underwent whole-body 18F-FDG PET/MR scanning using a uPMR 790 HD TOF PET/MR system (United Imaging Healthcare, Shanghai, China). The subjects fasted for at least 6 h to keep their blood glucose level <6.0 mmol/L before 18F-FDG injection. They were intravenously injected with a dose of ∼5.5 MBq/kg 18F-FDG and rested for about 60 min. Then, a 10-min brain PET was acquired simultaneously with MRI T1 scanning after whole-body PET/MRI.
In addition, no sedation was applied during the whole process. The brain MRI T1 images were acquired using the 3D GRE-fsp (fast spoiled gradient-recalled echo; United Imaging) sequence with the following parameters: echo time = 3 ms, repetition time = 7.19 ms, inverse time = 750 ms, flip angle = 10°, slice thickness = 0.67 mm, spacing between slices = 0.67 mm, data matrix = 264 × 460 × 512 mm, and voxel size = 0.67 × 0.5 × 0.5 mm.
Brain PET images were reconstructed using the OSEM algorithm, with 3 iterations and 20 subsets, followed by the use of a Gaussian filter of 4 mm in full width at half maximum on a 150 × 150 × 159-mm matrix with a 2 × 2 × 2-mm voxel size, and corrected for decay, normalization, photon attenuation, scatter, and random coincidences.
Image preprocessing
All image preprocessing, network analyses, and statistics were performed using MATLAB R2021b. The T1 images were preprocessed using the computational anatomy toolbox (CAT12) with default settings, including skull stripping, denoising, and correction for bias field inhomogeneities.
Then, images were segmented into gray matter, white matter, and cerebrospinal fluid and normalized using the shooting registration algorithm. Volumes were segmented using surface and thickness estimation based on projection-based thickness and export of regional CTh values using the Desikan–Killiany atlas (Desikan et al., 2006).
PET images were preprocessed using SPM12. All images were coregistered to their corresponding T1 image and spatially normalized to the Montreal Neurological Institute space using transformation parameters estimated on the corresponding T1 image. Then, the Desikan–Killiany atlas (Desikan et al., 2006) was applied to segment the cerebral cortex into 68 regions (34 for each hemisphere without the cerebellum), and the mean intensity of each region was extracted.
In addition, regional FDG uptake values were also partial-volume corrected using the geometric transfer matrix correction algorithm (Gonzalez-Escamilla et al., 2017) to exclude the effect of brain atrophy.
Network construction
To eliminate the effect of individual differences among subjects, the mean values of CTh and FDG uptake of each subject were removed by linear regression (Qi et al., 2016). Then, the residuals were used to construct structural and functional networks by calculating Spearman's rank correlation between each pair of brain regions spatially in an intersubject manner, as the data were non-normally distributed.
The spurious connections were excluded with a coefficient threshold of p > 0.05. Finally, we got four 68 × 68 matrices, that is, the group-level structural and functional brain network, for the MYA and OA group. In the network, nodes represent brain regions parcellated from the Desikan–Killiany atlas and the edge is defined as a connection of each pair of nodes, with weight defined as the absolute value of Spearman's correlation coefficient.
Based on the above constructed networks and the hypothesis that structure is the basis of functions, we first explored the similarity between SC and FC matrices by calculating the probability of the existence of functional connection while structurally connected, that is, probability(existenceFC|connectedSC), and the probability of inexistence of FC while being structural disconnected, that is, probability(inexistenceFC|disconnectedSC).
Higher values of probability(existenceFC|connectedSC) and probability(inexistenceFC|disconnectedSC) indicated a higher similarity between the two networks.
Network properties
The network size is reflected by the average network degree (K),
where ki is the sum of the weights attached to node i and N is the number of nodes. The mean network degree is commonly used as a measure of density or the total “wiring cost” of the network.
Global efficiency is a measure of network integration, which is inversely related to path length, and defined as

where
Local efficiency (E loc) is a measure of network segregation and defined as the average nodal efficiency:
where Gi is the subgraph of the neighbors of i. Both global and local efficiency values express the very precise physical meaning of the efficiency of transporting information, including local necessities (fault tolerance) and wide-scope interactions (Latora and Marchiori, 2001).
To exclude the effect of network size on global and local efficiency, the networks were binarized using a set of connective densities from 0.01 to 0.17 with a step of 0.02 to ensure the networks were fully connected. Network efficiencies were calculated again on the binarized network at each density level.
Statistics
CTh-GluM coupling at the regional level
To explore regional structural and functional coupling, we measured the strength of the correlation between the CTh and GluM for each subject by calculating within-subject Spearman's rank correlations between a subject's FDG uptake and CTh values across all cortical ROIs, ending up with correlation estimates for each subject (Whitwell et al., 2018), as shown in Figure 1b.
The statistical significance level was set at p < 0.05, with FDR correction for multiple comparisons (69 comparisons for 69 subjects). Then, Spearman's rank correlation coefficient between this CTh-GluM coupling and age was also calculated to explore its physiological effects.
We also calculated within-subject Spearman's rank correlations between a subject's GluM and CTh value for regions in frontal, parietal, temporal, and occipital lobes to explore whether CTh-GluM coupling showed regional specificity.
SC-FC coupling at the connective level
To explore coupling between SC and FC at the connective level, correlations between the SC and FC matrices were calculated for MYA and OA groups. In brief, each row in the SC matrix, representing a region's SC to the rest of the brain, was correlated through Spearman's rank with the same region's row in the FC matrix, as shown in Figure 1b.
The statistical significance level was set at p < 0.05, with FDR correction for multiple comparisons (68 comparisons for 68 regions). This measure of SC-FC coupling reflects the alignment of a region's functional and structural connectivity profile to every other region in the brain.
A permutation test repeated 10,000 times was performed to compare the statistical difference of SC-FC coupling between MYA and OA groups, as well as network similarities between MYA and OA groups, and network properties between MYA and OA groups or between SC and FC. For each permutation, group labels were randomly assigned to all subjects, and the shuffled subjects were divided into two random groups.
The statistical significance level was set at p < 0.05, with FDR correction for multiple comparisons.
Results
Demographics
Sex distribution between the two groups was not statistically different, and detailed information is provided in Table 1.
Demographics
MYAs, middle-aged and young adults; OAs, older adults; SD, standard deviation.
CTh-GluM coupling at the regional level
The brain CTh and GluM were negatively coupled at the regional level. In detail, 135 of 138 (97.83%) subjects exhibited a significant negative correlation between CTh and GluM (r = −0.71 to −0.24, p < 0.05 with FDR correction), and overall Spearman's rank coefficients ranged from −0.71 (Fig. 2a, d) to −0.11 (Fig. 2c, e), as shown in Figure 2f.

Regional CTh-GluM coupling. Scatter plots of regional GluM and CTh values for two subjects with minimum
We further discovered that this CTh-GluM coupling was negatively correlated with age (R = −0.35, p < 0.001, for the total subjects, as shown in Fig. 2g; R = −0.31, p = 0.01, and R = −0.41, p < 0.001, for MYA and OA groups, respectively), that is, discordancy between the brain structure and function was larger during aging. Those results were also confirmed when the FDG images were partial-volume corrected (R = −0.27, p = 0.002, Supplementary Fig. S1a).
Furthermore, we identified that negative CTh-GluM coupling was mainly derived from temporal and occipital lobes (54.35%, 60.14%, 0%, and 0% of subjects showed significant negative CTh-GluM coupling for temporal, occipital, frontal, and parietal lobes, respectively; Supplementary Fig. S2). In addition, larger discordancy between CTh and GluM during aging was derived from the temporal lobe (R = −0.33, p < 0.001; Supplementary Fig. S2d).
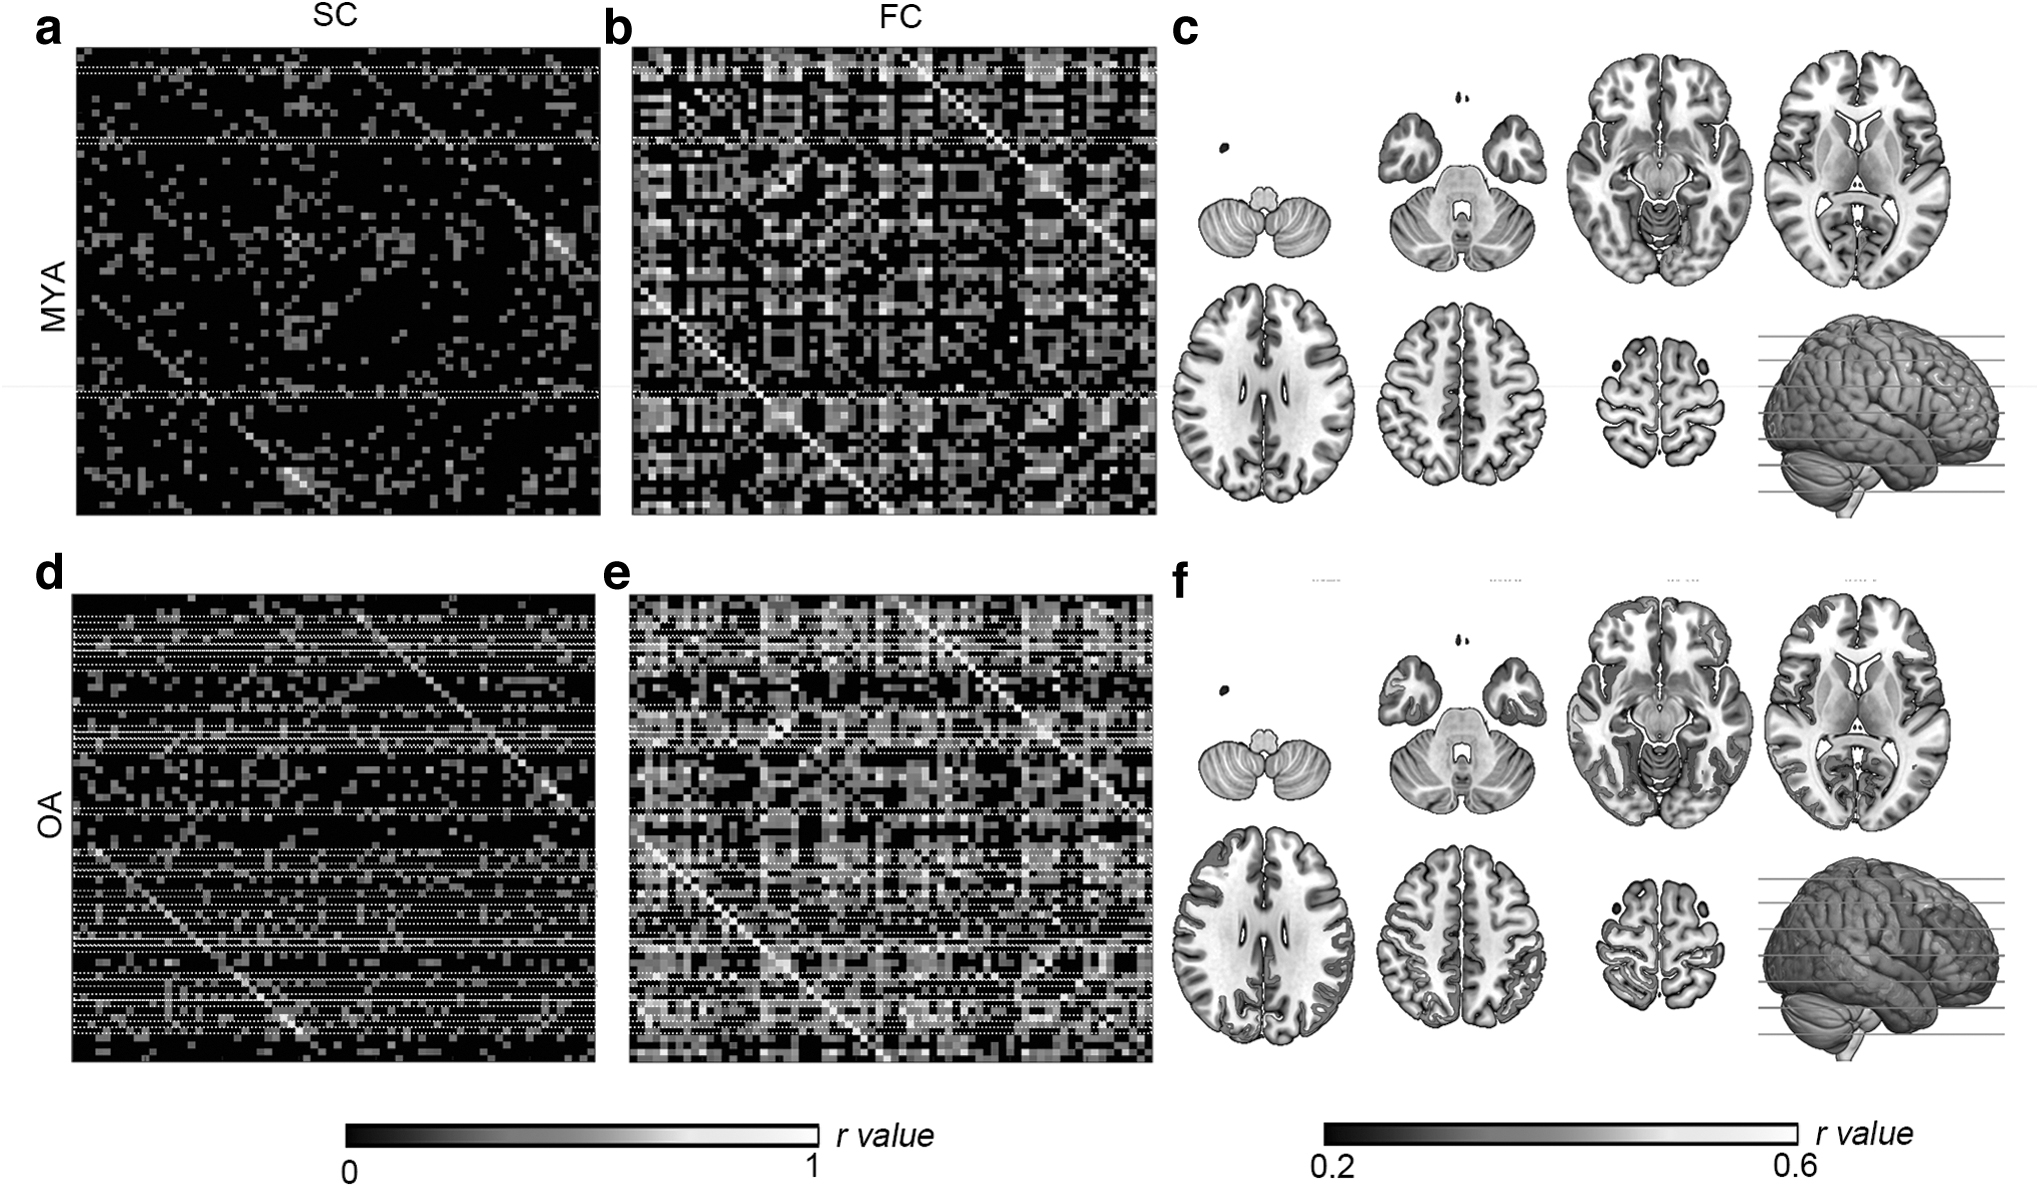
Network similarity
The SC and FC matrices for MYAs and OAs are shown in Figure 3. We first investigated network similarity and found that about half of the functional links were supported by underlying structural links. In detail, OAs exhibited more similarity between SC and FC, especially when SC is connected and FC exists, that is, probability(existenceFC|connectedSC) = 0.54 and 0.69 and probability(inexistenceFC|disconnectedSC) = 0.50 and 0.53 for the MYA and OA populations, respectively.
The brain structural
Permutation tests showed that probability(existenceFC|connectedSC) between MYA and OA groups was statistically significant (p < 0.001), while probability(inexistenceFC|disconnectedSC) was not (p = 0.34), which means that functional connections tend to be constrained by the structural connections during aging.
SC-FC coupling
Unlike the individual negative CTh-GluM coupling, most SC-FC couplings were positive and varied across the cortex, ranging from −0.12 to 0.42 for the MYA group and −0.19 to 0.58 for the OA group. In the MYA group, only three regions, including the left cuneus, left lingual, and right paracentral regions, showed significant SC-FC coupling (r = 0.37, 0.42, and 0.37, respectively, p < 0.05, FDR corrected), as shown in Figure 3c.
In the OA group, 27 of 68 regions showed significant SC-FC coupling (r = 0.29–0.58, p < 0.05, FDR corrected) and were almost evenly distributed across the brain: in detail, seven regions in the frontal lobe, including the bilateral frontal pole, paracentral gyrus, right precentral region, right rostral middle frontal gyrus, left orbital, and triangular part of the inferior frontal gyrus; six in the occipital lobe, including the bilateral cuneus, pericalcarine, right lingual, and lateral occipital gyrus; seven in the parietal lobe, including the bilateral postcentral gyrus, left inferior parietal gyrus, supramarginal gyrus, isthmus cingulate cortex, right precuneus, and superior parietal gyrus; and five in the temporal lobe, including bilateral fusiform, left inferior temporal gyrus, right middle temporal gyrus, and parahippocampal gyrus; as well as the right insula, as shown in Figure 3f.
Besides, the permutation test revealed that three regions, including the right frontal pole, right insula, and right postcentral regions, showed significantly higher SC-FC coupling in OAs than in the MYA group, as shown in the green, dotted rectangular regions in Figure 3d.
Network properties
The network properties, including degree, global efficiency, and local efficiency, were calculated to explore segregation and integration of the brain networks. We found that FC (K = 14.10 and 15.51 for MYA and OA groups, respectively) exhibited significantly denser connections compared with SC (K = 3.74 and 4.39 for MYA and OA groups, respectively) in both MYAs and OAs (p < 0.001).
Thus, it was reasonable to get the result that FC (
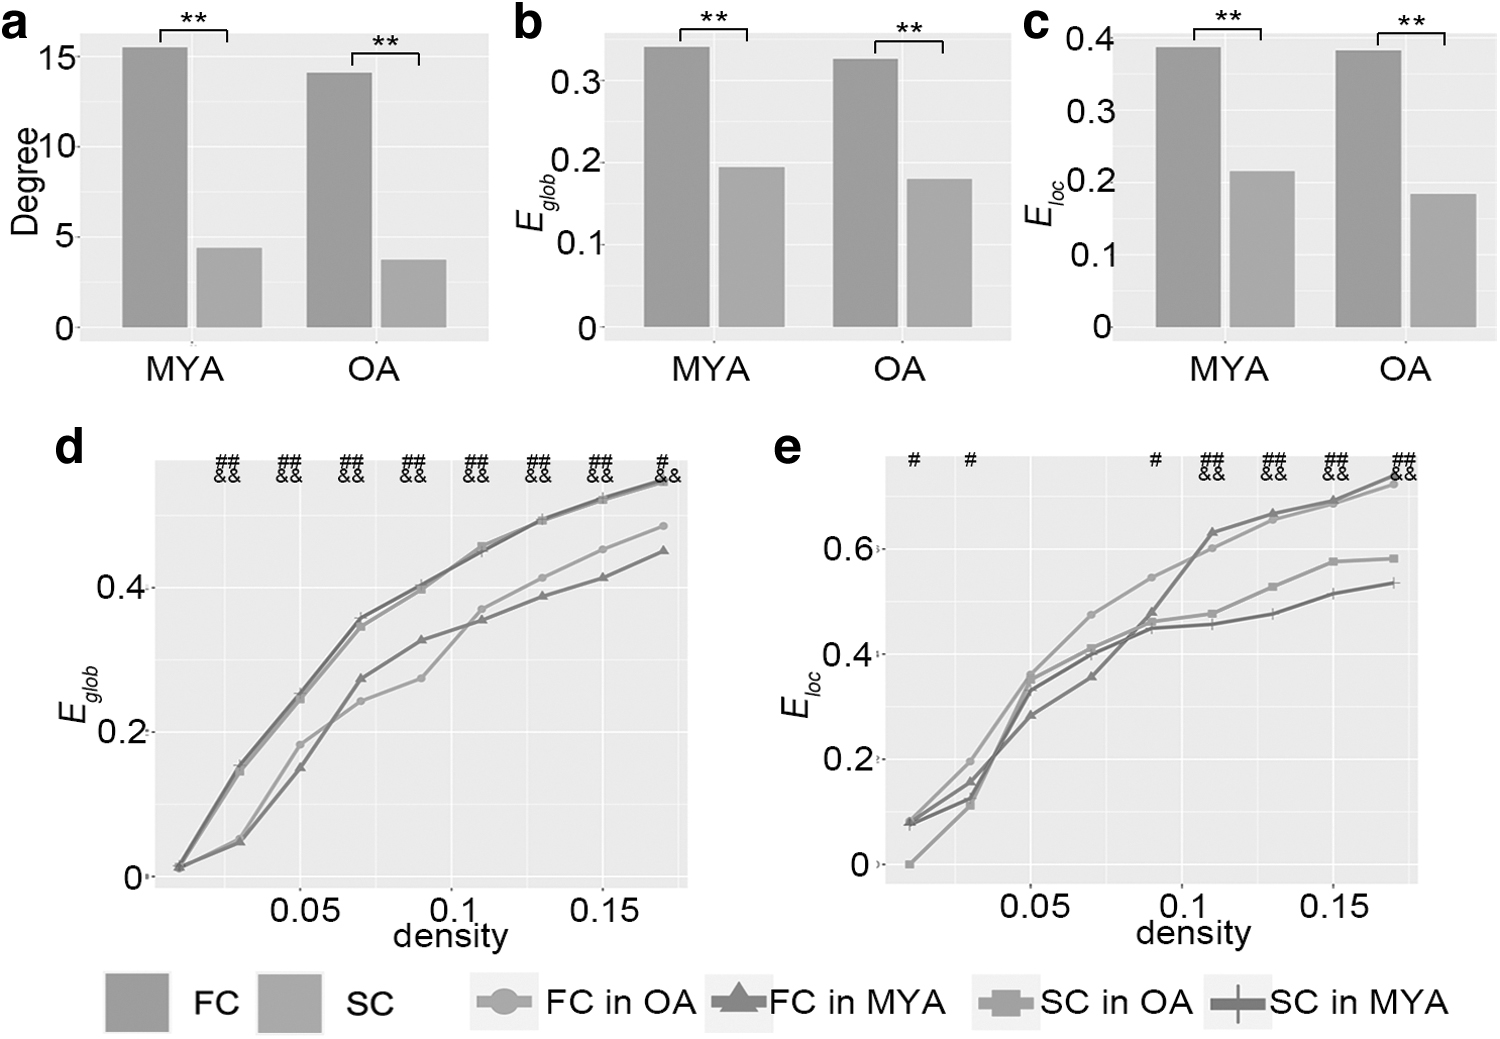
Network properties of SC and FC in MYA and OA groups. Network degree
Discussion
In this study, we quantified coupling between the brain structure and function from regional to connective levels. Our findings demonstrated that CTh and GluM were negatively correlated within subjects and this discordancy was larger during aging, while SC-FC was positively coupled and the older age subjects exhibited more similarities between SC and FC. Besides, the connections were denser in the FC matrix, partly resulting in higher global and local network efficiency in FC than SC, but FC exhibited lower global efficiency and higher local efficiency than SC when the network size was corrected.
CTh reflects the size, density, and arrangement of cells, allowing for in vivo acquisition of valuable information about neuroanatomy. Similar to a previous study reporting that CTh is not correlated with the total intracranial volume (Barnes et al., 2010), our results confirm that CTh is independent of the regional volume (Supplementary, Fig. S1b). In the present study, we found that the regional CTh was unexpectedly negatively associated with the regional GluM for a subject, especially in the temporal and occipital lobes. On the one hand, GluM varies across different brain regions such as temporal and occipital lobes, which are involved in auditory and visual processing, often exhibiting higher metabolic rates because they are active in processing sensory information. On the other hand, CTh also varies across different brain regions, and posterior regions such as temporal and occipital lobes are typically thinner than anterior structures such as the frontal lobe. It also possibly reflects topographic differences in the underlying cell types that contribute to CTh and FDG uptake. For example, CTh may be more closely related to the density of pyramidal neurons (Goriounova et al., 2018), while microglia is the main determinant of FDG uptake (Xiang et al., 2021). As age affects CTh and brain GluM in different ways (Baik et al., 2023), discordance between CTh and GluM, especially in the temporal lobe, increases during aging, which might reflect a shift in balance between energy consumption and neurodegeneration.
At the connective level, we found a positive association between SC and FC as the function is constrained by the underlying structure, although there is no one-to-one mapping (Shen et al., 2015). Besides, we also found that more regions exhibited significant SC-FC coupling in the OA group compared with the MYA group. This result is consistent with the observation that OAs exhibited higher probability(existenceFC|connectedSC) than MYAs. It is acknowledged that cognition worsens with age, and in this study, we also found that SC-FC coupling was extended from basic sensorimotor to high-level functions in old age, which is in accordance with previous studies reporting that a stronger coupling of SC and FC is related to poorer cognitive performance and decreasing awareness/consciousness (Barttfeld et al., 2015; Gu et al., 2021; Wang et al., 2018).
In the present study, we found a higher degree of FC than SC, which was similar to previous studies using diffusion tensor imaging and resting-state fMRI (Chen et al., 2022; Sporns, 2013). The functional network is based on patterns of synchronized neural activity between different brain regions, rather than on the presence or absence of anatomical connections between these regions, that is, FC can include indirect or polysynaptic connections, which may not be captured by the structural connections. As a result, functional networks can have more connections than structural networks. Besides, the functional network can exhibit a high degree of redundancy, with multiple connections between the same pair of brain regions. This redundancy can provide robustness and resilience to the network, allowing it to continue functioning even if some connections are disrupted or lost. In contrast, the structural network tends to have fewer connections, with a greater emphasis on efficiency and minimizing wiring costs. The higher degree of FC consequently induced higher global and local efficiency of FC than SC, while FC has been found to exhibit lower integration and higher segregation than SC when corrected for the network size. It may seem counterintuitive given that FC is thought to be shaped by the underlying SC of the brain. One possible explanation is that FC is shaped not only by the underlying SC but also by ongoing neural activity and the dynamic patterns of information flow that emerge from this activity. The dynamic nature of FC means that the network may exhibit more transient and flexible segregation patterns that are adapted to the task at hand, rather than a fixed modular organization that is determined by the underlying anatomy.
However, there are several limitations to the present study. First, subjects aged from 21 to 73 years were involved and split into two groups based on their age, considering the balance of sample size and sex distribution. Second, we should admit the limitation that the differences between MYA and OA groups might be unable to reveal the aged status due to the close nature of the two age groups; instead, it largely reflected the aging progress. Therefore, these results should be interpreted with caution in aged brain disorders, such as Alzheimer's disease. Besides, previous studies demonstrated that brain structure and function are modulated by sex, handedness, race, and cultural background, and effects of these factors on coupling of the brain structure and function are interesting fields to be studied in future.
Conclusions
In conclusion, we quantified the coupling between the brain structure and function from the regional to connective level using 18F-FDG PET/MRI. We demonstrated that the CTh and GluM were negatively coupled for a subject, and this discordancy was larger during aging; while at the connective level, SC-FC is positively coupled and the regions exhibiting SC-FC coupling covered primary- to high-level functions during aging. These findings provide a comprehensive picture of coupling between the brain structure and function and provide insights into the brain mechanisms.
Footnotes
Acknowledgments
The authors thank the staff at the Department of Nuclear Medicine, Shanghai East Hospital, Tongji University School of Medicine, for data acquisition.
Authors' Contributions
Conceptualization, methodology, investigation, formal analysis, writing—original draft, and funding acquisition were performed by Q.H. Data curation, investigation, formal analysis, and writing—original draft, were performed by Y.Y. and N.Q. Resources, funding acquisition, and writing—review and editing, were performed by Y.G. and J.Z. Funding acquisition, conception, supervision, and writing—review and editing, were performed by F.H., R.S., and F.X.
Author Disclosure Statement
No competing financial interests exist.
Funding Information
This study received funding from the National Key R&D Program of China (2022YFC3603003); National Natural Science Foundation of China [82201583, 8217052097, and 82071962]; Shanghai Municipal Health Commission Fund [202040420], Shanghai Municipal Key Clinical Specialty [shslczdzk03402], Shanghai Municipal Science and Technology Major Project [2018SHZDZX01], and ZJLab; STI 2030 Major Projects (022ZD0213800); and Key Discipline Construction Project of Shanghai Pudong New Area Health Commission (PWZxk2022-12).
Supplementary Material
Supplementary Figure S1
Supplementary Figure S2
References
Supplementary Material
Please find the following supplemental material available below.
For Open Access articles published under a Creative Commons License, all supplemental material carries the same license as the article it is associated with.
For non-Open Access articles published, all supplemental material carries a non-exclusive license, and permission requests for re-use of supplemental material or any part of supplemental material shall be sent directly to the copyright owner as specified in the copyright notice associated with the article.