
Abstract
Introduction:
This study aims to use diffusion tensor imaging (DTI) in conjunction with brain graph techniques to define brain structural connectivity and investigate its association with personal income (PI) in individuals of various ages and intelligence quotients (IQ).
Methods:
MRI examinations were performed on 55 male subjects (mean age: 40.1 ± 9.4 years). Graph data and metrics were generated, and DTI images were analyzed using tract-based spatial statistics (TBSS). All subjects underwent the Wechsler Adult Intelligence Scale for a reliable estimation of the full-scale IQ (FSIQ), which includes verbal comprehension index, perceptual reasoning index, working memory index, and processing speed index. The performance score was defined as the monthly PI normalized by the age of the subject.
Results:
The analysis of global graph metrics showed that modularity correlated positively with performance score (p = 0.003) and negatively with FSIQ (p = 0.04) and processing speed index (p = 0.005). No significant correlations were found between IQ indices and performance scores. Regional analysis of graph metrics showed modularity differences between right and left networks in sub-cortical (p = 0.001) and frontal (p = 0.044) networks. TBSS analysis showed greater axial and mean diffusivities in the high-performance group in correlation with their modular brain organization.
Conclusion:
This study showed that PI performance is strongly correlated with a modular organization of brain structural connectivity, which implies short and rapid networks, providing automatic and unconscious brain processing. Additionally, the lack of correlation between performance and IQ suggests a reduced role of academic reasoning skills in performance to the advantage of high uncertainty decision-making networks.
Impact Statement
The research presented on the correlation between brain network modularity and personal income (PI) performance provides crucial insights into the neurological underpinnings of human achievements. By revealing a significant link between PI performance and modular brain connectivity, we challenge conventional beliefs by emphasizing the importance of intuitive and automatic decision-making networks over traditional academic reasoning abilities. These findings have the potential to reshape our perceptions of achievement and intelligence, as they highlight the significance of rapid, unconscious processing in real-world success. This study opens new avenues for investigating the brain’s impact on performance, offering novel perspectives in neuroscience and psychology.
Introduction
Performance is defined as a social agreement around an accomplishment that is beneficial to the community (Nusbaum, 2021). High levels of performance can be achieved in a variety of fields, including academic achievements, social recognition (sports, arts, etc.), and/or personal income (PI). Academic achievements are usually associated with intelligence quotient (IQ) (Brown et al., 2021, Deary et al., 2007, Schneider et al., 2014), which is somewhat expected given that the latter was initially designed to measure children’s academic performance (Binet and Simon, 1934, Binet and Simon, 1961). Interestingly, working memory IQ was identified as the most significant predictor of academic performance (Alloway and Alloway, 2010, Schneider and Niklas, 2017). A correlation has also been found between IQ and socioeconomic performance in adults (Carl, 2016), but this correlation no more important than the correlation with self-discipline (Duckworth and Seligman, 2005) or the socioeconomic status of parents (Strenze, 2007). Commonly associated to family socioeconomic status (SES) (Brooks-Gunn and Duncan, 1997, Noble et al., 2006), academic achievement is in turn impacted by parental educational attainment, occupation, and PI (McLoyd, 1998, Schneider et al., 2014). Indeed, SES impact on cognitive development during childhood is critical across numerous domains, including language, self-regulation, memory, and socioemotional processing (Finn et al., 2017, Noble et al., 2006, Sheridan et al., 2012, Stevens et al., 2009, Tomalski et al., 2013).
Changes in the cerebral cortical gray matter (GM) are thought to be hallmarks of experience-based neural plasticity, and various studies have begun to investigate the links between SES and structural brain development (Hanson et al., 2011, Lawson et al., 2013, Noble et al., 2012, Noble et al., 2013). Particularly, morphological brain analyses have revealed an association between parental income and brain structure development (Noble et al., 2015, Raizada et al., 2008). Adolescents and young adults with high-income parents did, in fact, have a larger cortical brain surface (Mackey et al., 2015, Tooley et al., 2020). Furthermore, children from low-income families showed an increase in brain connectivity in the default mode network when parental income increased (Weissman et al., 2018). Moreover, Noble et al. (2015) showed that low-income students had a lower total GM volume than high-income students and that greater cortical thickness of temporal and occipital lobes is associated with better academic performance. Finn et al. also showed that the functional neural architecture of an adolescent’s working memory varies with family income and is related to academic achievements in mathematics (Finn et al., 2017).
The brain has been modeled as a series of complex, modular, and dynamic networks operating between specialized regions at both the macroscopic (large inter-regional connections) and microscopic (synaptic connectivity) levels (Dehaene and Naccache, 2001, Standage et al., 2020). These inter-regional networks are described in graph theory as a collection of nodes and edges (Rubinov and Sporns, 2010, Sporns and Zwi, 2004, Stam and van Straaten, 2012) that provide local and global information about the functional and structural brain connectivity by means of resting-state functional MRI and diffusion tensor imaging (DTI), respectively. Indeed, these advanced MRI techniques are essential, not only for identifying pathological alterations in brain diseases but also for the investigation of the brain connectome organization (He et al., 2009, Li et al., 2013). In such graphs, nodes represent cortical areas, derived from GM parcellation using brain atlases, whereas edges illustrate a temporal correlation or a structural connection between two GM regions. These links in brain structural connectivity are obtained by the extraction of white matter (WM) fibers using DTI tractography, which provides a correlation matrix for each brain subject. Several global graph metrics including density, assortativity, transitivity, efficiency, betweenness centrality, and modularity can be obtained for the whole brain topology characterization (Bullmore and Sporns, 2009, Kocevar et al., 2016).
Particularly, modularity is the extent to which a network is organized in clusters of nodes that are internally densely connected and externally relatively isolated (Bertolero et al., 2015, Sporns and Betzel, 2016). It is one of the most essential properties of complex systems since it offers resilience and flexibility while also promoting functional specialization (Newman, 2006, Sporns and Betzel, 2016). Network modularity boosts the effectiveness of learning or training in both children and adults, allowing for improved performance (Baniqued et al., 2019, Chen and Deem, 2015). However, Yue et al. (2017) suggested that high modularity networks boost performance on simple (low attention) activities and vice versa for complex tasks. Furthermore, children’s cerebral modularity rises with their parents’ SES (Tooley et al., 2020), whereas increased network modularity has been found among top achievers in sports (Diaz-Brage et al., 2018, Poggio and Bizzi, 2004, Wang et al., 2016), as well as in arts (Lin et al., 2013) or academic performance (Chaddock-Heyman et al., 2020, Chen and Deem, 2015). Nonetheless, no study to our knowledge has yet established a link between a modular brain network topology and PI performance.
In this study, DTI was used in conjunction with brain graph techniques to define cerebral structural organization in male individuals of various ages and IQs, as well as to assess its association with PI performance score.
Material and Methods
Subjects
Participants were recruited by advertisement in public institutions and associations. Inclusion criteria included a right-handed male, aged between 20 and 60 years, and without any neurological or psychiatric diseases or disorders, nor any MRI contraindications. The recruited subjects provided information about their body weight index, years of education, and monthly income (Table 1). The performance score was derived by dividing each individual salary by the subject age, enabling equitable comparisons across subjects. The resultant personal scores were then normalized by adjusting a percentage based on the highest attainable score within the cohort. This approach facilitated a standardized framework, ensuring that each participant’s performance was evaluated relative to the maximum achievable level and leading to a mean (± SD) index of 41.5 ± 24.6. This study was approved by the local ethics committee (CPP Sud-Est III), and written informed consent was obtained from all participants.
Subjects’ Demographics and Intelligence Quotients in All Subjects and in Two Groups of Performance Score (Low and High)
Values are presented as mean ± standard deviation. FSIQ, Full-scale intelligence quotient; VCI, Verbal comprehension index; PRI, Perceptual reasoning index; WMI, Working memory index; PSI, Processing speed index.
Intelligence scores
All subjects underwent the Wechsler Adult “Intelligence” Scale to obtain a reliable estimation of the full-scale IQ (FSIQ) and its four subscales: the verbal comprehension index (VCI), the perceptual reasoning index (PRI), the working memory index (WMI), and the processing speed index (PSI) (Bowden et al., 2010, Ryan and Glass, 2010, Wechsler, 2010) (Table 1). These IQ sub-scores were obtained from ten sub-tests including verbal (similitude, vocabulary, and information), reasoning (cubes, matrices, and puzzles), memory (arithmetic and memory of numbers), and speed processing (symbols and codes) tests (Bowden et al., 2010, Ryan and Glass, 2010).
MRI acquisition and processing
MRI examinations were performed on a 3T Siemens Prisma MRI system (Erlangen, Germany) at the MRI department of the CERMEP-Imagerie du Vivant. The MRI protocol was composed of conventional and advanced sequences. The conventional protocol (acquisition time [AT] = 11 min) consisted of a sagittal 3D T1-weighted (T1w) magnetization-prepared rapid gradient-echo (MPRAGE) sequence (repetition time [TR] = 1900 ms, echo time [TE] = 2.21 ms, voxel size = 1 × 1 × 1 mm, field of view [FOV] = 256 × 176 × 256 mm), and a sagittal 3D fluid-attenuated inversion recovery (FLAIR) sequence (TR = 5000 ms, TE = 400 ms, voxel size = 1 × 1 × 1 mm, FOV = 256 × 176 × 256 mm). An advanced diffusion weighted imaging sequence (AT = 20 min) with a multiband factor of 3, a multi-shell of two b-values (b = 1000 and 3000 s/mm2), and 128 gradient directions was acquired using a 2D multi-slice spin-echo echo-planar imaging (EPI) sequence (TR = 5048 ms, TE = 90 ms, voxel size = 1.5 × 1.5 × 1.5 mm, FOV = 160 × 136 mm). In this study, only the b1000 shell was analyzed.
Structural data were preprocessed following the pipeline of the Human Connectome Project (HCP) (Ugurbil et al., 2013), in order to benefit from its last improvements that include correction of spatial distortions, data alignment, and registration into standard space (Van Essen and Ugurbil, 2012). Anatomical images were analyzed using two steps of the structural HCP preprocessing: (1) PreFreeSurfer, and (2) FreeSurfer. During the first step, a bias field and distortion corrections were applied to both T1w and FLAIR images. Through linear and nonlinear registrations, the anatomical images have been co-registered together and then registered to the Montreal Neurological Institute (MNI) space using the linear FMRIB's Linear Image Registration Tool (FLIRT) and Nonlinear Registration Tool (FNIRT) of the Functional Magnetic Resonance Imaging of the Brain (FMRIB) Software Library (FSL) (Jenkinson et al., 2012). Non-brain voxels were then removed using FSL-BET. The diffusion tensor has also been processed to obtain the fractional anisotropy (FA) maps using the FMRIB’s Diffusion Toolbox (FDT) module of FSL. T1w images were then co-registered on the diffusion images using the affine nonrigid transformation of NiftyReg Tool (http://cmictig.cs.ucl.ac.uk/wiki/index.php/NiftyReg). The FreeSurfer step included first a segmentation of WM, cortical and subcortical GM, and cerebrospinal fluid (CSF) using T1w images. Second, a parcellation of cortical and subcortical GM in 84 regions using the Desikan atlas was computed (Desikan et al., 2006).
DTI and structural graph analysis
The pipeline for graph generation was based on the whole brain tractography performed for each subject using MRtrix (Tournier et al., 2012). The main diffusion directions were estimated in each voxel using diffusion orientation distribution function (dODF) with a maximum spherical harmonics order (h = 4) to match with the acquisition protocol. Anatomically constrained probabilistic streamline tractography was then performed to generate 1,000,000 streamlines based on the four-tissue-class classification (WM, cortical GM, sub-cortical GM, and CSF) of the IIT atlas and dODF. Finally, adjacency matrices were generated for each subject by summing the number of streamlines connecting each pair of nodes. To remove the weakest connections generated by tractography, a proportional threshold (τ = 0.35) was applied to obtain binary agency matrices. This threshold, corresponding to the minimum mean variability, was previously optimized by measuring the inter-subject variability of the global metrics for different thresholds varying between 0 and 1 in subjects with standard IQ (Kocevar et al., 2016).
Graph metrics were estimated using the MATLAB toolbox “Brain Connectivity Toolbox (BCT)” (Rubinov and Sporns, 2010), by dividing the connectivity matrices into three different sub-graphs: left and right hemispheres and the inter-hemisphere connections. The connectivity matrices were also divided into sub-networks of lobes (frontal, parietal, and temporal) and sub-cortical nuclei.
The topological properties of brain networks were analyzed using five global graph metrics and one nodal property (Rubinov and Sporns, 2010). First, graph density is measured as the ratio between the number of effective connections in the graph and the number of possible connections. Second, betweenness centrality, defined as the ratio of the number of the shortest paths comprising the node to the total number of shortest paths in the graph, measures the hub property of the node. Third, the integration property of the graph was evaluated using global efficiency, which is the mean of the inverse of the distance matrix of the graph. Finally, the segregation property of the graph was analyzed using the following three metrics: transitivity, which is the ratio between the number of triangles and the number of triplets in the graph; assortativity, which is the Pearson coefficient between the degrees of two nodes at the extremities of an edge; and modularity, which is the difference between the number of intra-module connections and the number of inter-module connections. All metrics, except graph density, were computed based on the binarized connectivity matrices using BCT on Matlab (Rubinov and Sporns, 2010).
Statistical analysis
Correlation analysis
Partial correlations between performance scores and global graph metrics were calculated using a linear regression model in the total subjects’ sample using each IQ as a covariate. The general expression of this model is as follows: Performance score ∼ Graph metric + IQ.
The statistical significance of all predictors was tested for each fit by applying analysis-of-variance with a 5% significance level. All statistical analyses were performed using Stata14 (Team RC, 2013) statistical software. Robust standard errors were used in case of heteroscedasticity, which was detected using the Huber–White robust sandwich estimator (White, 1980). Notwithstanding, the general conclusions remain coherent with and without heteroskedasticity corrections.
Group analysis
A 35% threshold for personal scores was chosen to compare two groups of low and high achievers within the study cohort. The selection of this threshold for personal scores was intricately tied to the observed salary disparities between individuals identified as low and high achievers. Notably, low achievers exhibited an average salary of approximately €2500, whereas high achievers commanded an average salary nearing €7000. By equating the lower salary to approximately 35% of the higher salary rate, we ensured a strategic calibration of the personal score threshold to tangible economic disparities prevalent within the subject population. The differences among the two groups of subjects, defined by their performance score, were tested using logistic regression model by comparing performance scores and graph metrics with IQ as a covariate. The significance of all predictors for each fit was tested by applying analysis-of-variance with a level of significance of 5%.
Tract-based spatial statistics analysis
FSL was used to analyze DTI data (Smith et al., 2004). An Eddy current correction using FDT, followed by a non-brain voxels extraction using FSL-BET with a factor of 0.35, was first applied. Maps of FA, mean, axial, and radial diffusivities (MD, AD, and RD, respectively) were then generated and visually inspected for the presence of significant residual motion or other artifacts. The resulting FA maps of all subjects were then aligned to the common MNI152 space by means of a nonlinear registration. The latter were used to generate a mean FA image and a mean WM tracts skeleton on which all aligned subjects FA data were then projected. The resulting data were next fed into a voxel-wise analysis by tract-based spatial statistics (TBSS), performed to identify FA differences between the two groups of subjects with low and high-performance score. TBSS was also applied to AD, RD, and MD maps on which the nonlinear warps and skeleton projection were applied. The resulting warped maps were then merged and projected onto the original mean FA skeleton, then fed into the voxel-wise analysis. A nonparametric permutation test approach with a standard generalized linear model design matrix was performed using the Randomize module of FSL along with the threshold-free cluster enhancement option. The IQ and its sub-scores as well as the connectivity metrics were also fed into the voxel-wise analysis as covariates. The resulting statistical parameter maps were corrected for multiple comparisons by the family-wise error rate (FWE-corrected p < 0.05). The anatomical locations of significant clusters were identified based on the Johns Hopkins University (JHU) White-Matter Tractography Atlas.
Results
The subjects ages were normally distributed (age = 40.1 ± 9.4 years), whereas FSIQ was higher than the standard average of 100 (FSIQ = 119.7 ± 10.2). A significant correlation was also observed between age and FSIQ (p = 0.03), mainly driven by VCI (p = 0.01) and to a lesser extent by PRI (p = 0.06). No significant correlations between age and WMI or PSI were noted. As the PI is strongly dependent on age (p = 0.000), the normalized performance score (PI/age) was generated to classify the 55 healthy subjects into two performance groups (low and high) using a threshold of 35%.
Global graph analysis
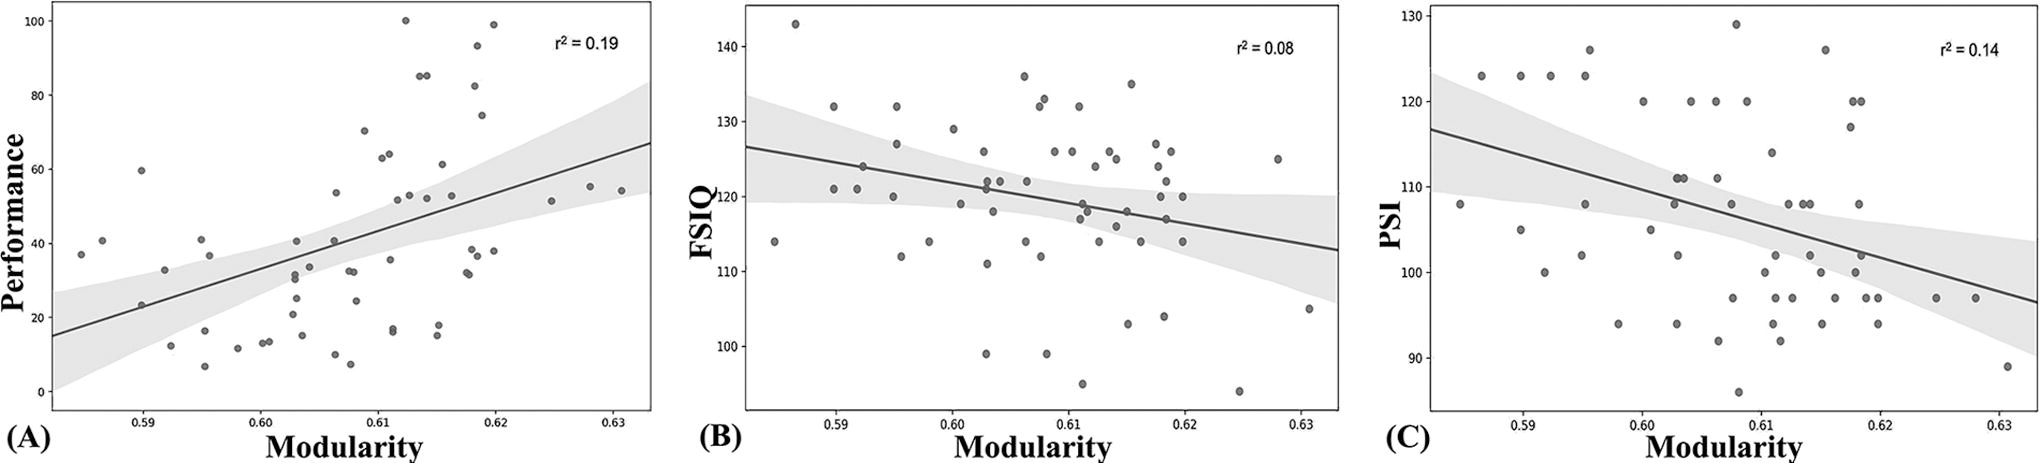
The association between brain graph metrics and performance score, IQ indices, and age subjects was assessed. Among the six graph-metrics, only modularity showed a positive correlation with the performance score (p = 0.003, Fig. 1A) and a negative correlation with the FSIQ (p = 0.04, Fig. 1B) and the PSI (p = 0.005, Fig. 1C). No significant correlations were reported between the graph metrics and age nor between the IQ indices and the performance score. Nevertheless, when controlling the correlation between the modularity and the performance score by the IQ indices, a significant correlation was found for the FSIQ (p = 0.03), the VCI (p = 0.05), and the WMI (p = 0.03) but not for the PRI (p = 0.58) nor the PSI (p = 0.23). These results suggest that the relation between performance and IQ is driven by the modular topology of the brain in opposite directions, as shown in Figure 1.
Correlations between the modularity graph metric and
Graph analysis by performance group
When comparing the low- and high-performance groups, global graph metrics analysis demonstrated a significant difference in modularity (p = 0.007) and a trend in assortativity (p = 0.06) in favor of the high-performance group (Table 2). Neither significant differences in IQ nor age were found when comparing the two performance groups.
Global Graph Metrics Measured in All Subjects and in Two Groups of Performance Score (Low and High)
Values are presented as mean ± standard deviation.
p-value when comparing Low versus High performance groups. Values in bold are statistically significant.
Regional graph analysis
When examining global brain modularity between the two hemispheres, no significant differences were found. However, when assessing regional lobular graph analysis, significant differences (p < 0.001) were reported in modularity (frontal = 0.254 ± 0.027; parietal = 0.139 ± 0.037; temporal = 0.097 ± 0.032; and sub-cortical = 0.064 ± 0.025). Additionally, significant hemispheric differences were observed in modularity between the right (0.072 ± 0.003) and left (0.057 ± 0.003) sub-cortical networks (p = 0.001) and between the right (0.259 ± 0.004) and left (0.248 ± 0.004) frontal networks (p = 0.044). Also, when the two groups of performance were compared by region, a significant (p = 0.02) increase in modularity was observed only in the right parietal network of high (0.150 ± 0.03) compared to low (0.128 ± 0.039) achievers.
Tract-based spatial statistics
When comparing DTI maps (FA, MD, AD, and RD) of subjects from the two performance groups, only modularity was associated with significant changes of diffusion metrics, specifically AD and MD. The regions that were significantly changed are listed in Table 3 and illustrated in Figures 2A and 2B.

Tract-Based Spatial Statistics analysis showing significant changes in brain white matter
Number of Significant Voxels (Nsign) and Percentage (%) of Significant Voxels per Total Number of Voxels (Ntotal) per Region of Interest of the JHU White-Matter Tractography Atlas with Significant Changes in Axial and Mean Diffusivities When Comparing Low vs High Performance Groups
L, Left; R, Right; AD, axial diffusivity; MD, mean diffusivity ATR, Anterior thalamic radiation; CST, Corticospinal tract; CG, Cingulum (cingulate gyrus); Fmaj, Forceps major; Fmin, Forceps minor; IFOF, Inferior fronto-occipital fasciculus; ILF, Inferior longitudinal fasciculus; SLF, Superior longitudinal fasciculus; UF, Uncinate fasciculus.
Discussion
The present study investigated the association between PI performance and brain structural connectivity using DTI-based graph techniques and revealed a robust association between the performance score and the brain networks modularity. Moreover, TBSS analysis showed that greater axial and mean diffusivity values are significantly correlated to the increased modularity of numerous white matter fiber bundles in high achievers (Table 3). These findings point to a highly localized and specialized brain processing in high achievers (Dehaene and Naccache, 2001, Standage et al., 2020). Higher modularity suggests greater fragmentation of brain structure into smaller specialized units working locally to process “complex” tasks automatically. Thus, PI performance appears to be related with a modular brain organization to evaluate complex situations in a rapid and efficient way. Moreover, graph analysis revealed an increased modularity in the frontal and parietal cortex and subcortical nuclei of the right hemisphere. This finding is in agreement with the report from Erdeniz and Done (Erdeniz and Done, 2019) showing that goal-based decision-making is driven by a functional coupling between the striatum and the fronto-parietal system. Furthermore, this increased modularity in the right hemisphere, which is thought to be better linked to external reality, trying to resolve discrepancies unconsciously (Goel et al., 2013, Marinsek et al., 2014), as well as overseeing emotional prosody processing (Heyrani et al., 2021), self and other awareness (LaVarco et al., 2022), and risk-taking (Yaple et al., 2017). The greater overall modularity, and particularly of the frontal and parietal cortices as well as the subcortical regions of the right hemisphere, suggests that high performance is associated with unconscious, intuitive, and emotional processing based on high uncertainty decision-making networks. Moreover, the tendency towards higher assortativity among high achievers suggests a greater resilience and robustness of brain networks (Lim et al., 2019).
Among the white matter fiber bundles identified by TBSS (Table 3), the modularity was particularly increased in the cingulate gyrus (CG) and the superior longitudinal fasciculus (SLF) of high achievers. These connections facilitate the integration of cognitive processes such as decision-making, planning, problem-solving, and emotional regulation (Janelle et al., 2022, Rolls, 2019). On one hand, the SLF provides connections between the frontal lobe and other cortical regions, including the parietal and occipital lobes. This allows for the coordination of language and motor functions, visuospatial processing, and higher-order cognitive tasks in prefrontal cortex (Janelle et al., 2022). The CG, on the other hand, serves as a hub for emotional processing and cognitive control. Its connections through the anterior CG within the frontal lobe contribute to the regulation of emotional responses and the control of cognitive functions related to attention and conflict resolution (Rolls, 2019).
The second finding of this work is the lack of significant correlation between performance, IQ, and education level in the two performance groups. This observation of PI performance not being directly related to IQ, seems surprising, given that PI performance is generally correlated to the level of education (Insee, 2018), which in turn is associated with IQ (Brown et al., 2021). Such discrepancy with common knowledge may result from a bias in our population selection. Indeed, our population of high achievers, mainly composed of self-employed people or entrepreneurs (80%), may contrast with usual statistics based on employees of large companies and thereby may constitute a bias in our study. However, when assessing the correlation between performance score with graph modularity, the “type of employment” (self-employed or employed) had no significant effect on the outcome (p = 0.3).
Overall, our findings suggest that PI performance is not associated with IQ but with a modular brain network organization that in turn is negatively correlated with IQ. Indeed, these results are concordant with our previous studies on brain organization in high-IQ children, showing that modularity is negatively correlated with IQ (Kocevar et al., 2019, Nusbaum et al., 2017). Furthermore, the negative correlation between modularity and FSIQ is mainly driven by PSI, and no direct correlation exists between performance and PSI or between modularity and performance with PSI as cofactor. These findings imply that the execution speed measured by the Wechsler Scale is an antagonist to modularity and PI performance. A larger sample size and other types of execution speed scales might help to elucidate such question. Indeed, the two PSI subtests of the Adults Wechsler Scale, “Code” and “Symbols,” consist of reacting to academic stimuli that make little sense in ordinary life. If high achievers appear in our study to invest more in experience than in theory, in intuition than in reason, it might explain why they respond loosely to the Wechsler execution speed test. Instead, their execution speed may be greater in more ordinary life situations.
Another interesting finding of our study is that IQ increases with age, mainly driven by VCI. This observation suggests that individual’s reasoning skills (measured by the IQ test) tend to grow with age. It confirms that IQ values may change across time/age, influenced by maturity, work, fatigue, stress, or motivation (Almlund et al., 2011, Colom and Román, 2018, Elango et al., 2015). Since IQ represents an instantaneous measure of academic reasoning skills, it is finally not surprising that there is no evident relationship with PI performance. Furthermore, given its relative fidelity over time, it seems presumptuous to systematically associate IQ with giftedness or intelligence.
Limitations and outlooks
We chose to include exclusively right-handed Caucasian men to achieve higher homogeneity in the included population. Obviously, extending this study to females, left-handers, ambidextrous people, and other ethnic groups would be interesting and necessitate further studies. Also, the average IQ of our participants was 20% above the standard population, which may constitute a bias of selection. Such elevated IQ of the studied population may have increased the role of IQ in the correlation between modularity and performance, which may not happen in the case of a standard IQ population. Moreover, while the subjects’ selection was open to any social class or type of employment, it should be noticed that 80% of high achievers were self-employed or entrepreneurs compared with 20% of low achievers. This disparity may have an impact on the observed differences in brain modularity, suggesting that a more balanced study might help elucidate the greater modular fragmentation in high performance. Finally, we focused in this study on the personal income criterion, which appeared to be an objective determinant in adult performance. Of course, other criteria of performance, such as winning awards or medals, social recognition, for example, in sports or arts performance could be of great interest and should be investigated in future.
Conclusion
This study showed that PI performance is strongly correlated with a modular brain connectivity organization, which implies short and rapid networks, that are automatic and unconscious, and leading to a direct and intuitive contact with the environment. In addition, the lack of correlation between performance and IQ, reduces the role of academic reasoning skills in performance to the advantage of high uncertainty decision-making brain processing.
Footnotes
Acknowledgment
The authors would like to thank the staff of the CERMEP-Imagerie du Vivant for their help with MRI data acquisition, as well as Gabriel Kocevar, Adrien Stadler, Marlène Dubois, Anne-Laure Krikorian for their assistance in data collection.
Authors’ Contributions
F.N. coordinated the study, recruited the subjects, provided the clinical expertise, and wrote the article in collaboration with S.H. who participated in the data processing. I.S. and B.B. performed image and graph data processing, and statistical analysis. S.M.-M. performed the medical visits and supervised MR examinations. D.S.-M. coordinated the study, supervised MR acquisitions, data processing, results analysis, and participated to the article writing.
Data Availability Statement
The data that support the findings of this study are available from the corresponding author upon reasonable request.
Ethics Approval and Patient Consent Statement
This study was approved by the local ethics committee (CPP Sud-Est III), and written informed consent was obtained from all participants in accordance with the Declaration of Helsinki.
Author Disclosure Statement
Authors have no conflict of interest to report.
Funding Information
I.S. was funded by a national grant from the French government. B.B. was funded by an EU H2020 MSCA-ITN-2018 project #813120 INSPiRE-MED.