
Abstract
Objective:
Cerebral small vessel disease (CSVD) is a primary vascular disease of cognitive impairment. Previous studies have predominantly focused on brain linear features. However, the nonlinear measure, brain entropy (BEN), has not been elaborated. Thus, this study aims to investigate if BEN abnormalities could manifest in CSVD patients with cognitive impairment.
Methods:
Thirty-four CSVD patients with cognitive impairment and 37 healthy controls (HCs) were recruited. Analysis of gray matter approximate entropy (ApEn) and sample entropy (SampEn) which are two indices of BEN was calculated. To explore whether BEN can provide unique information, we further performed brain linear methods, namely, amplitude of low frequency fluctuation (ALFF) and regional homogeneity (ReHo), to observe their differences. The ratios of BEN/ALFF and BEN/ReHo which represent the coupling of nonlinear and linear features were introduced. Correlation analysis was conducted between imaging indices and cognition. Subsequently, the linear support vector machine (SVM) was used to assess their discriminative ability.
Results:
CSVD patients exhibited lower ApEn and SamEn values in sensorimotor areas, which were correlated with worse memory and executive function. In addition, the results of BEN showed little overlap with ALFF and ReHo in brain regions. Correlation analysis also revealed a relationship between the two ratios and cognition. SVM analysis using BEN and its ratios as features achieved an accuracy of 74.64% (sensitivity: 86.49%, specificity: 61.76%, and AUC: 0.82439).
Conclusion:
Our study reveals that the reduction of sensorimotor system complexity is correlated with cognition. BEN exhibits distinctive characteristics in brain activity. Combining BEN and the ratios can be new biomarkers to diagnose CSVD with cognitive impairment.
Impact Statement
Cerebral small vessel disease (CSVD) is regarded as the most important vascular disease of cognitive impairment. However, conventional brain imaging fails to adequately elucidate the pathogenesis of cognitive disorder related to CSVD. In this regard, exploring brain entropy (BEN) based on resting-state functional magnetic resonance imaging (rs-fMRI) represents a relatively novel and unexplored approach in the context of CSVD. This approach provides novel insights into the pathogenesis, diagnosis, and rehabilitation of cognitive disorder associated with CSVD.
Introduction
Cerebral small vessel disease (CSVD) is a disorder that affects the small arteries, arterioles, venules, and capillaries of the brain (Pantoni, 2010). Its typical brain imaging characteristics in magnetic resonance imaging (MRI) include white matter hyperintensities (WMHs) of presumed vascular origin, lacunar infarction (LI), cerebral microbleeds (CMBs), enlarged perivascular space (EPVS), and brain atrophy. Cognition impairment is a prevalent clinical manifestation of CSVD, which has been recognized as the most common vascular contributor to vascular cognitive impairment and dementia (Dichgans and Leys, 2017; METACOHORTS Consortium, 2016). It is imperative to understand the underlying causes of cognitive disorder in CSVD and implement early interventions to mitigate its progression. Concerning the structure associated with CSVD, WMHs (Guo and Shi, 2022), LI (Ling and Chabriat, 2020), CMBs (Nannoni et al., 2022), EPVS (Jie et al., 2020), as well as brain atrophy (Sun et al., 2022) have been acknowledged as factors contributing to cognitive impairment. However, it is not reasonable to interpret the effects of these lesions on cognitive impairment in isolation, given their frequent coexistence. In addition, it is common to observe a remarkable heterogeneity in cognitive performance among patients with a similar radiological degree of CSVD-associated features in brain imaging (Ter Telgte et al., 2018). Furthermore, a recent study has indicated that the shapes of WMHs exhibit an association with cognitive function (Zwartbol et al., 2022). Thus, these structural impairments may only explain the tip of the iceberg of cognitive disorder in CSVD. It is necessary to explore the relationship between abnormal brain function behind structure injuries and cognitive disorder. Resting-state functional MRI (rs-fMRI) is used to explore brain intrinsic activity indirectly by analyzing different blood oxygenation level dependent (BOLD) signals in different regions of the brain “at rest” (Murphy et al., 2013). As a noninvasive and convenient technology, it has been extensively used to investigate the linear characteristics of brain signals, such as amplitude of low frequency fluctuation (ALFF) (Hu et al., 2022) and regional homogeneity (ReHo) (Diciotti et al., 2017) to comprehend the underlying mechanisms of cognitive impairment in CSVD. However, the ALFF and ReHo indices only capture linear and static (time-invariant) dependencies between brain regions, overlooking the fact that the brain is a nonlinear dynamical system capable of generating highly complex and flexible activity patterns over time. Brain entropy (BEN), as a dynamic nonlinear indicator representing brain activity, has been widely applied in neurological and psychiatric disorders, including chronic smokers (Li et al., 2016), multiple sclerosis (Zhou et al., 2016), Alzheimer’s disease (AD) (Wang, 2020), cocaine dependence (Wang et al., 2017b), and other forms of drug dependence (Jiang et al., 2023).
Entropy is a physical concept that describes the irregularity of a dynamic system. Entropy is also a trait of the brain. The entropy of brain activity can be explained by the complexity of information according to Shannon’s information theory (Shannon, 1948). The brain serves as a sophisticated information processing system, integrating incoming and outgoing stimuli to support various vital activities including cognition, mood regulation, and motor control. Previous studies on the entropy of the brain mainly have predominantly used electroencephalogram (ECG) (Kalamangalam and Chelaru, 2021) and magnetoencephalography (MEG) (Bai et al., 2022) with low spatial resolution. The BEN metric, as measured by rs-fMRI, is a relatively novel measurement that offers high spatial resolution compared with ECG and MEG. Differing from other brain imaging methods, BEN is a nonlinear measure to evaluate the temporal dynamic or phasic characteristics of brain activity using BOLD signals (Song et al., 2019a). Approximate entropy (ApEn) (Pincus, 1991) and sample entropy (SampEn) (Richman and Moorman, 2000) are two commonly used indices for assessing the complexity of a dynamic system by analyzing physiological time series. These measures have been used to investigate the complexity and regularity of BOLD fMRI time series (Sokunbi et al., 2011; Wang et al., 2014). Lipsitz and Goldberger proposed that aging and disease are characterized by a generalized loss of complexity in the dynamics of system function and consequently reduce capacity to adapt stress (Lipsitz and Goldberger, 1992). In this context, many studies have demonstrated a correlation between reduced entropy in distinct brain regions and the corresponding symptoms observed in various neuropsychiatric disorders. For instance, reduced BEN has been reported in stroke patients with motor deficits (Liang et al., 2020), individuals with AD (Liu et al., 2013; Wang et al., 2017a), those diagnosed with schizophrenia or bipolar disorder (Zhang et al., 2021), major depressive disorder (Liu et al., 2020), as well as attention deficit hyperactivity disorder (Sokunbi et al., 2013). It is noteworthy that entropy also serves as a statistical measure. It may provide unique information compared with other linear methods such as ALFF and ReHo. The ALFF measures the total power of the BOLD signal within the low-frequency range between 0.01 and 0.1 Hz, indicating regional spontaneous neuronal activity (Zang et al., 2007). ReHo is a linear index used to measure the similarity of the time series of a given voxel to those of its nearest neighbors in a voxel-wise way (Zang et al., 2004). Song et al discovered that only restrictive brain regions exhibited a negative correlation between BEN and fALFF (Song et al., 2019a). In another literature, Liang et al also observed a lacking of correlation between BEN and ALFF, ReHo (Liang et al., 2020). Moreover, Zhou et al reported that ALFF alteration patterns only showed minor overlap with BEN alteration patterns in relapsing remitting multiple sclerosis (Zhou et al., 2016). These findings provide compelling evidence suggesting that BEN potentially provides new information in CSVD patients with cognitive disorder. To validate this hypothesis, it is imperative to investigate both nonlinear and linear methods. In addition, in two previous studies, the ratio of across-voxel cerebral blood flow (CBF) to functional connectivity strength (FCS) was used to characterize the coupling between vascular response and neuronal activity in the brain (Liang et al., 2013; Zhu et al., 2017). The author also proposed that the CBF/FCS ratio could be used to identify changes in the neurovascular coupling in schizophrenia that cannot be detected by investigating the CBF and FCS separately (Zhu et al., 2017). Consequently, we introduced two new indices, BEN/ALFF and BEN/ReHo, with similar ratios to investigate their association with symptoms. In comparison with individual linear or nonlinear metrics, we posited that the ratios can offer additionally insights into the coupling relationship between dynamic and static indices of brain organization, thereby facilitating a more profound investigation into the pathogenesis of cognitive impairment in CSVD.
Based on the aforementioned perspectives, this study initially investigated whether there were specific brain regions exhibiting reduced entropy that correlated with cognitive symptoms in CSVD compared with healthy individuals. Subsequently, we compared the differences between nonlinear and linear outcomes in functional MRI. A further analysis of the correlation between the ratios of coupling of nonlinear and linear indicators and cognitive function was presented. Finally, a support vector machine (SVM)–based model was used to evaluate the classification ability of BEN, BEN/ALFF, and BEN/ReHo in distinguishing CSVD patients with cognitive impairment from healthy controls (HCs). We postulated that combining BEN with ratios can serve as novel biomarkers for diagnosing CSVD patients with cognitive impairment.
Materials and Methods
Participate
We recruited 34 patients with CSVD and cognitive impairment, as well as 37 HCs, from the Department of Neurology of the First Affiliated Hospital of Anhui Medical University, Hefei, China. Inclusion criteria for CSVD patients with cognitive impairment were as follows: (1) age range between 50 and 80 years, (2) presence of CSVD-related WMHs on T2 FLAIR images with a Fazekas score ≥3 (Fazekas et al., 1987), and (3) the Montreal Cognitive Assessment (MoCA) score <26 (Nasreddine et al., 2005). Exclusion criteria were as follows: (1) intracranial and extracranial artery stenosis exceeding 50%; (2) trial of Org 10172 in Acute Stroke Treatment classification suggestive of cardiogenic stroke, (3) patients with tumors, intracranial hemorrhage, mental disorder, alcohol addiction, and other neuropsychiatric conditions; and (4) individuals unable to complete neuropsychological tests or MRI scans due to issues such as hearing loss, language barriers, severe vision loss, motor disorders, claustrophobia, etc. The HCs were matched with patients based on age, sex, and education. Their MRI imaging revealed no typical lesions of CSVD, and they also met the aforementioned exclusion criteria. All participants provided written informed consent before the study which received approval from the Ethics Committee of Anhui Medical University by the principles of the Declaration of Helsinki.
Neuropsychological test
For the assessment of global cognitive function, we used the Montreal Cognitive Assessment (MoCA). To evaluate vocabulary memory, encompassing immediate memory, delayed memory, and recognition memory, we used the Auditory Verbal Learning Test (AVLT) (Schoenberg et al., 2006). Information processing speed was assessed using the Symbol Digit Modalities Test (SDMT) (Silva et al., 2018). To assess attention, we used the Digital Span test which consists of forward and backward components (Cao et al., 2021). The Stroop color-word test comprises four parts: Stroop word (SW), Stroop color (SC), and Stroop color-word (SCW), and the interference score was derived by subtracting SC from SCW. We used the fourth part to evaluate the executive function. Color Trials Tests (CTT) including CTT 1 and CTT 2 were administered to assess executive and attention functions (Feeney et al., 2016). The Boston Naming Test is a commonly used measure for evaluating word-finding ability (Durant et al., 2021).
MRI data acquisition
The structure and functional MRI scans were conducted at the Information Science Center of the University of Science and Technology of China. During the scanning process, participants were instructed to keep their eyes closed without falling asleep, maintain stillness, and avoid engaging in specific thoughts. Images were acquired using a 3.0T MRI scanner (Discovery GE750w; GE Healthcare, Buckinghamshire, UK). The scanning parameters for different sequences were configured as follows: for resting-state functional MRI (rs-fMRI): TR = 2,400 ms, TE = 30 ms, flip angle = 90◦, matrix size = 64 × 64, FOV = 192 mm × 192 mm, slice thickness = 3 mm with no gap, and 46 continuous slices (one voxel = 3 mm × 3 mm × 3 mm). The resting-state fMRI dataset consisted of 217 time points. Sagittal three-dimensional (3D) T1-weighted images were acquired using a brain volume (BRAVO) sequence with 188 slices (TR = 8.16 ms; TE = 3.18 ms; flip angle = 12◦; FOV = 256 mm × 256 mm; slice thickness = 1 mm, no gap; voxel size = 1 mm × 1 mm × 1 mm). For T2 FLAIR, the following parameters were used: repetition time (TR) = 8,000 ms, echo time (TE) = 165 ms, TI = 2,000 ms, flip angle = 111◦, matrix size = 512 × 512, field of view (FOV) = 256 mm × 256 mm, slice thickness = 5 mm, gap = 1 mm, and total slices = 20.
Data processing
The preprocessing of all functional data underwent preprocessing using the Data Processing Assistant of the Resting-State Functional Magnetic Resonance Imaging (rsfMRI) toolkit (DPARSF, http://rfmri.org/dpabi) (Yan et al., 2016), as well as a software package based on Statistical Parametric Mapping software (SPM12, http://www.fil.ion.ucl.ac.uk/spm). The preprocessing steps included: (1) to eliminate machine and participant adaptation, the initial 10 time points of images were discarded; (2) slice timing correction was applied to rectify temporal layers; (3) subsequently, the images were realigned to the middle volume for head motion correction, and participants with head motion exceeding 3 mm or 3° were excluded; (4) the remaining images were normalized and registered to the Montreal Neurological Institute (MNI) template space (resampled into 3x3x3 mm voxels); (5) nuisance covariates, including Friston-24 motion parameters, white matter high signal, cerebrospinal fluid signal, and global signal were regressed out; and (6) finally, the imaging data underwent temporal filtering with a frequency range of 0.01–0.1 Hz.
BEN calculation
After preprocessing the imaging data, we used internally developed MATLAB codes in conjunction with Brain Entropy Mapping Toolbox (BENtbx1) developed by Wang et al. (2014) to compute ApEn and SampEn for each voxel. ApEn calculates the average logarithmic probability using a template-based approach by first calculating the probability for each template (Fan et al., 2023). The SampEn algorithm, a modification of ApEn that exhibits relative consistency while excluding self-matches, has been introduced by Yentes et al (Yentes et al., 2013). ApEn encompasses three parameters, namely, m, r, and N. Herein, m represents pattern length, r signifies the tolerance width, and N represents the time points. It is noteworthy that both ApEn and SampEn use identical input parameters. Distinct values of these parameters yield disparate outcomes. According to Wang et al. (2014), an optimal choice for SampEn was observed when setting m as 3 and r as 0.6 SD. Subsequently, z-standardization was performed on each voxel’s ApEn and SampEn values to ensure comparability across brain regions or subjects while facilitating subsequent statistical analysis. This process involves subtracting the mean value of the data followed by division with its standard deviation. Finally, imaging smoothing was conducted (full width at half maximum, FWHM = 4 × 4 × 4 mm).
ALFF, ReHo calculation
After preprocessing, the filtered time series were calculated through Fourier transform, and then, the ALFF value was obtained by averaging square root in the range of 0.01–0.1 Hz. The ReHo value of each voxel was determined by the Kendall’s coefficient of concordance with its 26 surrounding neighbors. Finally, the images were standardized and smoothed (FWHM = 4 × 4 × 4 mm).
BEN/ALFF and BEN/ReHo calculation
After the preprocessing of ApEn, SampEn, ALFF, and ReHo were completed, we used internally developed MATLAB codes to compute the ratio of nonlinear and linear values. Subsequently, four sets of ratios were obtained: ApEn/ALFF, ApEn/ReHo, SamEn/ALFF, and SamEn/ReHo.
Linear support machine learning
To assess the potential of the identified neural indices as imaging biomarkers for distinguishing between CSVD patients with cognitive impairment and HCs, we used a linear support vector machine (SVM) approach using the LIBSVMs toolkit in MATLAB, using the linear kernel setting for classification (Chang and Lin, 2011). BEN and its ratios, which exhibited significant differences between groups, were considered as features for classification. The leave-one-out cross-validation (LOOCV) strategy was used for statistical validation. The LOOCV ensured that each subject was used once as validating samples, and the remaining subjects were used for training purposes. There were two labels (CSVD patients with cognitive impairment and HCs) in the training and testing step. Each subject was assigned only one label. In the SVM procedure, a predicted label was obtained in each validation. By comparing the predicted labels with true labels, we assessed classification accuracy, specificity, sensitivity, and area under the receiver operating characteristic curve (AUC), which served as performance evaluation metrics for the classifier. The permutation test (5000 permutations) was used to determine the significance of the accuracy. In the permutation test, the label was reset randomly first. Then, the LOOCV was performed again according to the new label. We further obtained a new accuracy of the classification in one permutation test. Based on these 5000 results of the accuracy, the accuracy in the real labeling condition could be inferred as significant or not. Statistical significance was defined by p < 0.05.
Statistical analysis
The statistical analysis was conducted using DPARSF and SPSS statistical software (version 26.0). We used the two-sample t-test to compare continuous variables with a normal distribution between groups, while the Wilcoxon rank-sum test was used for continuous variables with nonnormal distribution. For categorical variables, we applied the chi-square test to perform comparisons. Using the DPARSF software, a two sample t-test was conducted on the imaging indices of BEN, ALFF, ReHo, BEN/ALFF, and BEN/ReHo while controlling for head motion parameters, age, and gender as covariates. In the patient group, regions exhibiting significant between-group differences in BEN, ALFF, and ReHo were further compared to assess the overlap between BEN and ALFF as well as ReHo differential regions. In addition, Pearson correlation analysis or Spearman correlation analysis using SPSS software was conducted to examine associations between cognitive scores of patients with extracted values of BEN, BEN/ALFF ratio, and BEN/ReHo ratio from brain regions demonstrating significant differences. Statistical significance was set at p < 0.05.
Results
Demographics and neuropsychological tests
There were no significant differences in age, sex, and education between the two groups. In terms of cognitive performance, CSVD patients showed significantly poor performance in terms of MoCA, AVLT, SDMT, DS-backward, CTT 1, CTT 2, and BNT (see Table 1).
Demographics and Cognitive Performance Between Two Groups
Values with normal distribution are presented as the mean ± stand deviation (SD); Values with nonnormal distribution are presented as median(interquartile). Among CSVD patients, five subjects didn’t finish both the AVLT test and Stroop test, and three of them didn’t finish CTT and SDMT test as well.
significant at 0.05 level (two tailed).
significant at 0.01 level.
Significant at 0.001 level.
CSVD, cerebral small vessel disease; HCs, healthy controls; MoCA, Montreal Cognitive Assessment; AVLT, Chinese Auditory Learning Test; CTT, Color trials test; and BNT, Boston Naming Test.
BEN results
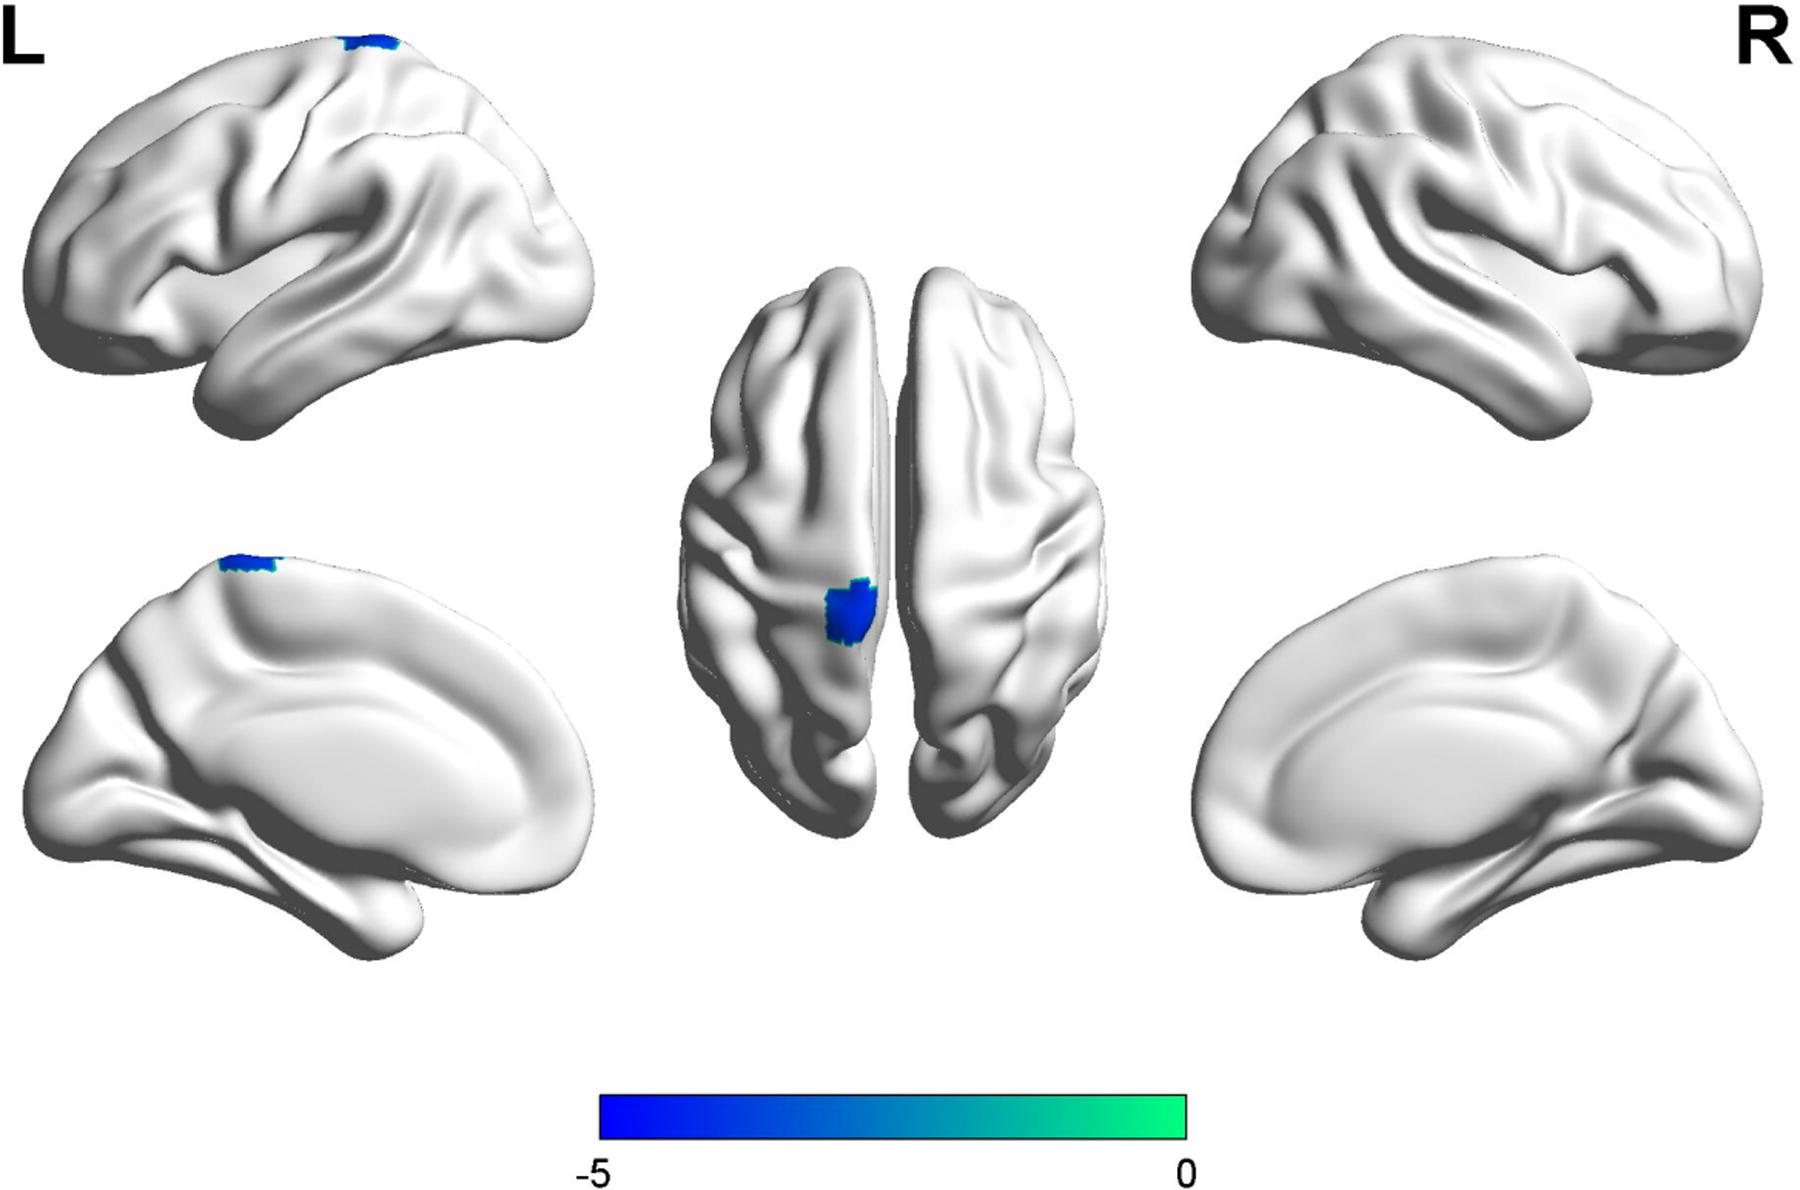
Regarding ApEn, compared with HCs, patients exhibited significantly lower BEN in the right precentral (MNI[3,−24,78], cluster size: 22, t = −4.076), and left paracentral lobule (MNI[−3,−24,−78], cluster size: 63, t = −4.2618). Similarly, for SampEn analysis, patients demonstrated significantly lower BEN in the left paracentral lobule (MNI[−12,−33,81], cluster size:7, t = −4.0236) (refer to Table 2 and Figs. 1–3). All results were obtained using a voxel-level threshold of p < 0.001 with FWE correction at p < 0.05.
Different Brain Regions in ApEn, SampEn, ApEn/ReHo, and SampEn/ALFF Between Groups
ApEn, approximate entropy; SampEn, sample entropy; ApEn/ReHo, the ratio of ApEn and ReHo; SampEn/ALFF, the ratio of SampEn and ALFF. MIN, Montreal Neurological Institute.

The results of ApEn and SampEn between patients and HCs.

The patients showed lower ApEn in the right precentral and left paracentral. L, left; R, right.
The patients showed low SampEn in the left paracentral lobule. L, left; R, right.
Comparison of BEN and ReHo, ALFF
We compared the distribution of BEN (including ApEn and SampEn), ALFF, and ReHo in the patient group. For ALFF and ReHo, we used the same cluster-forming threshold and correction as BEN. In Figure 4, there was a minimal overlap observed between BEN and ALFF primarily localized within the sensorimotor system. In Figure 5, no overlap was found between BEN and ReHo.
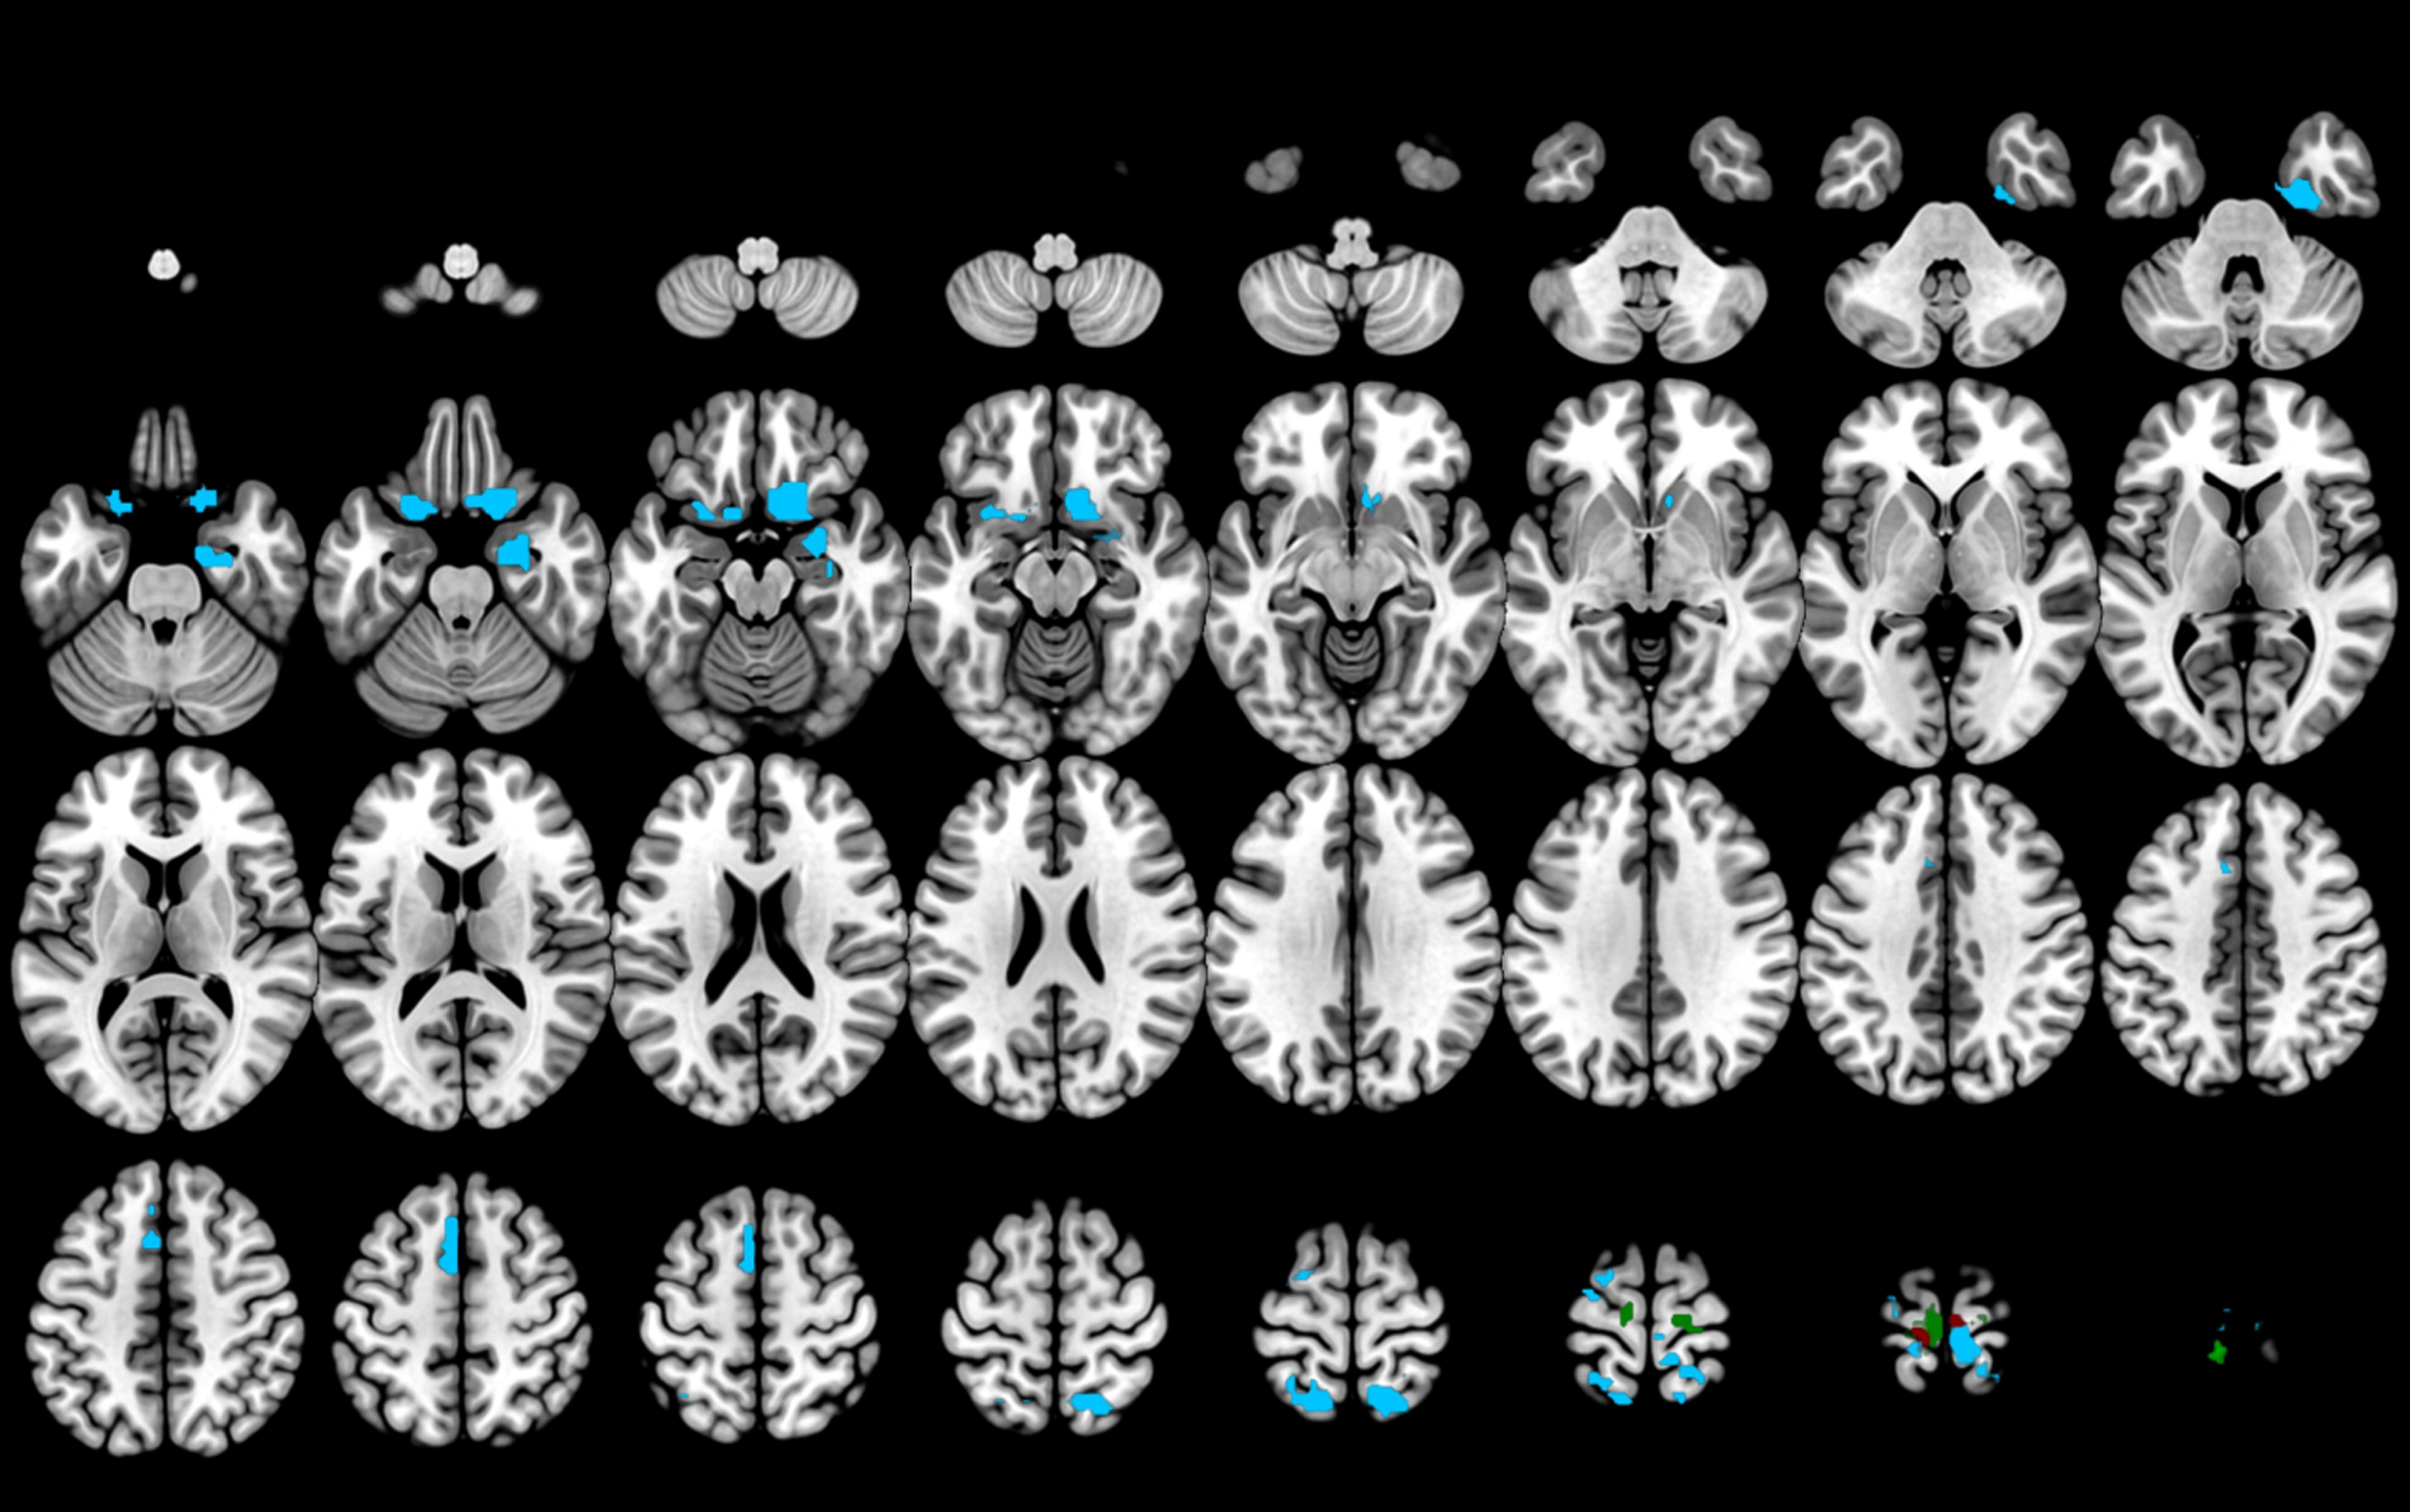
The brain regions of BEN and ALFF in patients. The green represents the regions of BEN without no overlap with ALFF. The red means overlap regions between BEN and ALFF. The blue represents the location of ALFF without overlap with BEN. ALFF, amplitude of low frequency fluctuation; BEN, brain entropy.
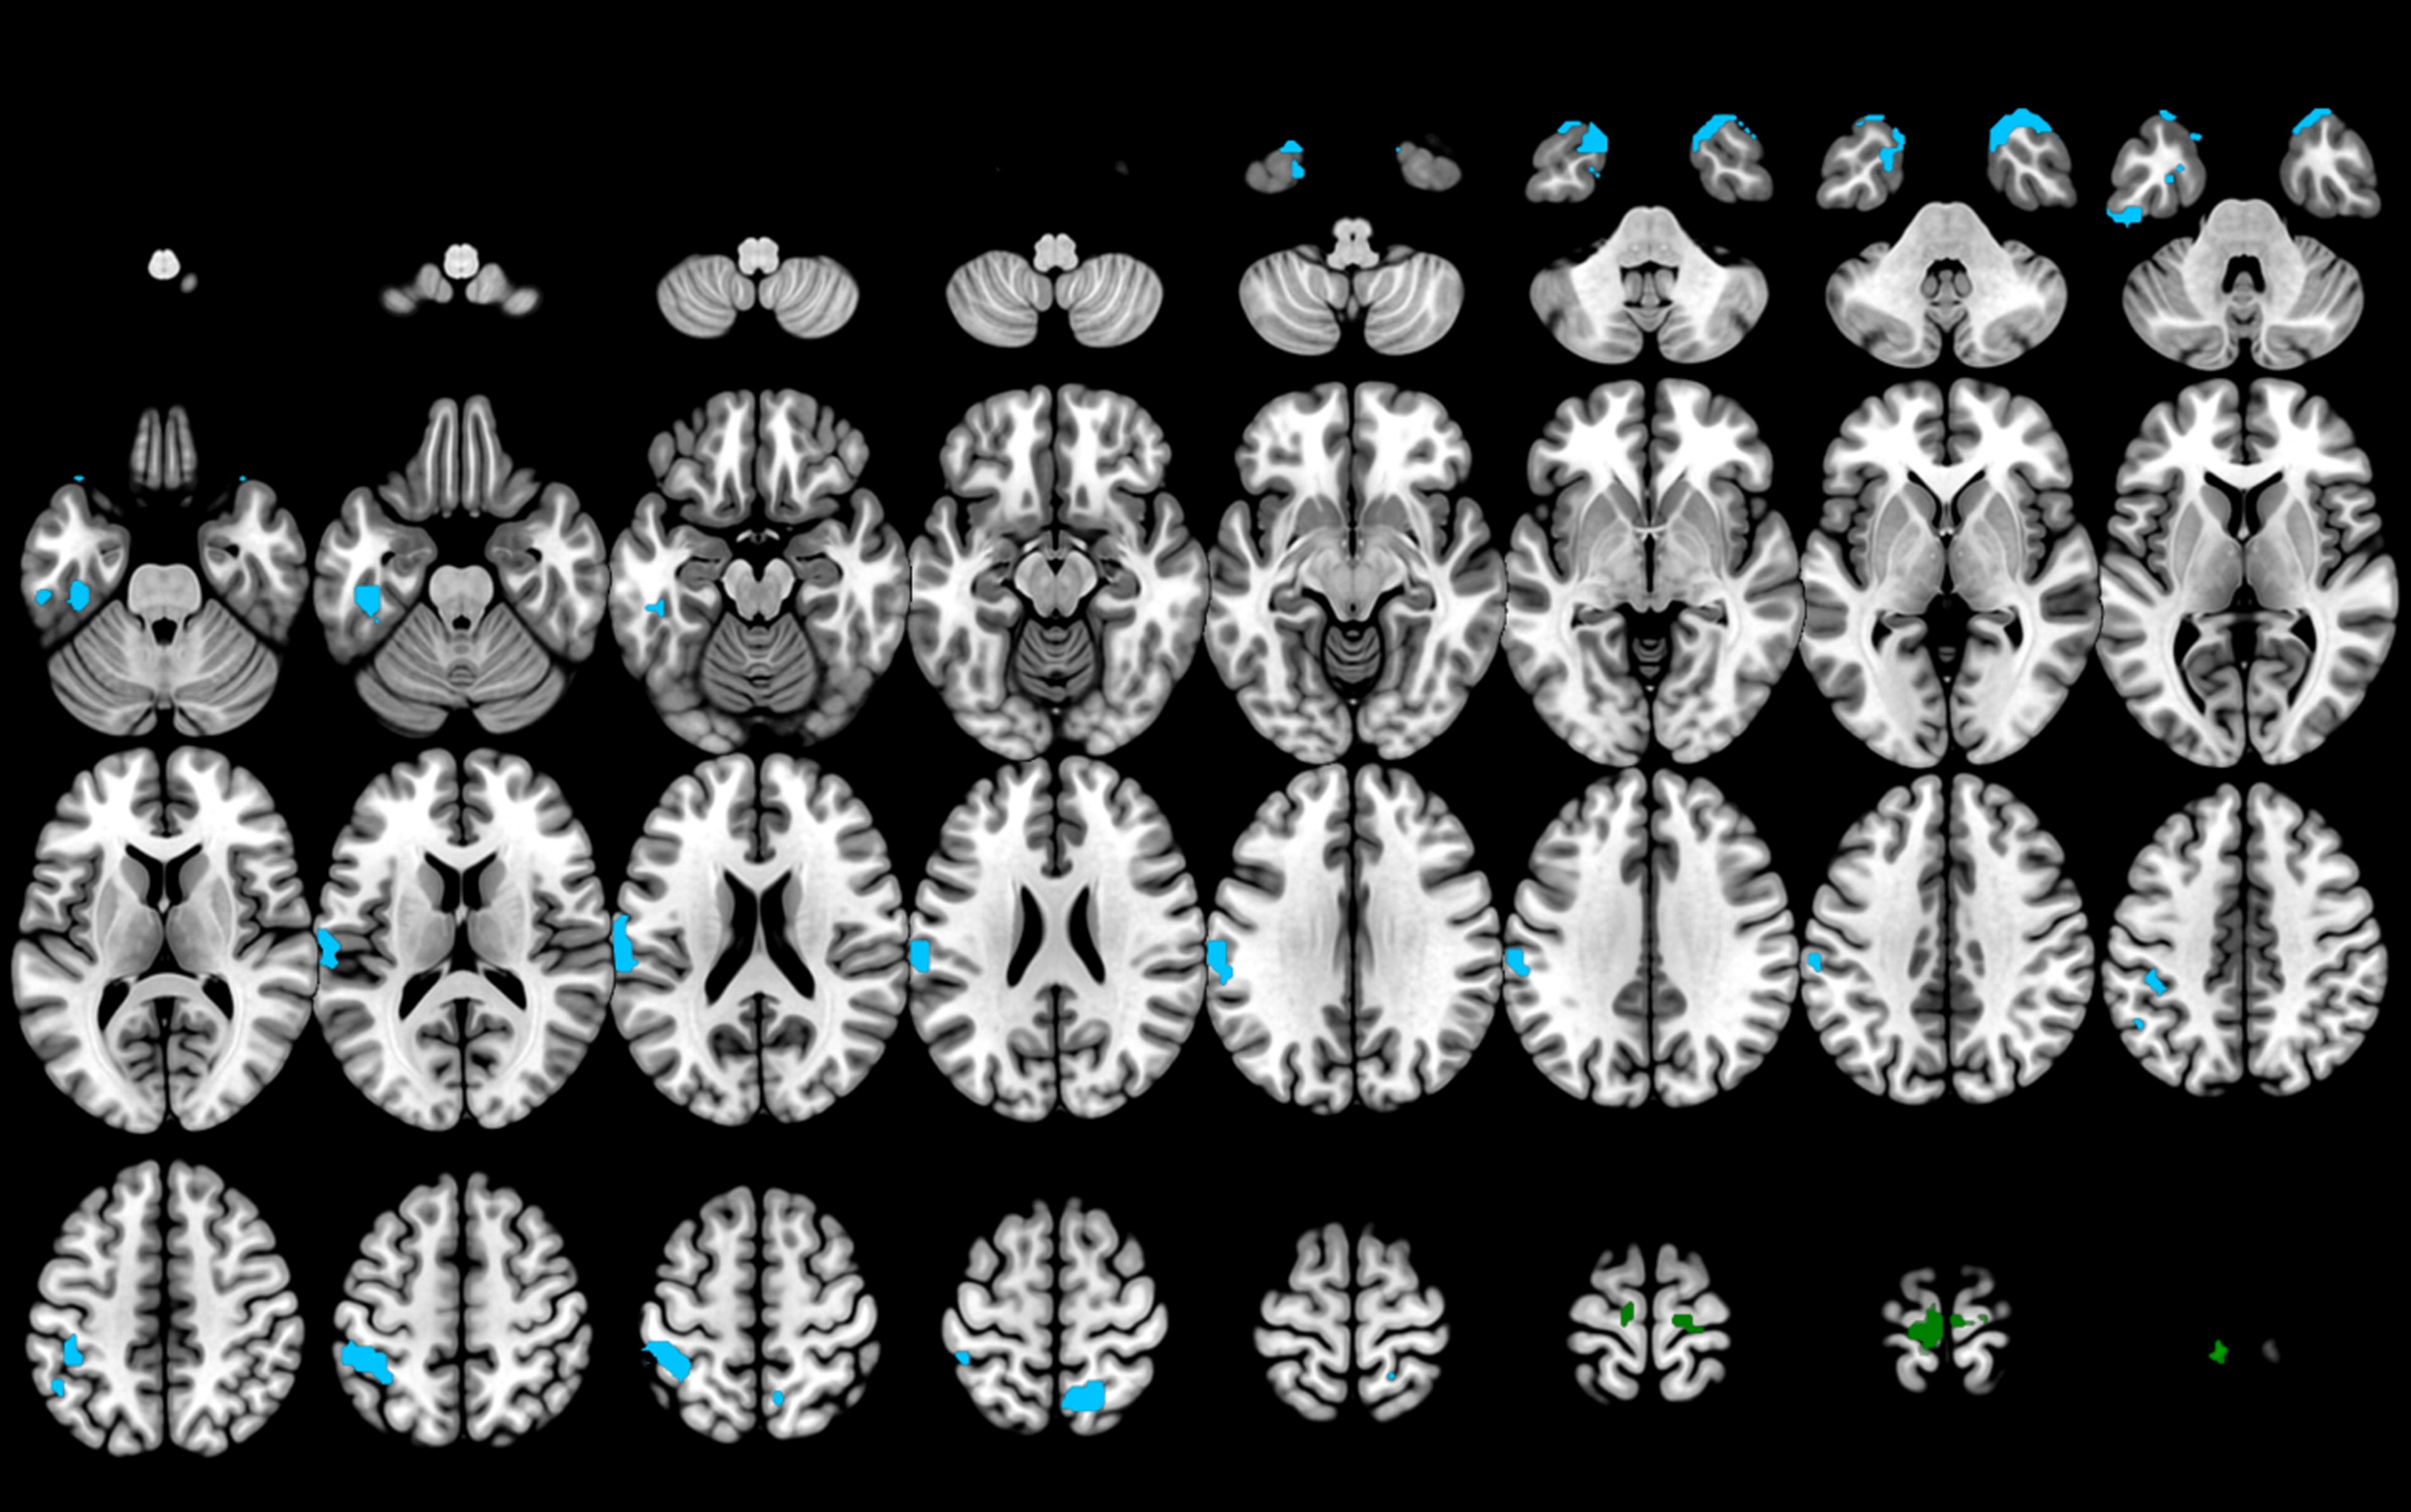
The brain regions of BEN and ReHo in patients. The green represents the regions of BEN. The blue represents the location of ReHo in the brain. BEN, brain entropy; ReHo, regional homogeneity.
Results of BEN/ALFF, BEN/ReHo
The patients showed an increased ratio of SampEn/ALFF in the left precuneus (MNI[−15,−39,81], cluster size: 12, t = 3.6413), along with a reduced ApEn/ALFF ratio in left temporal middle (MNI[−69,−18,−18], cluster size: 12, t = −3.3656), and left putamen (MNI[−27,−6,−3], cluster size: 12, t = −3.5818). The voxel clusters reached a significance level of p < 0.01, with FWE correction at p < 0.05 (refer to Figs. 6–8).

The results of BEN/ALFF and BEN/Reho between the two groups.

The patients showed an increased ratio of SampEn/ALFF in the left precuneus. L, left; R, right. ALFF, amplitude of low frequency fluctuation; SampEn, sample entropy.
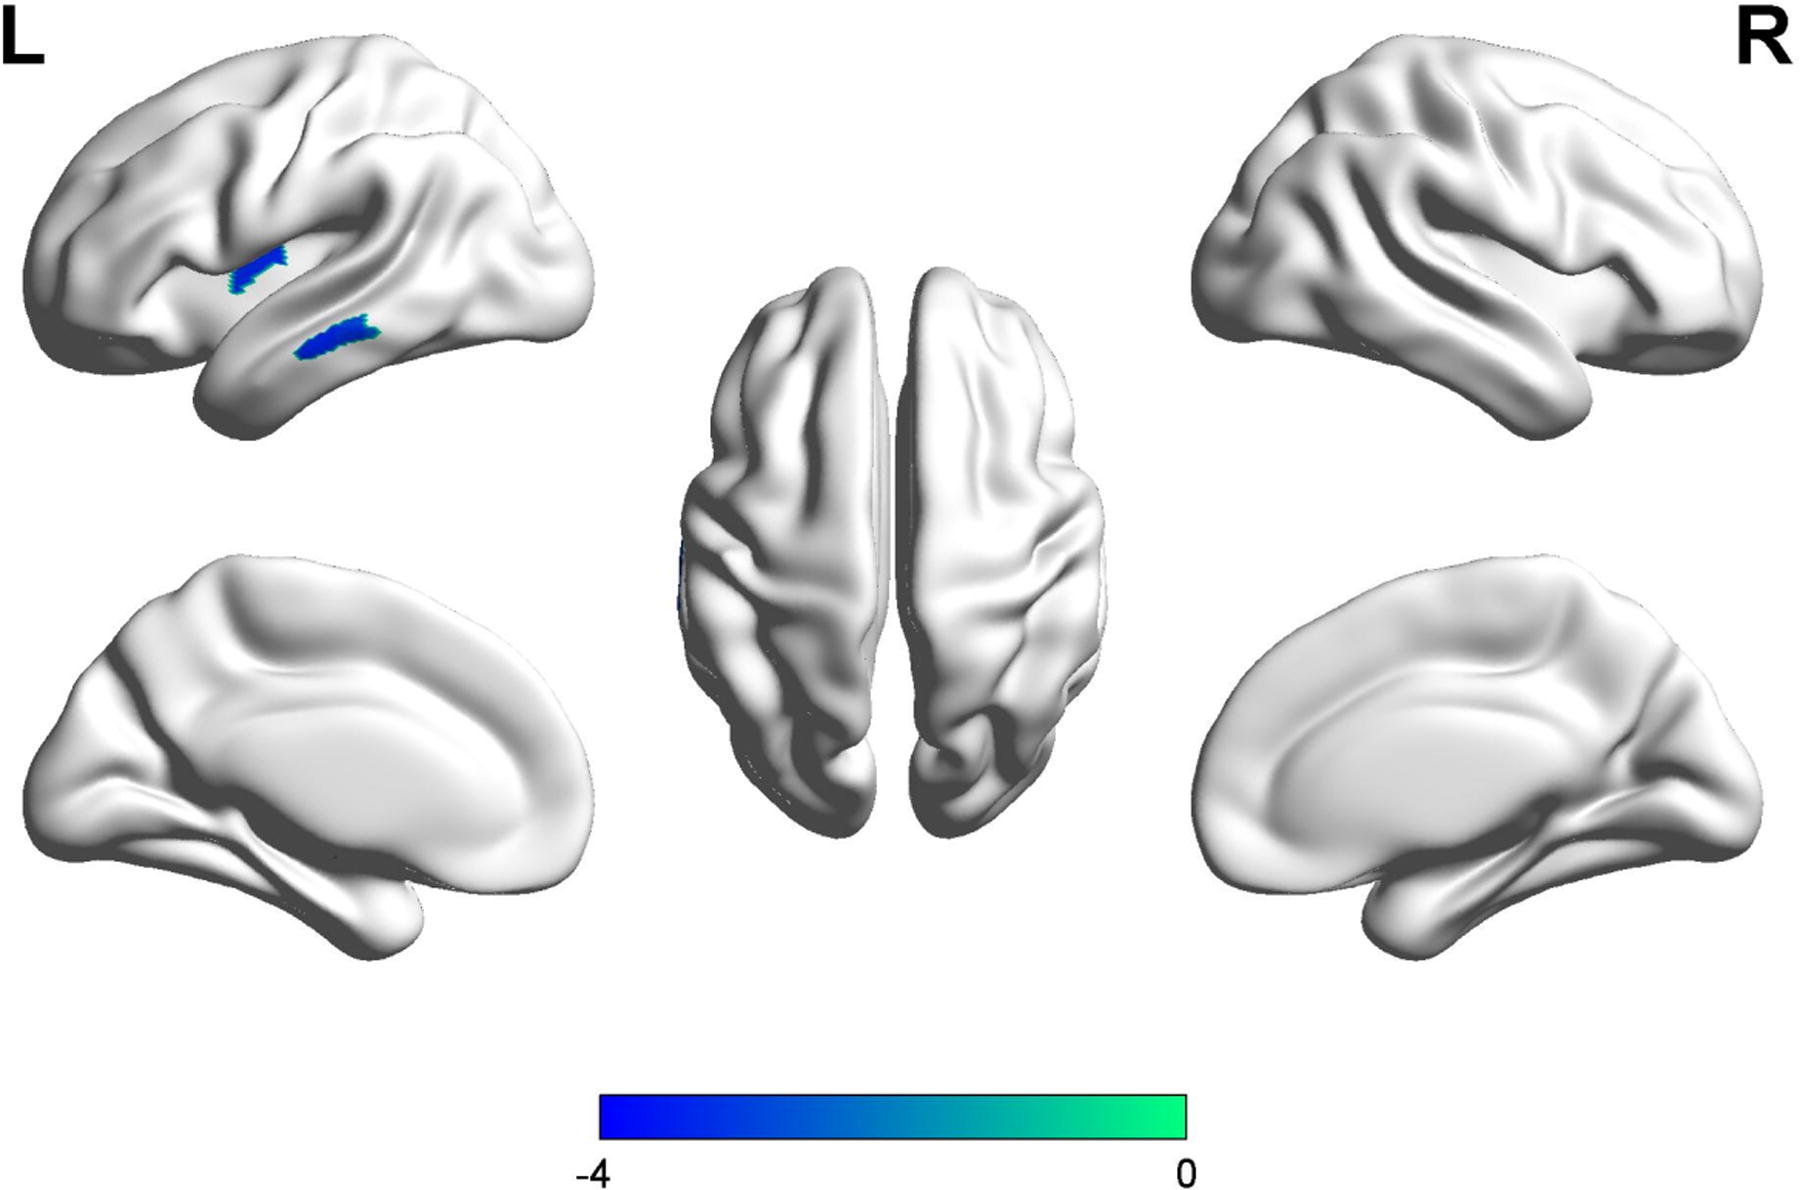
The patients showed a decreased ratio of ApEn/ReHo in the left temporal middle and the left putamen. L, left; R, right. ApEn, approximate entropy; ReHo, regional homogeneity.
Correlation analysis between BEN, BEN/ALFF, BEN/ReHo, and cognition
The correlation results are presented in Figure 9. In the patient group, lower ApEn values in the left paracentral lobule exhibited a moderate positive correlation with AVLT-study (r = 0.37, p = 0.045), AVLT-immediate (r = 0.37, p = 0.049), as well as AVLT-delay (r = 0.42, p = 0.022), while showing a moderate negative correlation with CTT 1 (r = −0.48, p = 0.006). Only the CTT 1 remained correlated with the ApEn values of the left paracentral lobule after Bonferroni correction (p < 0.05/4 = 0.0125). Furthermore, lower ApEn values in the right precentral were positively correlated with AVLT-delay (r = 0.49, p = 0.008) and negatively with CTT 1 (r = −0.40, p = 0.03). After Bonferroni correction (p < 0.05/2 = 0.025), only the relationship between AVLT-delay and ApEn values of the right precentral region remained statically significant. Decreased values in the left paracentral lobule were positively correlated with AVLT-immediate (r = 0.38, p = 0.042) and AVLT-delay (r = 0.41, p = 0.029), but negatively correlated with CTT 1 (r = −0.41, p = 0.021) for SampEn analysis. These findings suggest that a reduction in entropy within sensorimotor brain regions is associated with memory and executive function. However, the significant results did not survive after the Bonferroni correction (p < 0.05/3 = 0.017). Regarding the ratios, there was a positive correlation between increased SampEn/ALFF values in the left precuneus and CTT 1 (r = 0.45, p = 0.011). Conversely, decreased ApEn/ReHo values in the left putamen exhibited a negative correlation with CTT 2 (r = −0.38, p = 0.031), while no significant correlation was observed between ApEn/ReHo values in the left middle temporal region and cognition.
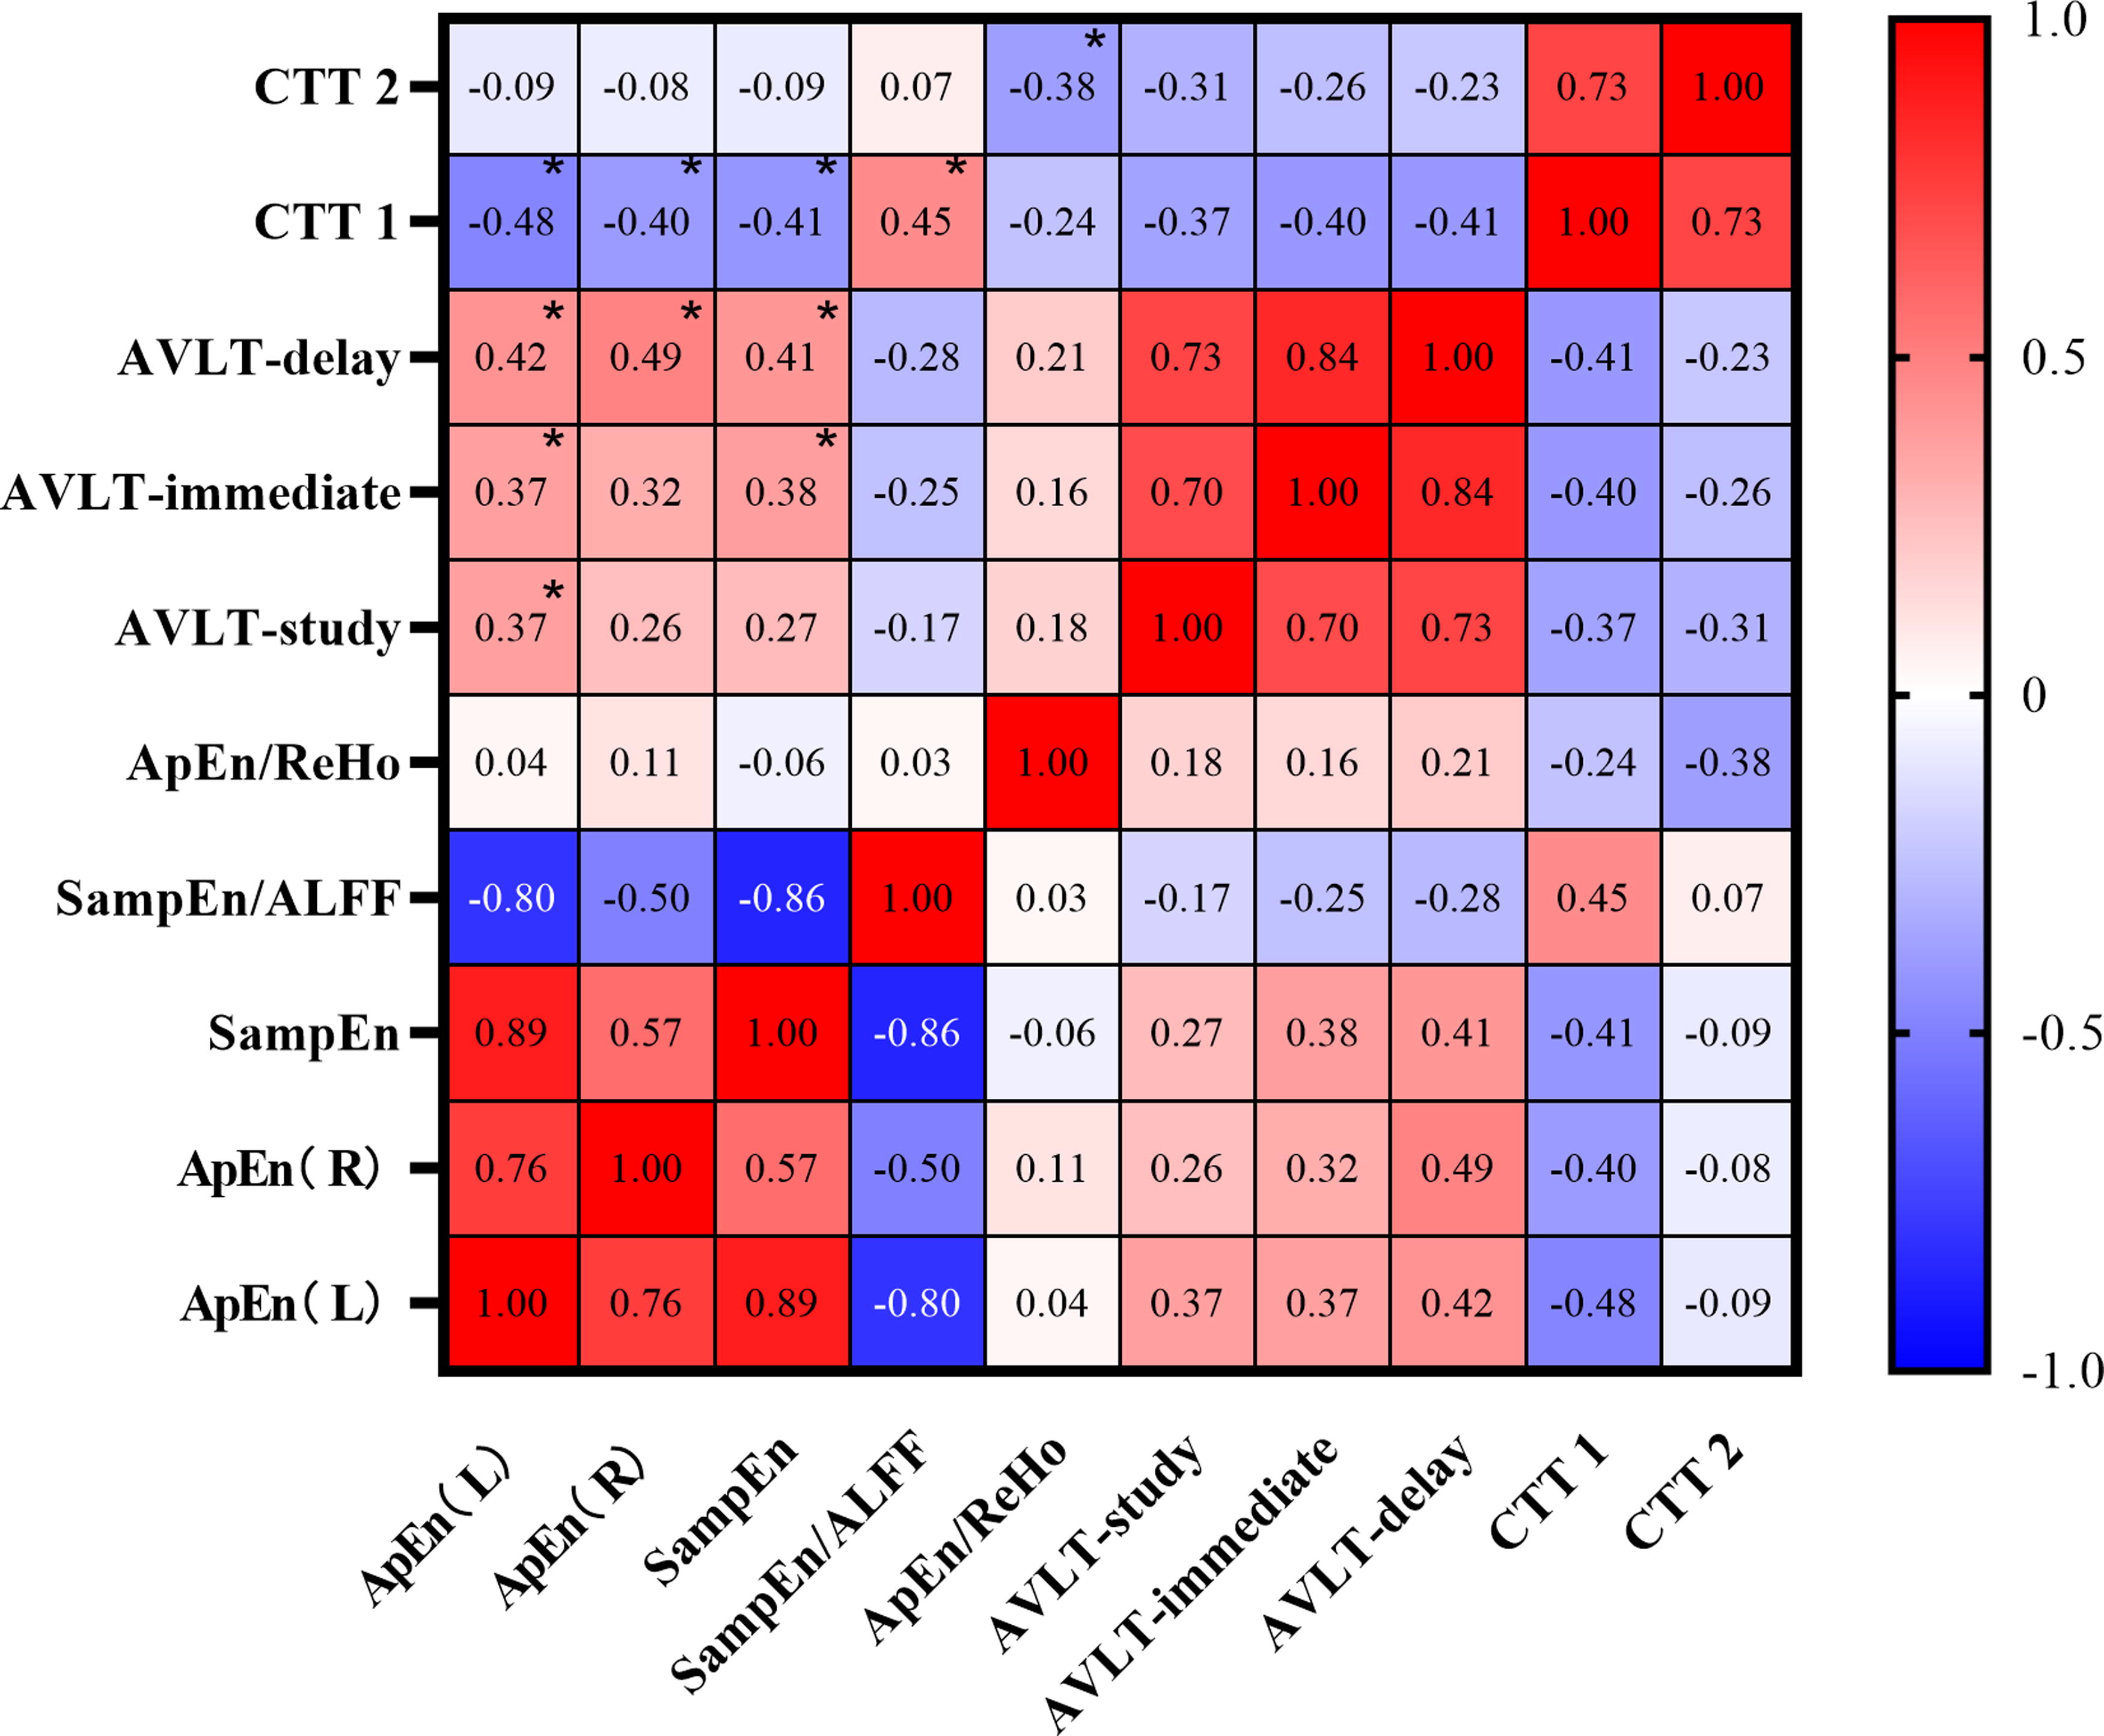
The correlation analysis between brain biomarkers and cognitive function.
Classification performance
The classification results for the features of BEN, BEN/ALFF, and BEN/ReHo are depicted in Figure 10. SVM analysis achieved an accuracy of 74.64%, sensitivity of 86.49%, and specificity of 61.76%. The area under the receiver operating characteristic (ROC) curve was calculated as 0.8243 (confidence interval = 95%, p < 0.0001).
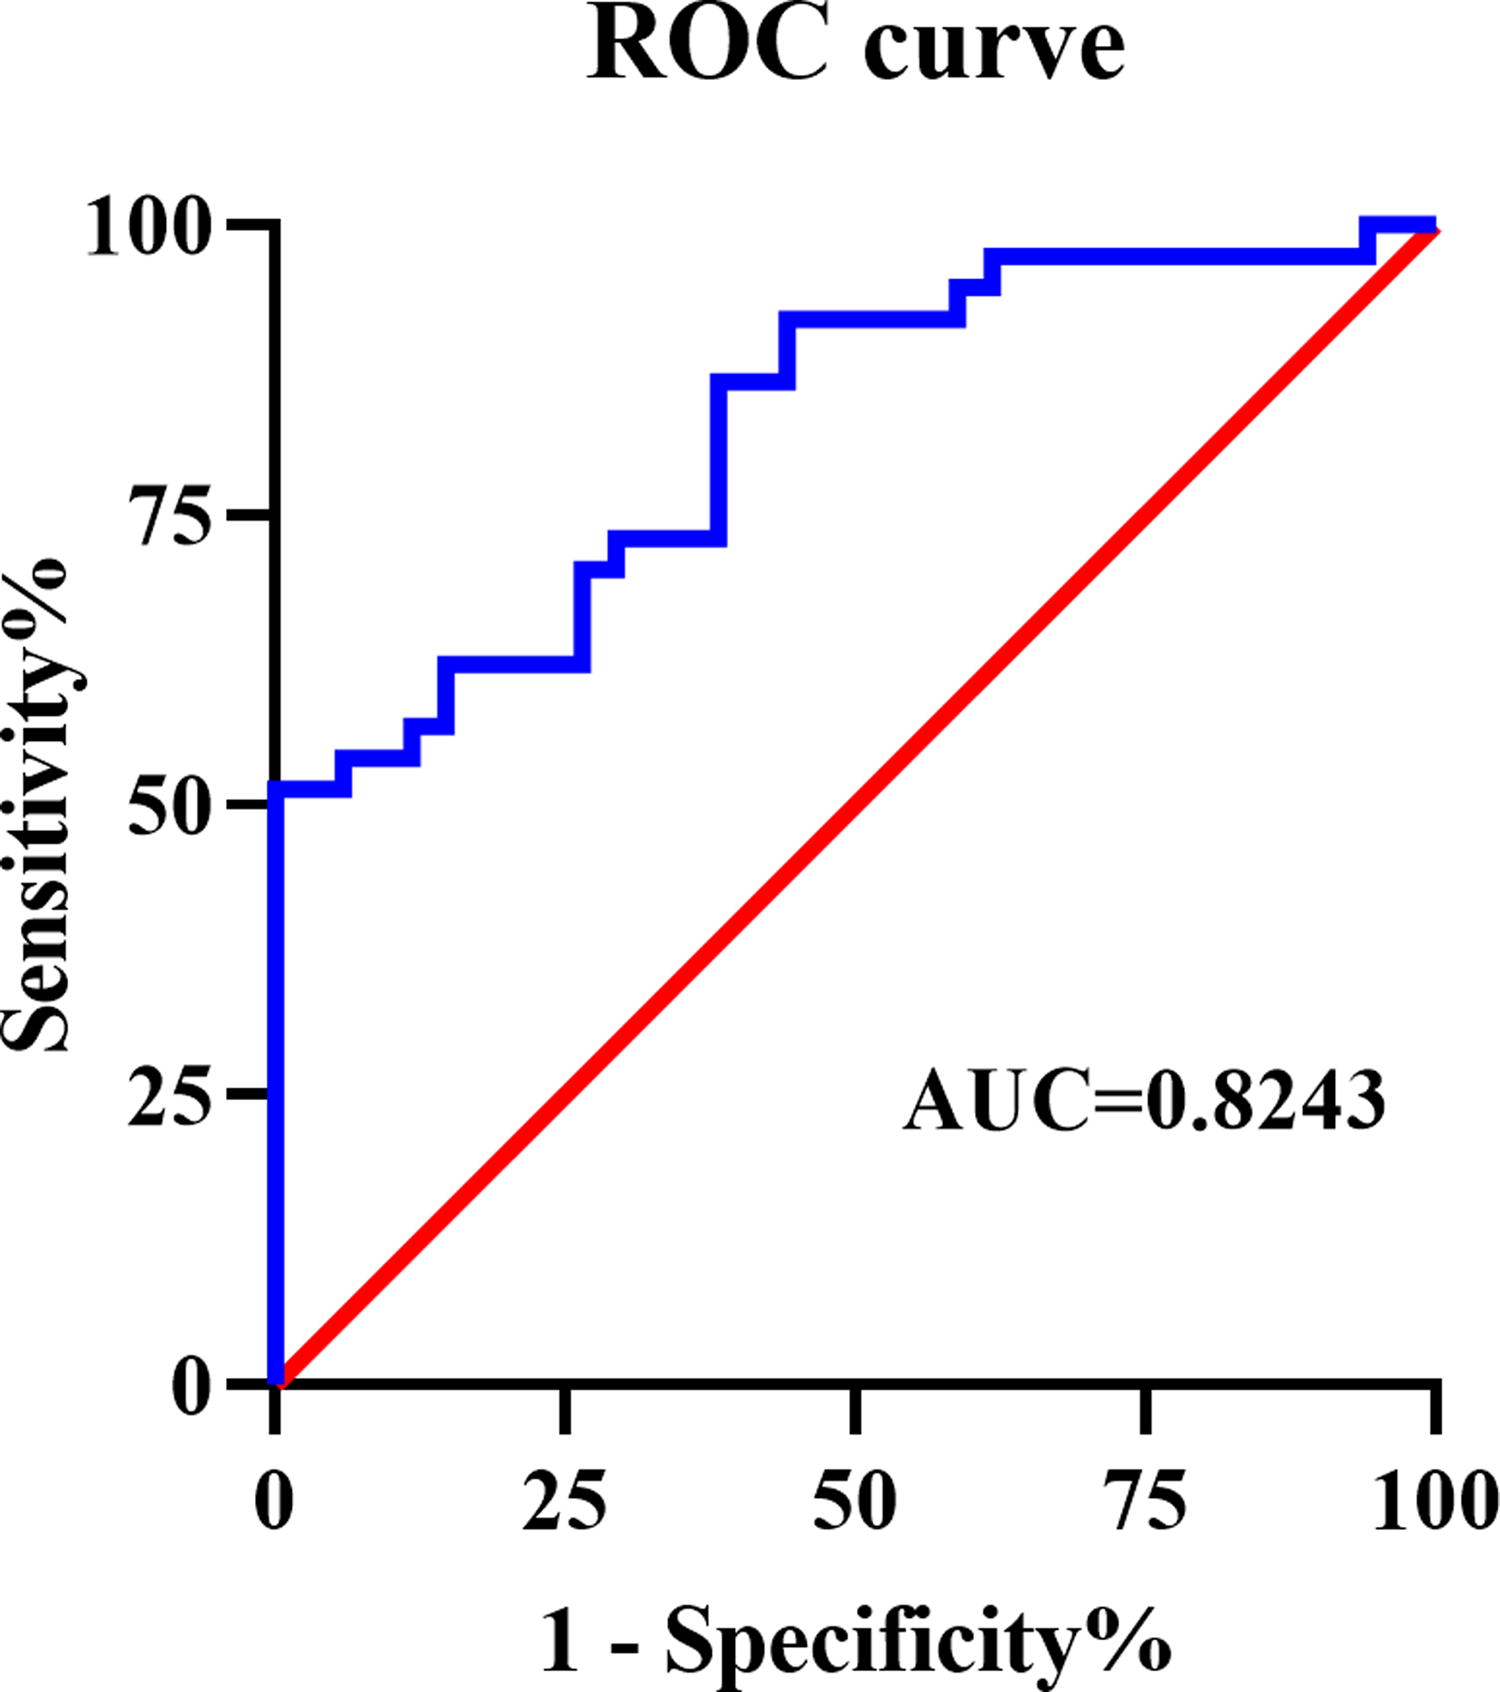
The ROC curve for CSVD patients with cognitive impairment vs HCs of SVM classification. SVM analysis achieved 74.64% in accuracy, 86.49% in sensitivity, and 61.76% in specificity. The area under the ROC curve was 0.8243. CSVD, cerebral small vessel disease; HCs, healthy controls; SVM, support vector machine.
Discussion
To the best of our knowledge, this study represents the first attempt to investigate entropy as a novel measure for assessing the complexity of brain activities to elucidate the underlying mechanism of cognitive impairment in patients with CSVD. Our findings demonstrated that CSVD patients exhibited reduced entropy levels in sensorimotor regions compared with HCs, which was significantly associated with poorer cognitive function, primarily affecting memory and executive function.
These findings align with the theory proposed by Lipsitz and Goldberger. Interestingly, these regions were situated in the sensorimotor area, indicating that decreased information processing capacity or low information content in the sensorimotor area is correlated with the deterioration of cognitive function. The sensorimotor area is mainly involved in sensorimotor function (Cassady et al., 2019). Limited research has indicated its association with cognition. Lang et al. found that degeneration in the sensorimotor network contributed to the dysexecutive cognitive profile in idiopathic Parkinson’s disease patients (Lang et al., 2019). In another study, Crockett, using lesion brain mapping, discovered that disruption to the sensorimotor network (SMN), as a result of WMHs, was correlated with poor global cognition, which may underlie deficits in global cognition in older adults with CSVD (Crockett et al., 2021). Bagarinao and colleagues also identified that SMN was critical to general cognitive performance in aging individuals (Bagarinao et al., 2019). More importantly, our findings are consistent with a recent large-scale study that even after controlling for the physiological effects, BEN still showed regional associations with total cognition composite score, including positive associations in the sensorimotor system (Del Mauro and Wang, 2023). This implies that the reduction of BEN in sensorimotor areas was associated with cognitive deterioration. Despite the verification of our study, previous studies did not fully elucidate the underlying mechanisms linking the sensorimotor system and cognition. Here, we propose the following explanations.
Many studies have indicated that sensory and motor functions were correlated with cognitive function. Previous studies have confirmed a distinct association between cognition and gait in general (Verlinden et al., 2014) and compared with nondecliners who did not show gait or cognition decline in longitudinal follow-up, the risk of dementia was higher in those experiencing both gait and cognition decline (Collyer et al., 2022). Researchers have also proposed that physical activity could enhance cognition during both early and late stages of the lifespan (Nuzum et al., 2020), as well as in older adults with mild cognitive impairment or dementia (Erickson et al., 2019). In a systematic review, Parisi reported that, in poststroke patients, multisensory technology which refers to an approach that stimulates a person’s tactile, auditory, kinesthetic, and visual modalities proved to be effective for cognitive improvement compared to standard treatment (Parisi et al., 2022). The existing findings and our study are in concordant with theories of embodied cognition. Embodied cognition is a theoretical perspective that considers every form of human knowledge and cognition “embodied,” as they pass through bodily experience (Maggio et al., 2022). Briefly, embodied cognition suggests that physical properties of the human body, particularly the perceptual and motor systems, play an important role in cognition. It posits that the body influences the mind just as the mind influences the body (Madan and Singhal, 2012). According to the theory of embodied cognition, our findings reinforce the notion that sensory and motor components are at the core of cognitive processes (Wilson, 2002). On the other hand, our study provides new insights into understanding the cause of cognitive disorder in CSVD patients, proposing that enhancements in sensory and motor abilities may have potential benefits for cognitive performance. Another plausible explanation is that alterations in the functioning of the sensorimotor system may exert an influence on the activity of remote brain regions, thereby modulating cognitive function. This hypothesis gains credibility from the interconnected nature of the brain rather than its isolation. Baumgartner’s findings, which provided in vivo evidence that remote sensorimotor stroke modifies the activity of hippocampal–thalamic networks, can support our conjecture (Baumgartner et al., 2018). Further studies should be implemented to explore whether exists neurophysiological alterations in remote regions that are functionally connected to the sensorimotor area cause cognitive impairment in CSVD patients. Another question pertains to how reduced brain entropy occurs in CSVD-related cognitive disorder. According to Lipsitz, there were two mechanistically reasons: (1) a loss or impairment of structural and functional component; and/or (2) altered nonlinear coupling between these components (Lipsitz and Goldberger, 1992). Regarding the first reason, CSVD is now regarded as a disconnection syndrome in both structure and function (Ter Telgte et al., 2018), which may be an underlying reason for changes in brain entropy. We will elucidate the association between structural and functional changes with brain entropy in the future. In addition, alternative methods should be explored to examine the modified nonlinear coupling between different brain regions.
Another important finding is that entropy represents a unique signature of brain activity compared with ALFF and ReHo, as there was little overlap in brain regions among the three results. BEN as a novel biomarker of various brain disorders can be modulated by stimulation (Chang et al., 2018b; Jordan et al., 2023; Song et al., 2019b), drug medication (Liu et al., 2020), and caffeine (Chang et al., 2018a). It may serve as a potential measure to evaluate the effects of treatment in CSVD patients with cognitive impairment. As we anticipated, the ratios can convey supplementary messages. We identified three cognitive-related brain regions associated with these ratios: one exhibited a positive correlation indicating an increase in the ratio, while the remaining two demonstrated negative correlations, suggesting a reduction. The positive cluster was located in the sensorimotor area, where both SamEn and ALFF were reduced in CSVD patients, suggesting that the common reduction of SamEn and ALFF contributed to the increased ratio compared with HCs. The other two negative brain regions, without significant intergroup differences in ApEn and ReHo, showed significant differences in ApEn/ReHo between patients and controls. Further ROI-based analyses demonstrated that these two regions exhibit both relatively lower ApEn and ReHo in patients than in HCs (data not shown), indicating a smaller decrease in ApEn compared with ReHo. Conversely, several regions with significant intergroup differences in ApEn and ReHo did not show significant differences in their ratios between the two groups. Taken together, these findings indicated that BEN, BEN/ALFF, and BEN/Reho can provide complementary information and should be jointly used to reveal pathological changes in CSVD patients. In the present study, we also used SVM analysis that considered BEN, BEN/ALFF, and BEN/ReHo as features for classifying CSVD patients with cognitive impairment and HCs. This analysis showed good classification performance, providing substantial support to our hypothesis.
Some limitations should be considered in the present study. First, our sample size is relatively small, necessitating larger cohorts in future studies to validate our findings. Second, owing to the cross-sectional design of this study, we are unable to establish a causal relationship between clinical symptoms and brain imaging changes. Further longitudinal investigations are warranted for definitive conclusions. Third, it is essential to include different subtypes of vascular lesions to elucidate their impact on the pathophysiology of this condition. We did not consider the influence of various lesions on BEN. Fourth, although the cluster size of SamEn is less than 10, we have retained these results as our correction method adheres strictly. Fifth, we did not account for other potential confounding factors that could have influenced the outcomes. A previous study reported significant associations between regional BEN and respiratory function, systolic blood pressure, and body mass index (Del Mauro and Wang, 2023). Therefore, future investigations should incorporate these variables into their analyses. Finally, whether BEN is the optimal indicator of dynamicity is still controversial, and further studies are needed to prove its clinical significance.
Conclusion
The present study indicates that the reduction of BEN in the sensorimotor system is related to worse cognition, which is in accordance with embodied cognition. BEN, as a nonlinear measure, provides a new perspective to realize the mechanism and future rehabilitation of CSVD-related cognitive disorder. Combining BEN with the ratios of BEN/ALFF and BEN/ReHo contributes to distinguishing between CSVD patients with cognitive disorder and healthy individuals. This combination provides further insight into the diagnosis of CSVD-related cognitive disorder.
Footnotes
Acknowledgments
The authors are grateful to all participants for their cooperation, and the authors are thankful to the University of Science and Technology of China for providing MRI measurement service.
Data Availability Statement
The raw data of this article are available by contacting the authors.
Authors’ Contributions
Y.Z.: Conceptualization (equal); data analysis (lead); writing-original draft (lead). M.H: Writing-original draft (equal); data analysis (supporting). S.F.: Writing-original draft (supporting); data analysis (equal). S.C.: data collection (lead). B.D.: data collection (supporting). Y.S.: data collection (supporting). L.Z.: Methodology (supporting); writing-review and editing (supporting). Y.H.: Methodology (supporting); writing-review and editing (supporting). K.W.: Conceptualization (lead); writing-review and editing (equal). Q.W.: Methodology (lead); writing-review and editing (lead).
Author Disclosure Statement
The authors have no conflicts of interest to declare.
Funding Information
This study was supported by the