




Abstract
Introduction:
Prediction error (PE) is key to perception in the predictive coding framework. However, previous studies indicated the varied neural activities evoked by PE in tinnitus patients. Here, we aimed to reconcile the conflict by (1) a more nuanced view of PE, which could be driven by changing stimulus (stimulus-driven PE [sPE]) and violation of current context (context-driven PE [cPE]) and (2) investigating the aberrant connectivity networks that are engaged in the processing of the two types of PEs in tinnitus patients.
Methods:
Ten tinnitus patients with normal hearing and healthy controls were recruited, and a local-global auditory oddball paradigm was applied to measure the electroencephalographic difference between the two groups during sPE and cPE conditions.
Results:
Overall, the sPE condition engaged bottom-up and top-down connections, whereas the cPE condition engaged mostly top-down connections. The tinnitus group showed decreased sensitivity to the sPE and increased sensitivity to the cPE condition. Particularly, the auditory cortex and posterior cingulate cortex were the hubs for processing cPE in the control and tinnitus groups, respectively, showing the orientation to an internal state in tinnitus. Furthermore, tinnitus patients showed stronger connectivity to the parahippocampus and pregenual anterior cingulate cortex for the establishment of the prediction during the cPE condition.
Conclusion:
These results begin to dissect the role of changes in stimulus characteristics versus changes in the context of processing the same stimulus in mechanisms of tinnitus generation.
Impact Statement
This study delves into the number dynamics of prediction error (PE) in tinnitus, proposing a dual framework distinguishing between stimulus-driven PE (sPE) and context-driven PE (cPE). Electroencephalographic data from tinnitus patients and controls revealed distinct connectivity patterns during sPE and cPE conditions. Tinnitus patients exhibited reduced sensitivity to sPE and increased sensitivity to cPE. The auditory cortex and posterior cingulate cortex emerged as pivotal regions for cPE processing in controls and tinnitus patients, indicative of an internal state orientation in tinnitus. Enhanced connectivity to the parahippocampus and pregenual anterior cingulate cortex underscores the role of context in tinnitus pathophysiology.
Introduction
Prediction error (PE) is the mismatch between sensory input and its internal prediction generated from our previous experience (Knill and Pouget, 2004). As per the predictive coding framework, the brain is constantly minimizing PEs to optimize the internal model for better prediction of its environment (Friston, 2008). Prediction from a higher hierarchical level is encoded and sent to a lower level, whereas the PEs that emerge from the lower level will be delivered back to the higher levels for updating the prediction in order to minimize PEs. For instance, PEs are obtained when a standard, predictable stimulus (e.g., tone played 75% of the time) is interspersed with a deviant, unpredictable stimulus (e.g., noise played 25% of the time) (Garrido et al., 2009). Such a PE could be termed a stimulus-driven PE (sPE) because the deviant stimulus differs from the standard, not just in probability but also in stimulus characteristics. However, it is also possible to obtain a context-driven PE (cPE) by comparing the neural response with the same stimulus (e.g., tone) when played in two different scenarios (75% vs. 25% probability). Furthermore, cPEs reflect a more “global” effect of PE changes, which links more to the violation of expected regularity (Sergent et al., 2005). Recent accounts have articulated PEs as variates across stimuli and contexts that also interact with each other (Bekinschtein et al., 2009; Feldman and Friston, 2010; Wacongne et al., 2011). Yet, the difference in cortical processes involving the two types of PEs remains debatable. In this work, we sought to compare the dynamic neural network underlying the modulation of sPE and cPE and how they can explain the mechanism of phantom perceptions.
The neural responses of auditory PEs have been well established by subtracting the evoked activity of a deviant stimulus from that of a standard (Bekinschtein et al., 2009; Wacongne et al., 2011). The evoked activity pre-stimulus indicates the auditory prediction of incoming inputs (Partyka et al., 2019). The post-stimulus activities include a mismatch negativity response (MMN), an automatic response due to a change in stimulus characteristics (Garrido et al., 2009; Näätänen et al., 2007), and a late positive potential (P300) that reflects a more complex, attention-driven component of the change in stimulus (Bekinschtein et al., 2009; Polich, 2007). Although the evoked neural responses of sPEs and cPEs have been mostly explored in of event-related potential (ERP), there are only a few studies investigating the neural pathway of how these PEs are communicated between different brain regions in time (Garrido et al., 2007; Phillips et al., 2016), thus requiring further investigation.
In previous research, we showed changes in an auditory PE network during PE processing for the tinnitus group, consisting of the parahippocampus (PHC), auditory cortex (AC), pregenual anterior cingulate cortex (pgACC), dorsal anterior cingulate cortex (dACC), and posterior cingulate cortex (PCC) (Mohan et al., 2022). The PHC plays an important role in auditory memory encoding and retrieval and in predicting incoming stimuli (Aminoff et al., 2013; Pearson et al., 2011). The dACC is an important region identified in the error-monitoring literature, particularly for novelty detection (Clark et al., 2000), which occupies a higher level in the PE hierarchy. The pgACC has been identified as part of the auditory top-down “noise cancellation” system (Rauschecker et al., 2010; Rauschecker et al., 2015), and the PCC, which is the core hub of the default mode network (DMN), is indicated to be activated when PE is detected (Leech and Sharp, 2014; Mohan et al., 2022; Pearson et al., 2011). From a neural oscillation perspective, PE is fed forward in the theta frequency band (4–7.5 Hz) (Recasens et al., 2018), which plays a role in the processing of novel stimuli (Hsiao et al., 2009; Ko et al., 2012). Although predictions of upcoming stimuli are fed back through alpha (8–12 Hz) connectivity (Recasens et al., 2018), oscillations in the alpha band also link with the active inhibition modulation that is also influenced by top-down regulation based on context and previous experience (Alamia and VanRullen, 2019; Jensen et al., 2012).
Spatiotemporal neural responses of sPEs and cPEs and how they are communicated between the regions of the PE network can be used to study the mechanism of action of chronic phantom percepts such as tinnitus. For a long time, tinnitus has been explained under the predictive coding framework (De Ridder et al., 2014; Hullfish et al., 2019; Sedley et al., 2016). Under this theory, tinnitus is regarded as a maladaptive compensation of PEs, where PEs are either generated through changes in the incoming sensory information as a result of maladaptive changes in the auditory system (Sedley et al., 2016) or owing to relatively strong top-down priors generated by the auditory memory and noise-cancelling mechanisms (De Ridder et al., 2014). For those with hearing loss but no tinnitus, their noise gating system is hypothesized to successfully minimize the PE by suppressing the increased neural noise, whereas for those with tinnitus but normal hearing, the deficient noise cancellation system fails to inhibit (or falsely relay) the irrelevant neural noise to the sensory cortex (Leaver et al., 2011; Rauschecker et al., 2010), where the PE is minimized by active adaptation. Recently, there is growing empirical evidence for this theory. Recent findings of changes in MMN and P300 responses in tinnitus patients indicated their sensitivity to PEs (Mohan et al., 2022; Sedley et al., 2019). However, it is still not clear if the generation of tinnitus or any phantom perception may be bottom up, i.e., sensitive to changes in input, as suggested by a lot of the previous literature (Noreña and Farley, 2013; Schaette and McAlpine, 2011), to be driven by changes to the sensory pathways or if it is more top-down, i.e., sensitive to changes in the context in which the same stimulus is processed. Therefore, by examining sPEs and cPEs, we may attempt to answer these questions.
Here, we aimed to investigate the network connectivity that is associated with aberrant processing of PEs in tinnitus patients with slight audiometric hearing loss. We hypothesized that (1) distinct time-varying connectivity networks would be observed in processing sPE and cPE and (2) compared with the control group, tinnitus patients would manifest aberrant connectivity networks in processing sPE and cPE, especially centered around PHC, pgACC, and PCC as suggested by the previous studies (Mohan et al., 2022; Vanneste et al., 2019). Based on the theory above that patients with little changes in the auditory pathways exhibit changes in top-down processing, we expect tinnitus patients in the current study to be more sensitive to top-down PEs a.k.a. cPEs (De Ridder et al., 2014; Vanneste et al., 2019). This is not only a systematic approach to exploring the dynamic PE network and its perceptual consequence in tinnitus but also a foundational step to understanding the mechanism of action of the phantom percepts in other modalities (De Ridder et al., 2014; Mohan and Vanneste, 2017).
Methods
Participants
Ten tinnitus participants whose tinnitus lasted more than 1 year were recruited in this study. Ten healthy controls were recruited from the local community. The sample is based on our previously published study (Mohan et al., 2022). The two groups were matched for age, gender, and hearing loss. All participants’ hearing thresholds were measured using pure-tone audiometry. Those who showed a hearing threshold larger than 30 dB HL at any frequency were excluded from the study. The other exclusion criteria included Meniere’s disease, chronic ear infections, otosclerosis, tumors, mental disorders, chronic headaches, and pulsatile tinnitus. All participants gave written consent to participate.
Audiological and behavioral assessments
All participants underwent a pure-tone audiometry test where hearing thresholds at 250, 500, 1000, 2000, 3000, 4000, 6000, and 8000 Hz were obtained according to the procedures prescribed by the British Society of Audiology.
Furthermore, two 10-cm visual analog scales (VAS) were applied to measure the tinnitus loudness and tinnitus-related distress. The two VAS scales were scored from 0 to 10, with 0 of “no tinnitus”/“no distress” and 10 of “as loud as imaginable”/“suicidal levels of distress.” Tinnitus participants also completed a set of questionnaires, including the Tinnitus Handicap Inventory (THI) (Newman et al., 1996) (THI; M ± SD = 29 ± 24.8), Tinnitus Questionnaire (TQ) (Hallam et al., 1988) and Tinnitus Functional Index (TFI) (Meikle et al., 2012), which are also designed to assess tinnitus-related distress and impact on their lives.
Additional audiometric evaluations were conducted within the tinnitus group to ascertain the pitch and loudness of each participant’s tinnitus perception. Two pure tones at varying frequencies were played at 10 dB above the participant’s hearing threshold at those frequencies, and the participant was asked to choose the tone that best matched the pitch of their tinnitus. This selected tone was then played alongside another tone of a different frequency, and the participant repeated the matching process. This procedure was repeated until the frequency that most accurately matched the pitch of the participant’s tinnitus was determined (M = 3361.11 Hz, SD = 2837.01 Hz). The loudness of the tinnitus was established by adjusting the presentation level of the matched tone until the participant indicated that it matched the loudness of their tinnitus. The loudness level was recorded as the difference between the matched level and the audiometric threshold at that frequency in the tested ear. The stimuli for both procedures were presented to the ear opposite the tinnitus ear (or the ear with the more severe tinnitus, in cases of bilateral tinnitus).
Auditory oddball paradigm
The design of the oddball paradigm was adapted from an original study by Wacongne et al. (2011). We applied three sound sequences such that Sequence X included five 500 Hz tones, Sequence Y included four tones and a noise burst, and Sequence Omission included four tones with the fifth stimulus absent (Fig. 1). The tones and noise bursts were 50 ms long with a rise-fall time of 7 ms and an interstimulus interval of 250 ms. The stimuli were presented at 72 dB SPL. All audio files were produced by Cool Edit Pro. As shown in Figure 1, each trial started with a 1250 ms sound sequence followed by a random intertrial jitter between 700 and 1000 ms.
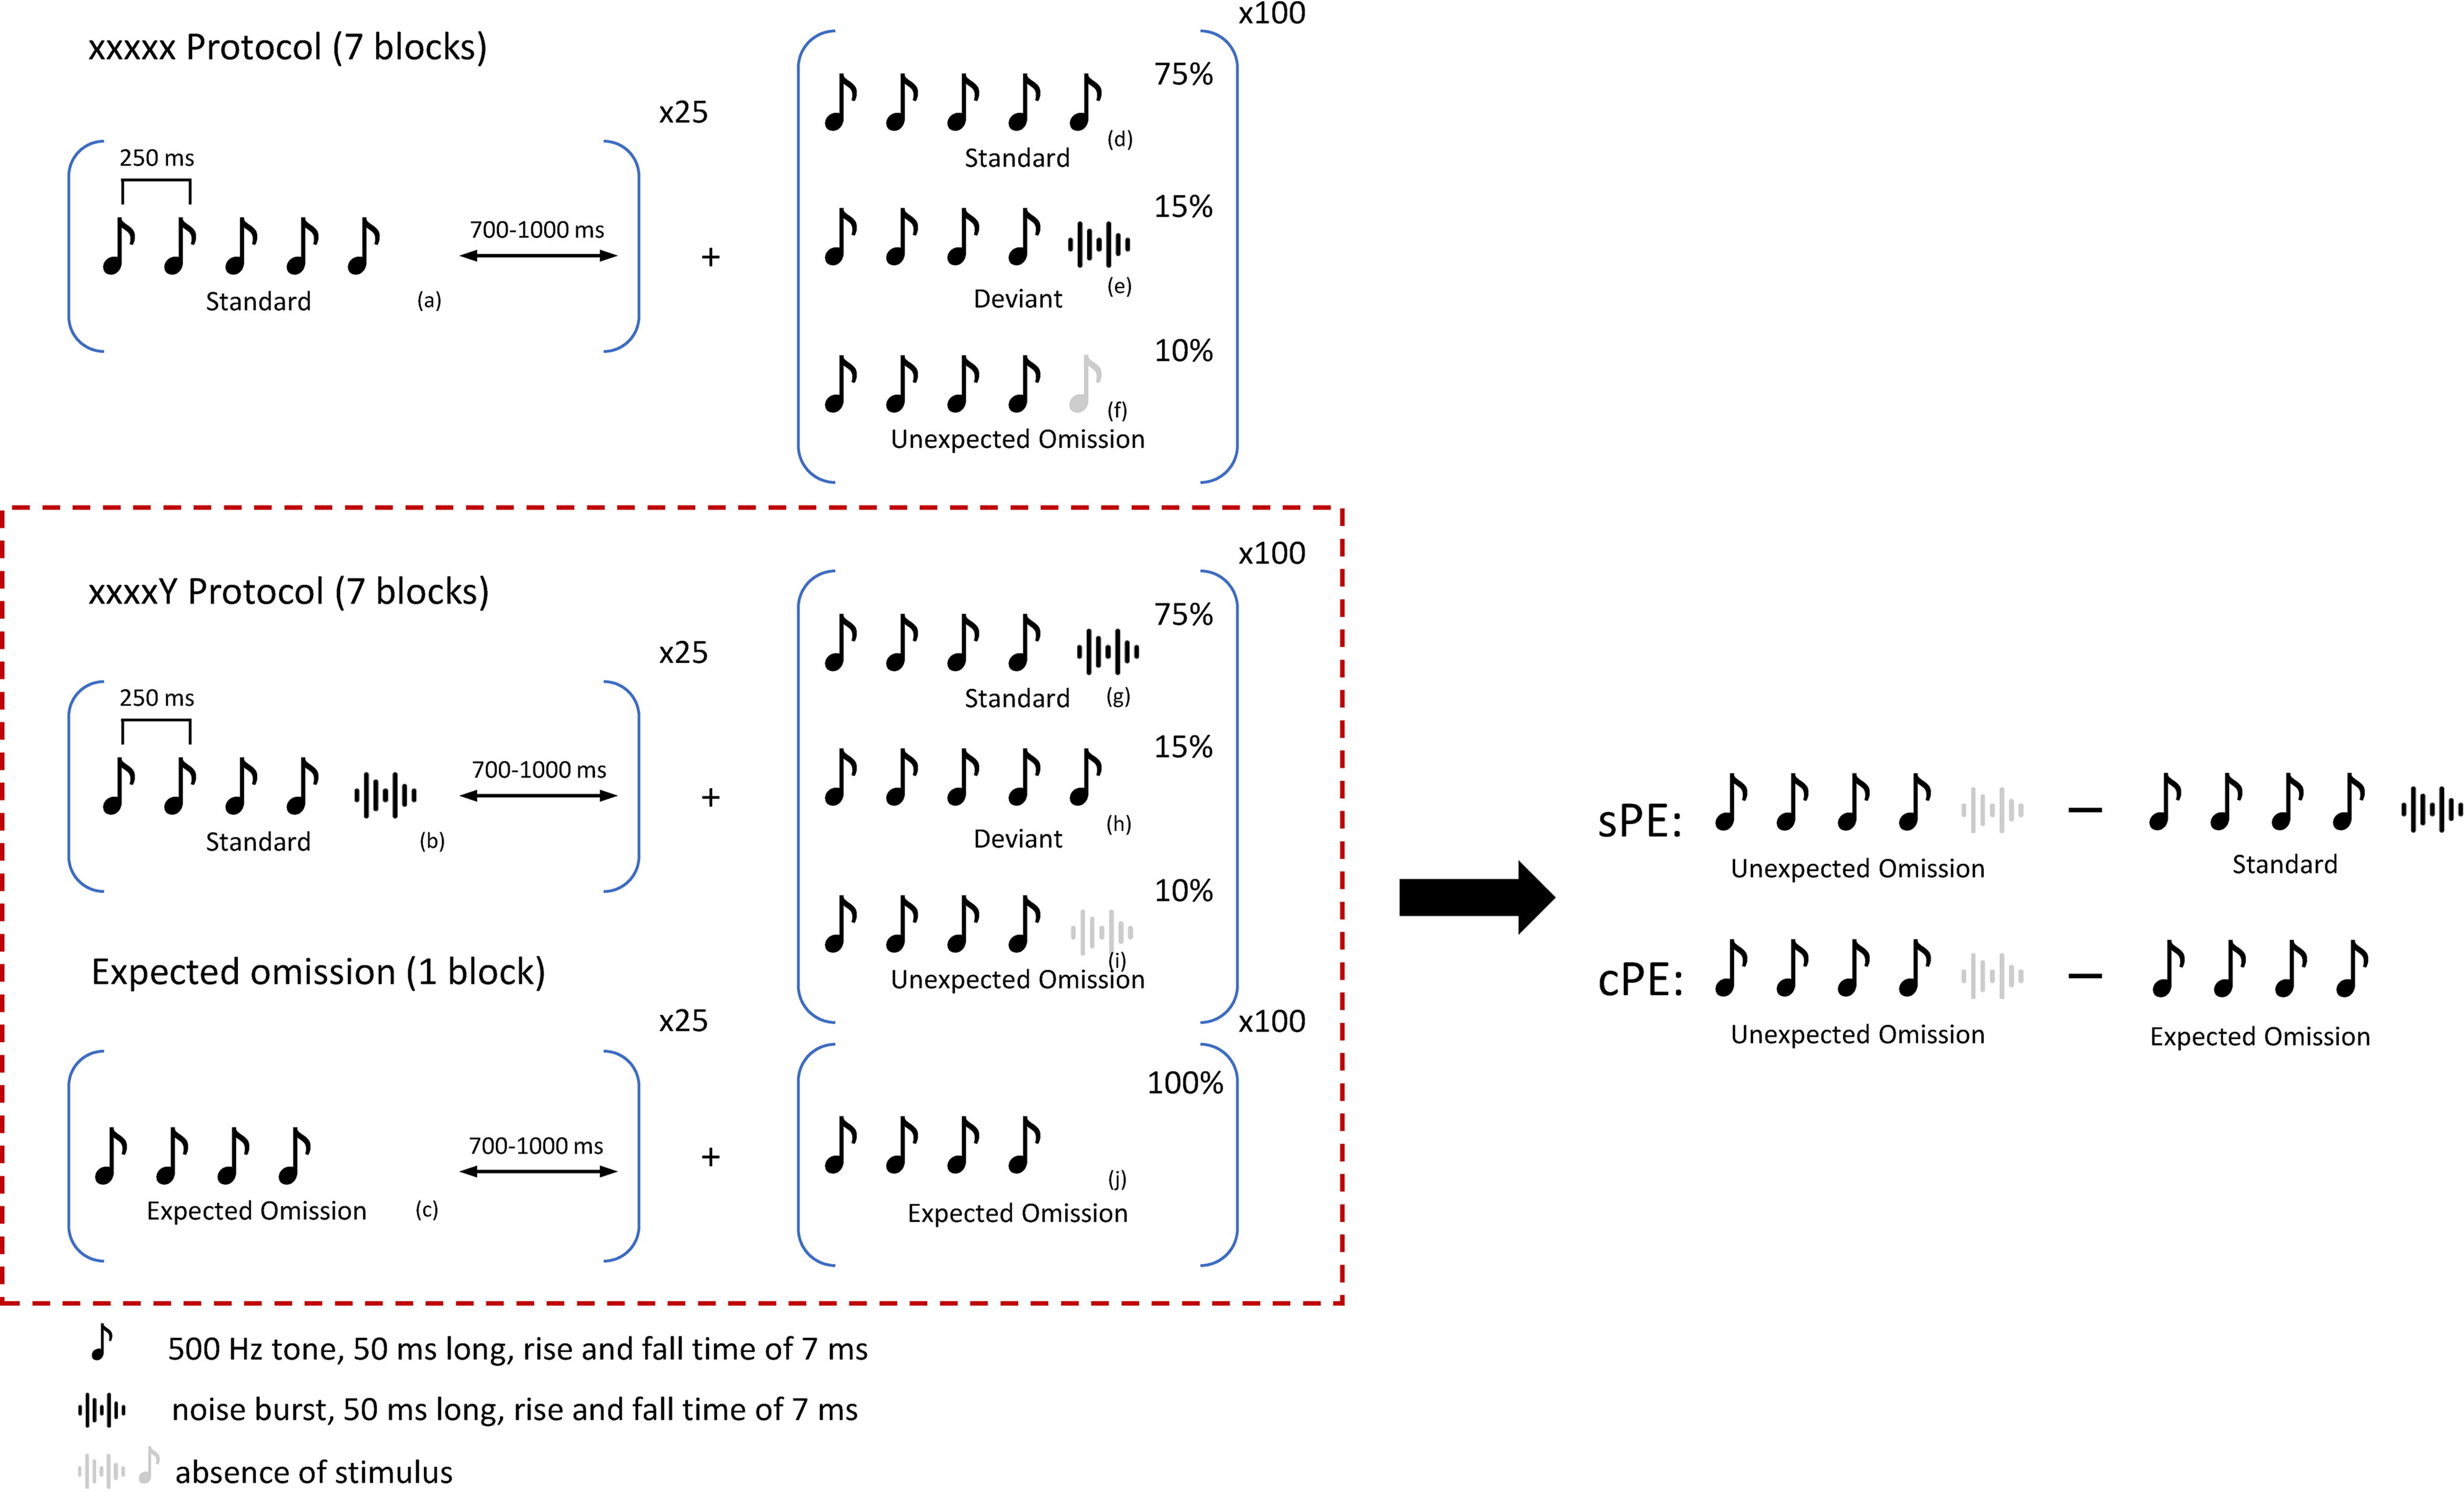
Auditory oddball paradigm. The full paradigm consists of three auditory stimulus sequences
The paradigm consisted of two protocols, and each protocol had seven blocks of 125 trials. In the xxxxx protocol (n = 7 blocks), Sequence X was the standard and Sequence Y worked as the deviant. In the xxxxY protocol (n = 7 blocks), Sequence Y was the standard and Sequence X worked as the deviant and Sequence Omission was the omission sequence in both. Each block started with 25 standard sequences, and the following 100 trials included 75% standard trials, 15% deviant trials, and 10% omission trials (Fig. 1). The omission protocol (n = 1 blocks), which included 125 omission trials, was presented toward the end to avoid habituation to the omission. The participants could take breaks between subsequent blocks and between subsequent protocols. Based on our previous study (Mohan et al., 2022) and the original study (Wacongne et al., 2011), we know that the xxxxY protocol directly measures the global effect of the brain encoding the entire sequence versus just the independent stimuli. Therefore, our analyses in this article will be based on the xxxxY and omission protocol, considering three basic conditions, i.e., standard (Fig. 1g), unexpected omission (Fig. 1i), and expected omission (Fig. 1j).
EEG pre-processing
The stimuli were presented through the Neuroscan Stim II system, which trigged the Neuroscan Scan 4.5 Acquire software. EEG (Electroencephalography) was recorded using 64-channel Neuroscan Synamps2 Quick Cap configured per the International 10–20 placement system with a reference close to Cz (impedance < 5kΩ). The data were then sampled using the Neuroscan Synamps2 amplifier at 500 Hz and online band-pass filtered at 0.1–70 Hz. Participants were asked to refrain from caffeine before the study. During the test, they were required to keep their eyes fixed on the fixation cross on the screen and minimize body movement.
EEG data were then pre-processed using the EEGLAB (Delorme and Makeig, 2004) and ERPLAB (Lopez-Calderon and Luck, 2014) toolboxes in MATLAB. The pipelines for EEG pre-processing included removing unused and bad channels by visual inspection, rereferencing to average reference, and filtering between 0.5 and 44 Hz. Data were epoched between −100 ms and 1850 ms relative to the onset of the first tone in each sequence. The epoched data were then subjected to temporal independent component analysis (ICA) to remove muscle artifacts, eye blinks, saccades, and other noise transients (tinnitus: range = 8–24, median: 18; control: range = 15–29, median = 18.5). No group difference in the number of artifact ICA was observed [t(18) = 1.396, p = 0.179]. Artifacts in all epochs were detected and deleted using a simple voltage threshold of ±90 µV and manual inspection. The channels initially removed were interpolated using a spherical interpolation algorithm in EEGLAB (tinnitus: range = 1–7, median: 3; control: range = 1–5, median = 1) before the ICA. No group difference in the number of interpolated channels was observed [t(18) = 1.462, p = 0.161].
Source localization and regions of interest
All trials for all the conditions were source localized for the entire time length using the Brainstorm toolbox (Tadel et al., 2011). The ICBM-1522 template was used to create the head model, and the forward model was generated using OpenMEEG BEM. The noise covariance matrix was calculated based on the baseline of all trials. Source reconstruction was performed using dynamic statistical parametric mapping (dSPM) with a fixed source orientation constraint where the vertex normal to the source space solution is applied (Hämäläinen, 2010). We selected 10 regions of interest (ROIs) based on previous studies (Mohan et al., 2022), which were left and right AC (BA 41), left and right PHC (BA 36), left and right pgACC/vmPFC (BA 24), left and right dACC (BA 32), and left and right PCC (BA 31). The size of ROIs was standardized to 10 cm2. The network was then visualized by the BrainNet Viewer toolbox (Xia et al., 2013).
Granger causality
Granger causality (GC) is used to capture the amount of information and the direction of information transfer between different regions. GC aims to measure the statistical probability of past activity causing future activity (Granger, 1969), which has become a popular method for connectivity that resists noise and predefined connections (Friston et al., 2014). The time-varying effective connectivity between the ROIs was calculated using partial directed coherence (PDC) (Baccalá and Sameshima, 2001), which is a GC measure in the frequency domain. A set of processes in the observed time series is defined as a multivariate autoregressive (MVAR) model:
Statistical analysis
Removal of spurious connections
The PDC of the standard, expected omission, and unexpected omission conditions in tinnitus and control groups was calculated first by the multitrial adaptation. The fmax was set as 44 Hz in line with the low-pass filter settings. The number of frequency bins was set as 500. This step resulted in a four-dimensional matrix of PDC values for each subject (10 × 10 brain connectivity × 500 frequency bins × 975 time points).
To test for statistically significant nonzero connections for each subject, a null distribution by randomizing the phase information while preserving the amplitude distribution was performed. This phase randomization was done using a fast Fourier transform (FFT), and an inverse FFT was performed to obtain the surrogate data. This was implemented using the SIFT toolbox in EEGLAB (Delorme et al., 2011). The estimated connectivity from the actual data was then compared with the connectivity estimated from the surrogate data (null distribution) using the cluster-based permutation test with 100 randomizations (α = 0.05, two-tailed), in which clusters were defined as data points per time bins and frequency to control for the family-wise error rate. Consequently, the spurious GC was ruled out for each subject by only including estimated connectivity that is significantly larger than the surrogate data in further analysis. This method has been validated in previous studies (Fahimi Hnazaee et al., 2020; Kamiński et al., 2001).
Previous research has suggested that the communication of the prediction is encoded in the alpha band connectivity and that of the PE in the theta band connectivity (Recasens et al., 2018). Therefore, the PDC matrices in the theta (4–7.5 Hz) and alpha frequency (8–12 Hz) bands were extracted and averaged around the respective frequency bins for each subject, generating a 10 × 10 × 975 PDC matrix for each subject in each group (controls and tinnitus), condition (standard, unexpected omission, and expected omission), and frequency band (theta and alpha).
Within-group analysis
To determine the significance of the condition-level difference in each group and frequency band, a dependent-sample permutation test with 1000 randomizations was conducted. In each randomization, the data (10 × 10 × 975) of two compared conditions were first pooled (unexpected omission vs. standard or unexpected vs. expected omission). Then, the pooled data were fully shuffled and randomly assigned to create PDC matrices for the two compared conditions. This permutation process was repeated for each group (controls, tinnitus) and each frequency band (theta, alpha). This resulted in eight statistical tests: 2 condition pairs × 2 frequency bands × 2 groups. Thus, alpha level for the difference was selected as α = 0.00625 (0.05/8) for each test after correcting for multiple comparisons using a Bonferroni correction.
Between-group analysis
To investigate the group differences of the time-varying connectivity network during the hierarchical PE processing, the sPE and cPE were analyzed. The four-dimensional PDC matrix of sPE (i.e., unexpected omission—standard) and cPE (i.e., unexpected omission—expected omission) for each subject was calculated. Then, the PDC matrix for the sPE and cPE in the theta (4–7.5 Hz) and alpha frequency (8–12 Hz) bands was averaged across the respective frequency bins in each subject. To determine the group difference in connectivity during the sPE and cPE processing in each PE condition and frequency band, an independent-sample permutation test with 1000 randomizations was conducted. In each randomization, the data (10 × 10 × 975) of two groups were first pooled (tinnitus vs. control). Then, the pooled data were fully shuffled and randomly assigned to create PDC matrices for the two groups. This permutation process was repeated for each conditions (sPE and cPE) and each frequency band (theta and alpha). To ensure a strict correction, we used the same alpha level as for the within-subject analysis α = 0.00625 (0.05/8) for each test after correcting for multiple comparisons using a Bonferroni correction. The effect size (Cohen’s d) was estimated as an indication of the strength of the group difference. The results showed a consistently large effect across all significant connections in all conditions and all frequency bands (Cohen’s d range: sPE theta = 1.33–2.56, sPE alpha = 1.33–2.72, cPE theta = 1.36–2.94, and cPE alpha = 1.36–2.80).
Visualization
Per the design (Fig. 1), the first four stimuli are similar in the standard, deviant, and omission sequences, of which the fourth stimulus of all trials ends at 950 ms after the first stimulus. Subsequently, the difference in stimulation conditions results in different levels of PE. Therefore, we only visualized the time-varying connectivity preceding and succeeding the fifth stimulus. Four time frames were defined based on the previous evidence and rationale: (1) the 250 ms before the onset of the fifth stimulus, which we define as a predeviant response (PDR), (2) 0–100 ms after the onset of the fifth stimulus, hereby referred to as early deviant response (DR) (Luck, 2014; Wacongne et al., 2011), (3) 100–250 ms after the onset of fifth stimulus that corresponds to MMN time frame (Mohan et al., 2022; Wacongne et al., 2011), and (4) 250–600 ms after the onset of fifth stimulus corresponding to the P300 time frame in both PE conditions (Mohan et al., 2022; Wacongne et al., 2011).
The time-varying connectivity per 50 ms from 250 ms pre-fifth stimulus to 600 ms post-fifth stimulus was first visualized at the within-group and between-group levels (see Supplementary Data S1and Supplementary Fig S1-S6). The connectivity that lasted two or more times within a specific time frame was presented using solid lines, whereas that occurred only one time within a specific time frame was presented using translucent lines. The number of indegrees indicated the number of connectivity directed into individual ROIs within individual time windows. For easier visualization, the results were further condensed for four time windows: PDR, DR, MMN, and P300 for each group and group difference, as shown in the result section. The connectivity that lasted two or more times within a specific time frame was presented. The number of indegrees indicated the number of connectivity directed into individual ROIs within individual time windows.
Results
Demographical results
Ten tinnitus participants (25.90 ± 5.49 years, 8 males: 2 females) and 10 control participants (27.00 ± 4.71, 4 males: 6 females) were recruited. The demographic characteristics were compared between the two groups (Table 1). There was no significant difference in age (Fig. 2a) (t(18) = 0.48, d = 0.21, 95% confidence interval [CI] = [−0.66, 1.09], p = 0.63) and sex (Fig. 2b) (χ2 = 3.33, p = 0.06) between the two groups. Furthermore, two groups were matched for the hearing thresholds at every frequency in individual ears (Fig. 2c) (F(7,112) = 0.94, p = 0.48, partial η 2 = 0.05, 95% CI = [0,0.08]), and there was no significant difference in the mean hearing loss between the control (M ± SD = 7.28 ± 4.72 dB HL) and tinnitus (M ± SD = 7.62 ± 4.72 dB HL) groups (Fig. 2d) (F(3,17) = 0.02, p = 0.89, 95% CI = [−0.83, 0.96], one missing value).

Comparison of the demographical characteristics between the tinnitus and control groups.
Descriptive Table of Demographic Information
TQ has one missing value. Data were presented as mean (SD).
VAS, visual analog scale; THI, Tinnitus Handicap Inventory.
The tinnitus characteristics were measured using audiological measures and two 10-cm VAS (Table 1). The audiological measures demonstrated high-frequency tinnitus pitch (M ± SD = 3.36 ± 2.84 kHz) and the mean loudness match as 24.33 ± 14.85 dB SL. The VAS showed that the mean tinnitus loudness was 2.25 ± 1.22, and tinnitus-related distress was 1.13 ± 1.20. Tinnitus participants also completed a set of questionnaires, including the THI (M ± SD = 29 ± 24.8), TQ (M ± SD = 24.67 ± 12.88, one missing value), and TFI (M ± SD = 27.48 ± 19.47).
The results of ERP, topographical maps, and source localization for sPE and cPE and the group difference were published and presented in a previous study (Mohan et al., 2022).
Connectivity analysis
Time-varying connectivity
The time-varying connectivity with a time window of 50 ms was visualized at both within-group analysis and between-group analysis levels. The details of the results are reported in the Supplementary Data S1section.
sPE condition
The PDC matrix of standard and unexpected omissions was compared within the tinnitus and control groups first. Then, the PDC matrix of sPE was compared between the two groups. All repetitive connectivity that showed a significant difference two or more times within a specific time frame is summarized in Figure 3.

Summaries of connectivity network in the stimulus-driven prediction error (PE). The figure displays the connectivity network for the tinnitus group
In the tinnitus group (Fig. 3a), during PDR, we observed a general decrease in alpha connectivity from and to the left PHC in the unexpected omission condition (n = 8). Apart from that, the PCC also received decreased connectivity from the right dACC in the unexpected omission condition. By contrast, increased information was sent from the right PHC and left AC to the left dACC. During DR, there was decreased theta connectivity from the right AC to the left PHC, left dACC and right PCC for the unexpected omission condition, whereas there was increased information from the left PHC to the left dACC. During the MMN time frame, there was increased theta information from the right pgACC, right PCC, and right dACC to the AC (n = 8) in the unexpected omission condition, whereas there was decreased one from the right dACC to the right PCC. During the P300 time frame, we observed increased theta connectivity from the dACC to the right PCC (n = 4) in the unexpected omission condition, whereas there was decreased information from the AC to the left PCC (n = 8). The bilateral PCC sent decreased theta information to the right PHC, and the right dACC sent decreased information to the left PHC in the unexpected omission condition. In addition, there was increased theta connectivity from the right pgACC to the right AC.
The connectivity network of the control group is shown in Figure 3b. The results showed an increased bottom-up connectivity network from the bilateral AC to other regions in all time frames in the unexpected omission condition relative to the standard condition. During PDR, there was an increased alpha connectivity network from the AC to the PCC (n = 24) and from the pgACC to the right dACC, AC, and PCC in the unexpected omission condition. We also observed increased alpha connectivity from the right PHC to the right dACC but decreased connectivity from the left dACC to the left PHC (n = 11). During DR, there was a general increased theta connectivity, mainly from the left AC and right PHC, for the unexpected omission condition. The left dACC received decreased theta information from the right pgACC and right dACC. During MMN, we observed increased theta connectivity from the left pgACC, left PHC, and bilateral AC to the right PCC (n = 20) in the unexpected omission condition but decreased connectivity within dACC and from the left dACC to the left PHC. During P300, we observed an increased theta connectivity network mainly from the left AC and bilateral PHC to the dACC (n = 31) and right PCC (n = 20) and decreased connectivity from the right dACC to bilateral pgACC in the unexpected omission condition. There is also a general increase in theta connectivity to the right AC (n = 19) and right PHC (n = 10).
The group difference during the processing of sPE was further investigated and presented (Fig. 3c). In general, the tinnitus group showed decreased information transfer between the PE network and control group in all time frames. During PDR, compared with controls, the tinnitus group showed a general decrease in the alpha connectivity to the right AC (n = 6), right PHC (n = 10), and bilateral PCC (n = 24) from other regions. By contrast, the tinnitus group only showed increased connectivity from the left PHC to the left dACC. During DR, the left AC and left PHC of tinnitus sent decreased theta information to the right PHC relative to controls (n = 5). The tinnitus group also showed a decreased theta connectivity network from the AC or left PHC to the right pgACC and right PHC than controls but increased connectivity within the dACC (n = 4). During MMN, we observed a general decrease in theta connectivity mainly from the left AC, left PHC, and bilateral pgACC to the right AC (n = 9) and bilateral PCC (n = 16) in the tinnitus group compared with controls. During P300, there was still a general decrease in theta connectivity from and to the right AC (n = 10) and bilateral PCC (n = 24) for the tinnitus group. We also observed a decreased theta connectivity to the right PHC (n = 9), left dACC (n = 8), and pgACC (n = 24) in the tinnitus group. Interestingly, all connectivity from the right dACC to the pgACC increased for the tinnitus group relative to the control group.
cPE condition
All repetitive connectivity for each group and the group difference in the cPE condition are summarized in Figure 4. In the tinnitus group (Fig. 4a), most connectivity was consistently toward the right PHC, the right pgACC, and the right PCC, which were the central hubs in processing cPEs in the tinnitus group. During PDR, there was a general increase in the alpha connectivity to the right PCC (n = 81) but decreased connectivity from the left PCC for the unexpected omission condition. We observed a decrease in the alpha connectivity to the right PHC (n = 17) and the right pgACC (n = 16) but increased connectivity from these regions to the rest of the network. During DR, we observed all increased theta connectivity was sent to the right PCC (n = 23) for the unexpected omission condition relative to the expected omission condition. In addition, the right PHC received a decreased theta connectivity from the left PCC and the right AC (n = 11) and sent less to the right pgACC. During MMN and P300, there was still a general increase in the theta connectivity to the right PCC but decreased connectivity to the right PHC and pgACC.
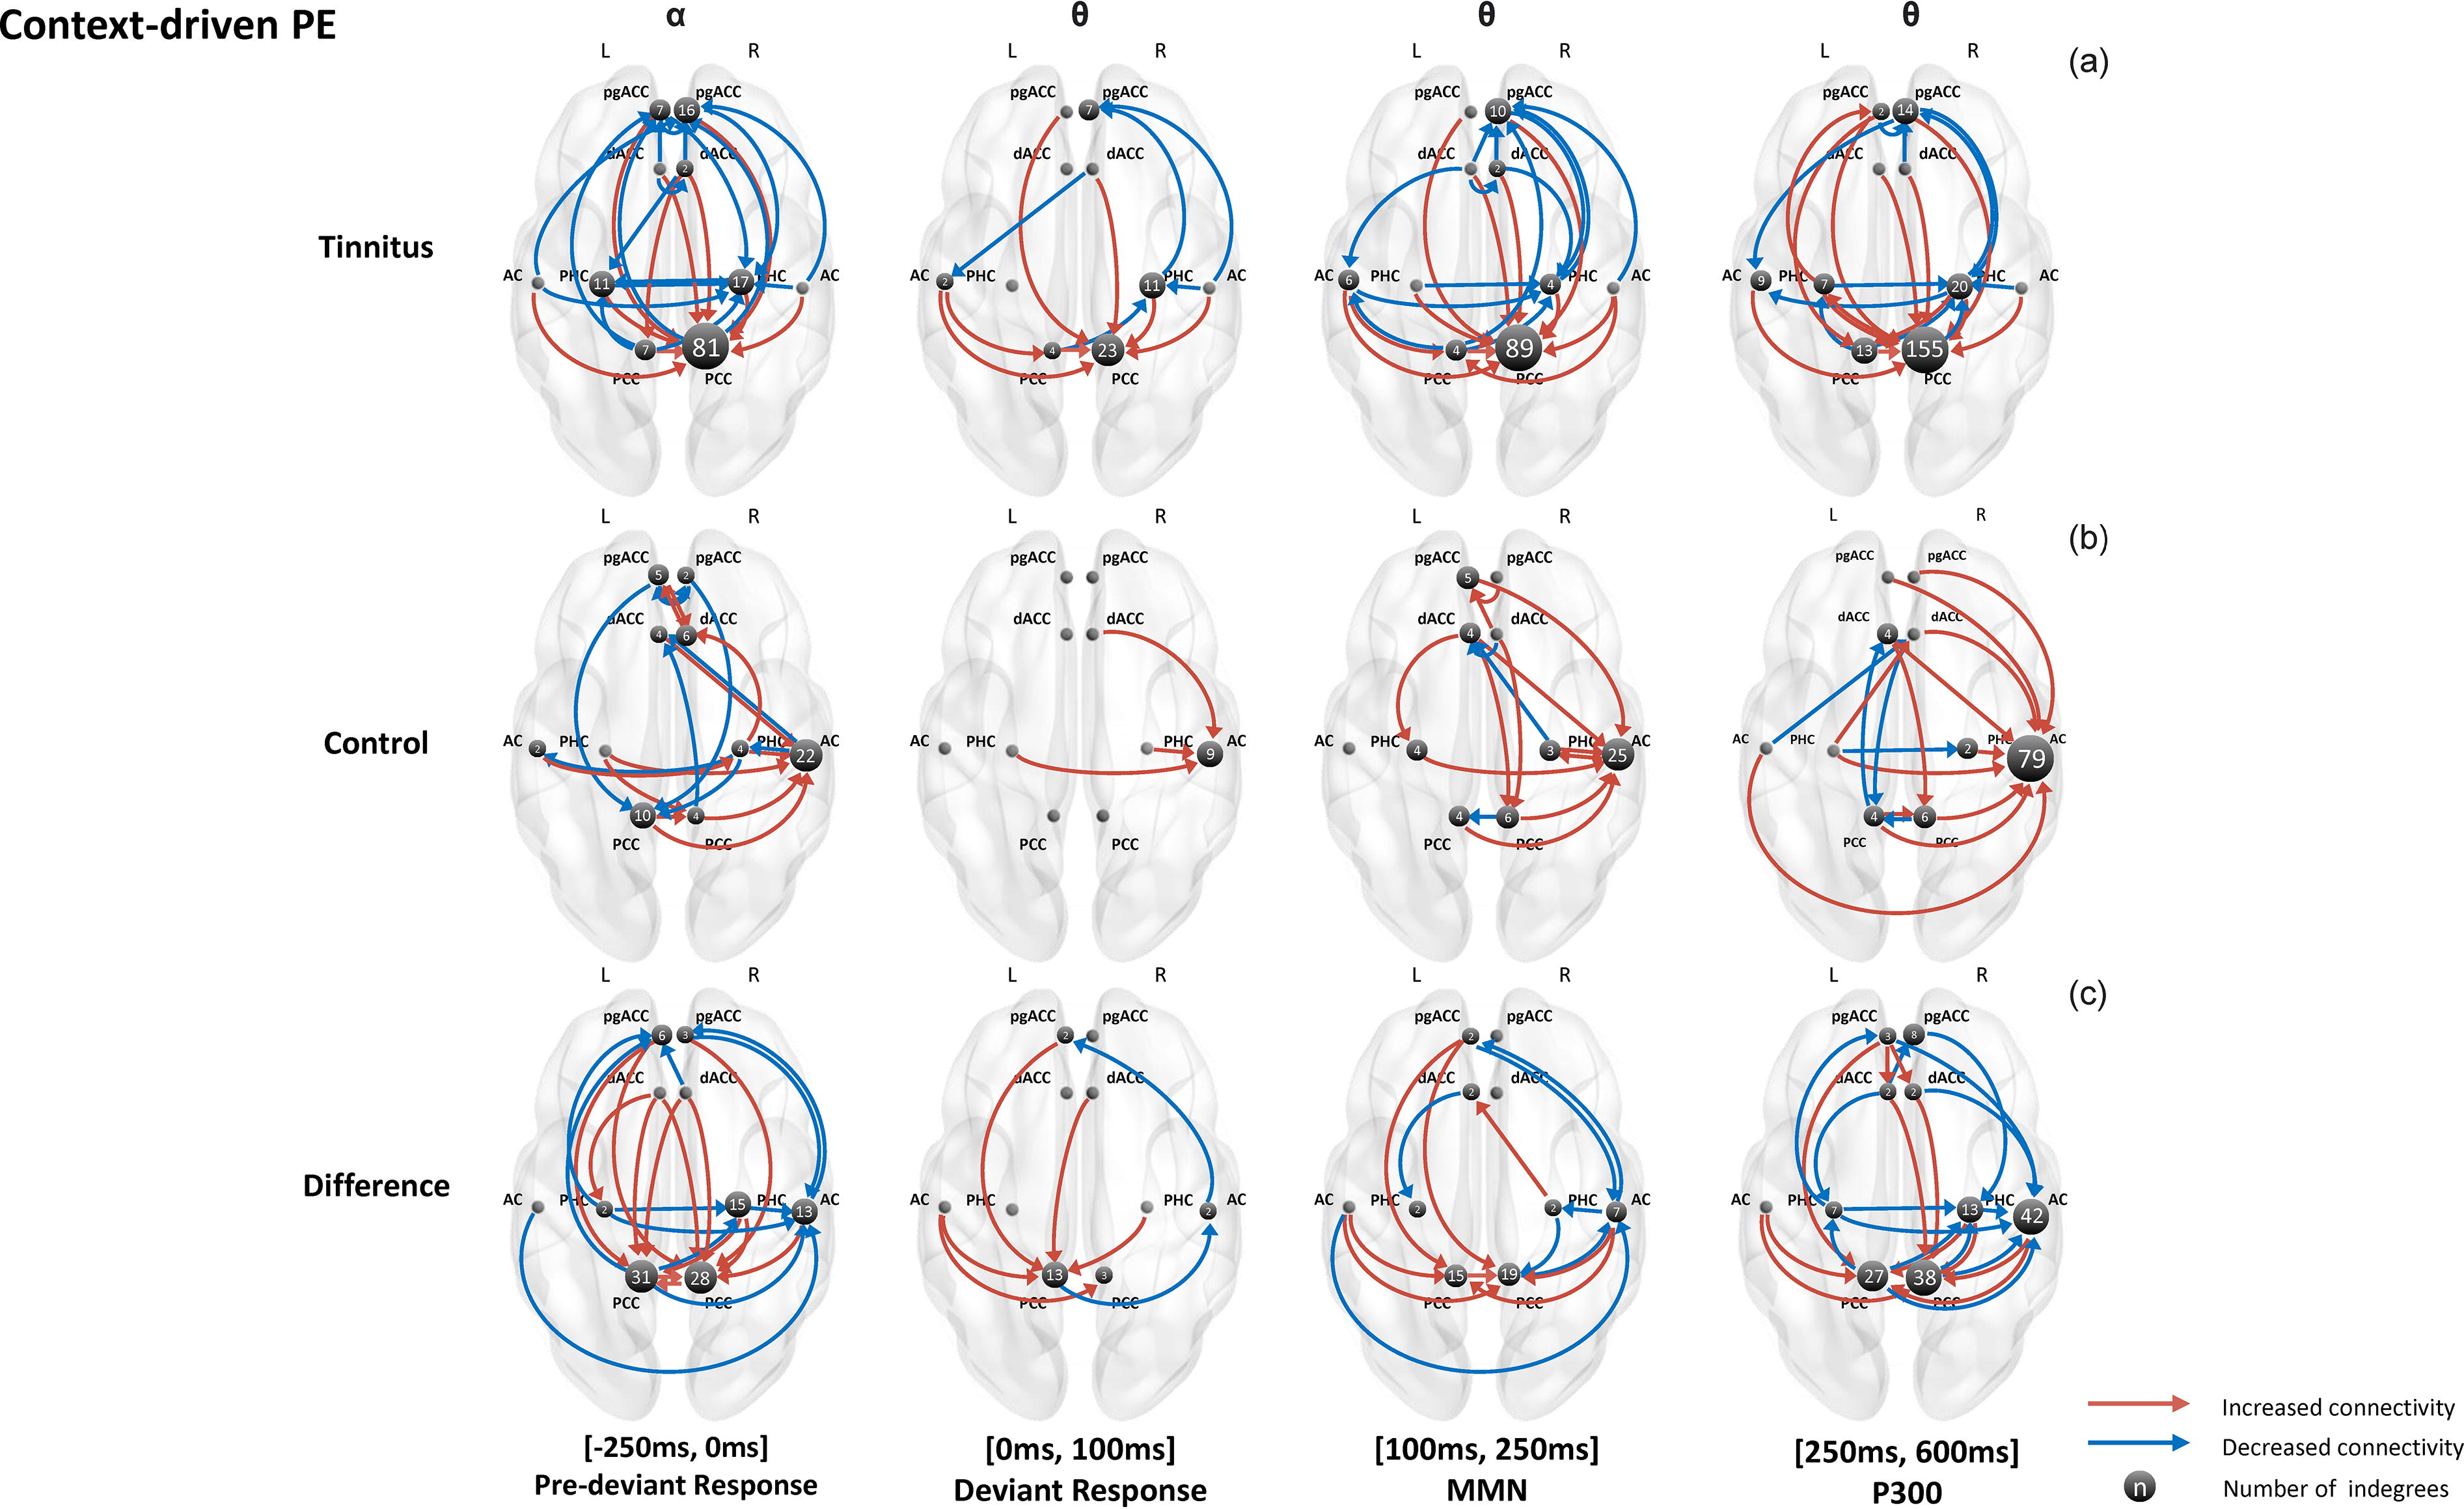
Summaries of connectivity network in the context-driven prediction error (PE). The figure displays the connectivity network for the tinnitus group
The connectivity network of the control group in the cPE condition is shown in Figure 4b. We observed that the right AC is the central hub for processing cPEs in the control group across all time frames. During PDR, there was a general increase in the alpha connectivity to the right AC (n = 22), right PCC (n = 4), and right dACC (n = 6) for the unexpected omission condition but decreased connectivity to the left PCC (n = 10). In addition, the left dACC received less information from the right AC and right PCC. During DR, we observed all theta connectivity to the right AC (n = 9) increased from the bilateral PHC and right dACC for the unexpected omission condition relative to the expected omission condition. During MMN, there was still a general increase in theta connectivity mainly to the right AC (n = 25). The right PCC received increased theta information from the bilateral dACC but sent less information to the left PCC. In addition, the left dACC received less information from the right PHC and right dACC. During P300, there was still a general increase in theta connectivity to the right AC (n = 79) for the unexpected omission condition.
The group difference in the cPE condition is summarized in Figure 4c. In particular, the group difference in connectivity network during the processing of cPE mainly lies in right AC, right PHC, and bilateral PCC. During PDR, the tinnitus group showed a general increase in alpha connectivity to the bilateral PCC (n = 59) but decreased connectivity from the left PCC to the right AC (n = 13) and left pgACC (n = 6). In addition, we also observed a general decrease in the alpha connectivity to the right AC (n = 13) and right PHC (n = 15) for the tinnitus group. During DR, compared with controls, the tinnitus group showed a general increase in theta connectivity to the left PCC (n = 13). The right AC received decreased theta information from the left PCC and sent decreased theta information to the left pgACC. During MMN, the bilateral PCC (n = 34) received increased theta connectivity from the bilateral AC and left pgACC and decreased connectivity from the right PHC. We also observed a general decrease in theta connectivity to the right AC (n = 7). During P300, there was still a general increase in theta connectivity to the bilateral PCC (n = 65) but decreased connectivity from them to the right AC (n = 42) and bilateral PHC (n = 20). The right AC and right PHC also received a decrease in theta information from the rest of the network. In addition, there was increased connectivity to the right dACC from the left pgACC. There was also decreased connectivity to the pgACC from the left dACC and the left PHC.
Discussion
Predictive coding is recognized by several researchers to be involved in adaptive and maladaptive perceptual processes (Barron et al., 2020; De Ridder et al., 2014; Gilbert et al., 2022; Knill and Pouget, 2004). Particularly, phantom perception in different sensory domains has been regarded as a maladaptive compensation to minimize PE (Mohan and Vanneste, 2017). For example, tinnitus is explained under the predictive coding framework, where it is hypothesized that the brain maladaptively compensates for the PE possibly induced by changes in the auditory pathways or cortical structure and function with a sound as a means to minimize the resulting uncertainty (De Ridder et al., 2014; De Ridder and Vanneste, 2021; Hullfish et al., 2019; Sedley et al., 2016). Some researchers suggested that auditory phantom perception is driven by the brain’s oversensitivity to changes in the input (Sedley et al., 2016), whereas others propose it is driven by the brain’s strong prediction of the environment (Corlett et al., 2019).
The current study tested both of these hypotheses using sPE and cPE in a group of chronic tinnitus patients with minimal to no auditory damage as measured by an audiogram, in comparison to a group with no tinnitus. Our findings suggest that the tinnitus group was less sensitive (decreased connectivity strength) to changes in the stimulus (sPE condition) and more sensitive (increased connectivity strength) to changes in the context in which the same stimulus was presented (cPE condition). A graphical abstract was plotted to summarize the main findings (Fig. 5).
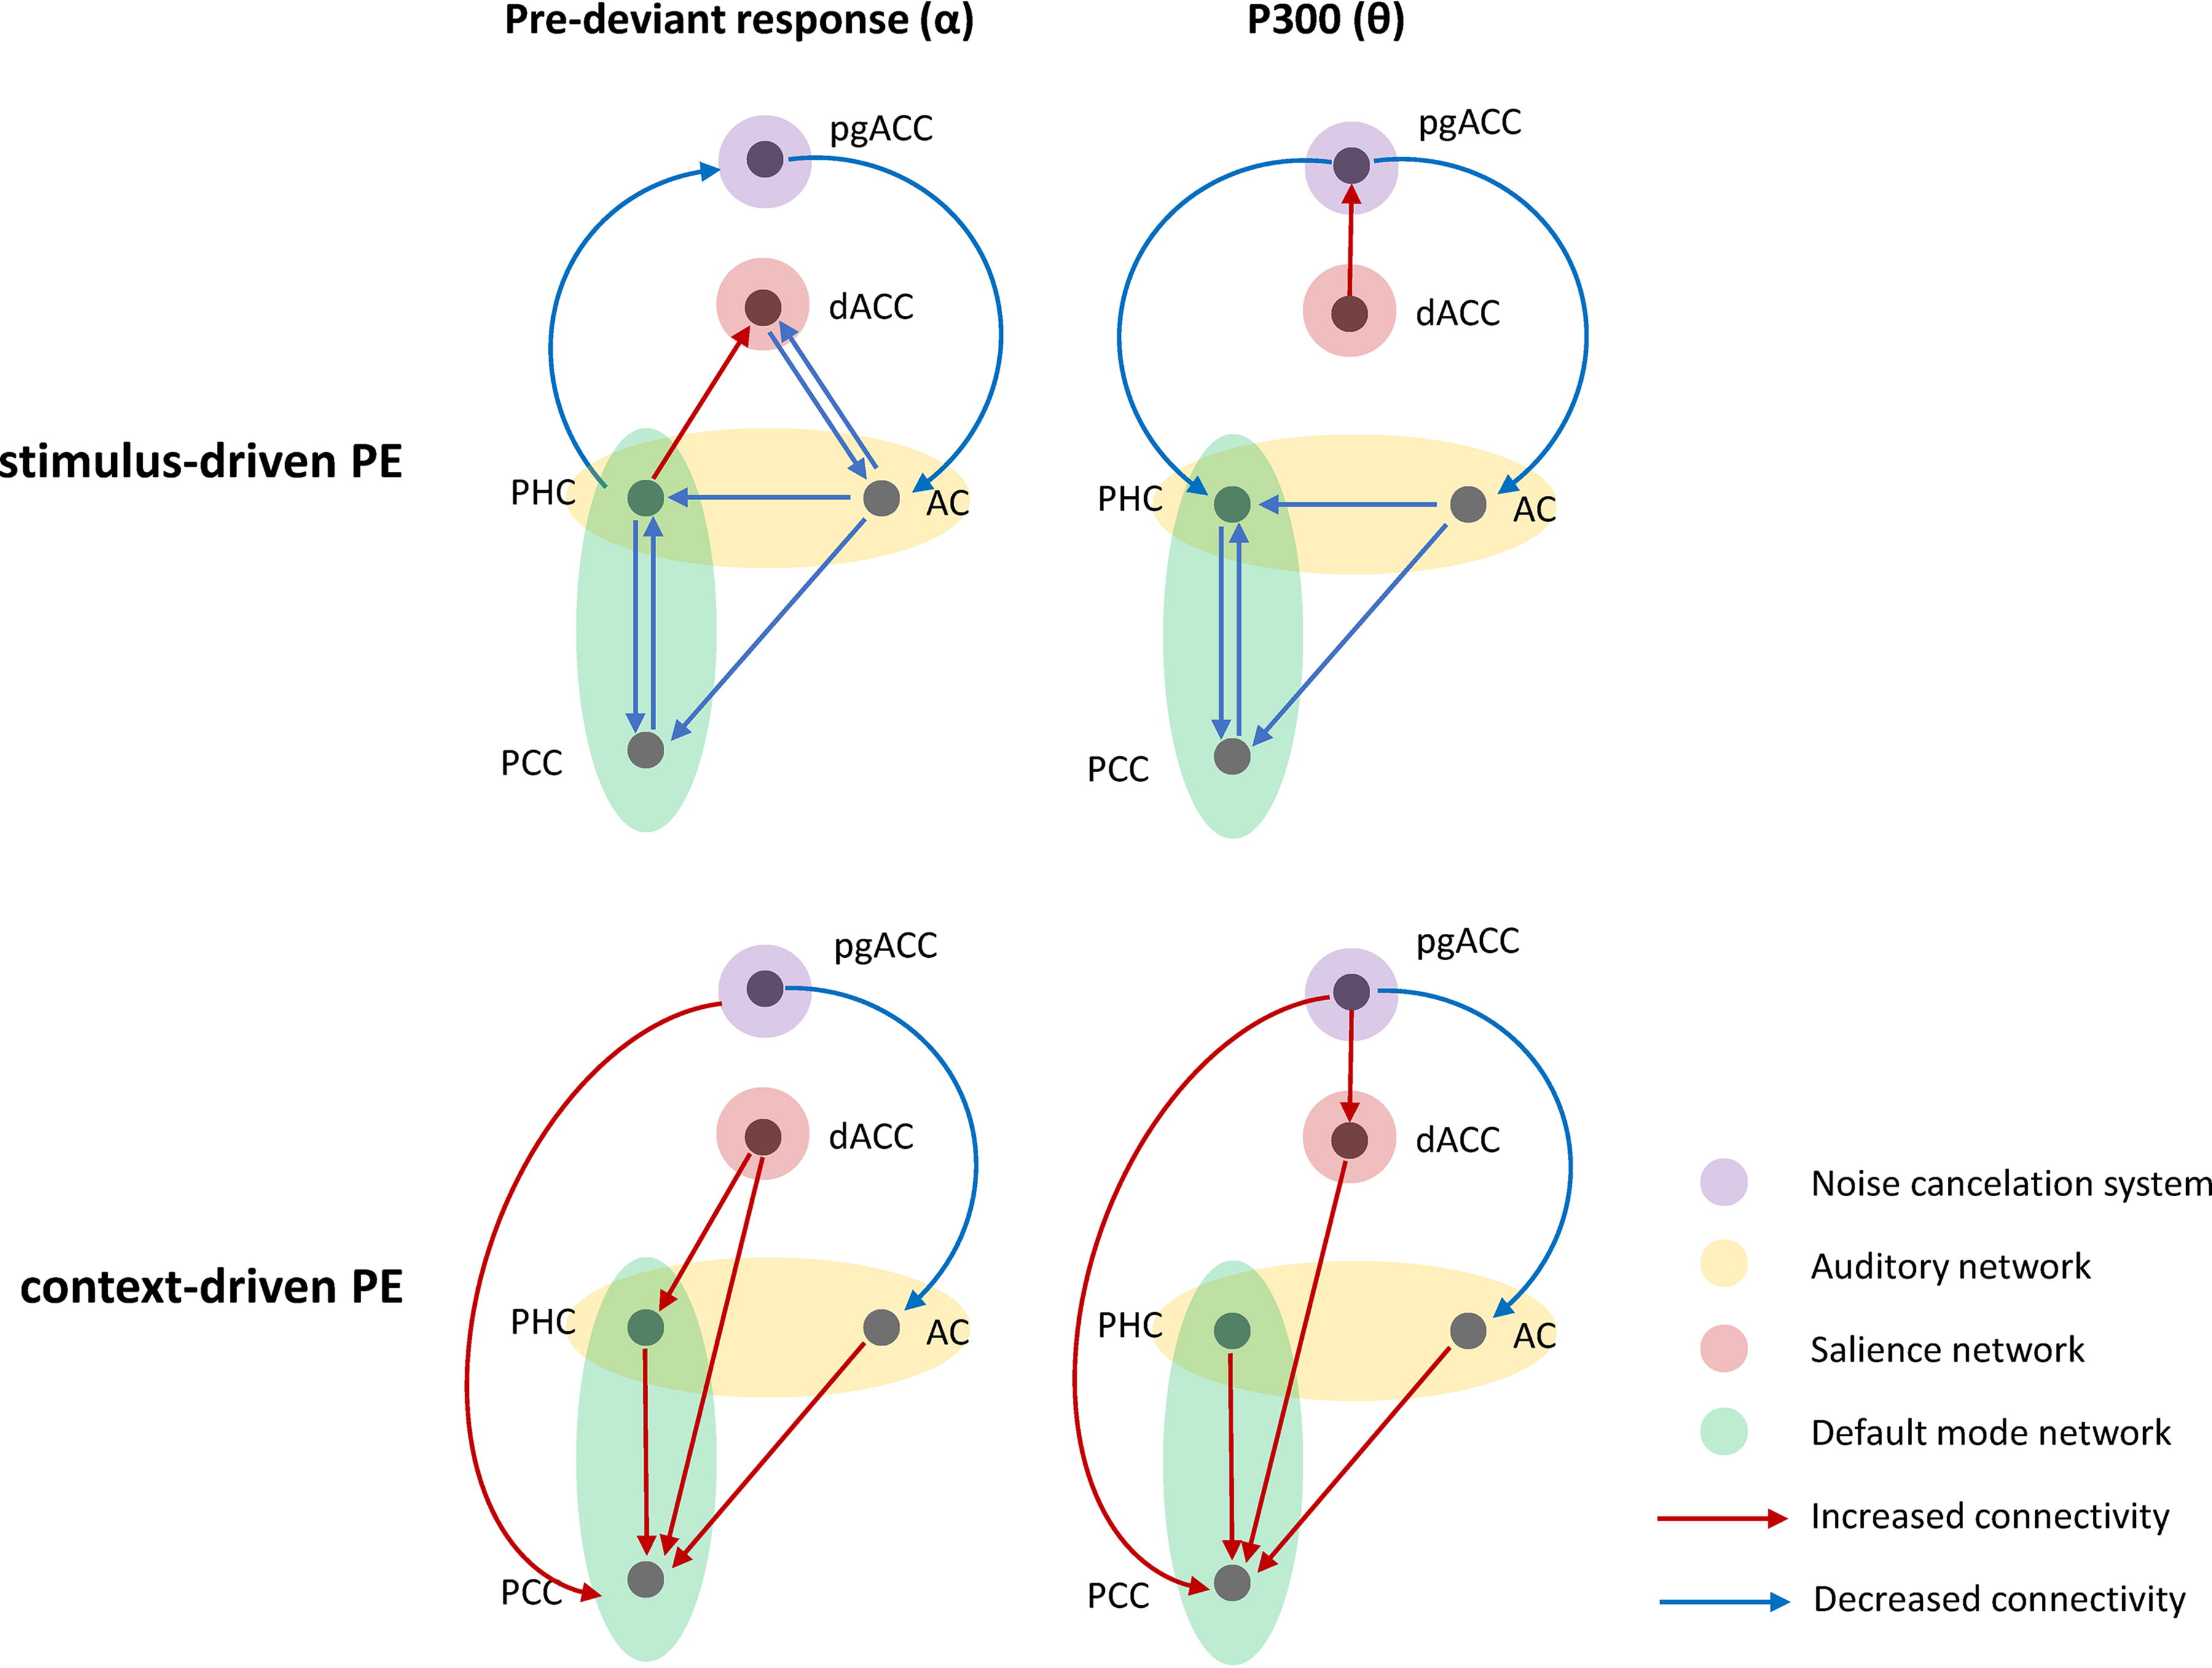
Graphical abstract showing the group difference between the tinnitus and control group for the pre-deviant and P300 time frames for the stimulus-driven and context-driven prediction errors. Red lines show increased connectivity for the tinnitus group than controls and blue lines show decreased connectivity. pgACC, pregenual anterior cingulate cortex; dACC, dorsal anterior cingulate cortex; PHC, parahippocampus; AC, auditory cortex; PCC, posterior cingulate cortex.
Effect of changing stimulus characteristics on the PE network in controls and tinnitus
In the current study, the sPE was generated by subtracting the ERP from the standard (xxxxY) from the ERP of the omission (xxxx_) where the 5th stimulus was different from the standard in both stimulus characteristics and probability. From the connectivity pattern in the control group, we observe that the PE generated by the absence of the 5th stimulus instigates the signaling of the PCC by the auditory regions (AC and PHC) in all time frames. This suggests that the signaling of the internal DMN in response to an unexpected absence of a stimulus is a normal process. However, the stark difference observed between the controls and tinnitus group is the increased connectivity from the top-down regions (pgACC) to the AC and/or PCC during the pre- and post-deviant responses, which is significantly reduced in the tinnitus group. This dysfunctional functioning of the top-down system in tinnitus has been consistently reported by several studies (Araneda et al., 2018; Leaver et al., 2011; Seydell-Greenwald et al., 2012) and also as a possible reason for tinnitus generation in people with minimal auditory damage (Vanneste et al., 2019). Modulating pgACC activity using transcranial direct current stimulation (tDCS) (Vanneste and De Ridder, 2011) or TRT (Kim et al., 2016) has been shown to improve tinnitus symptoms.
The second major difference we observe between the connectivity patterns of the control and tinnitus groups is that the establishment of the expectation of the standard stimulus during the PDR time frame is passed from the dACC to PHC in the control group but from the PHC to dACC in the tinnitus group. This aligns with previous evidence showing that the dACC not only simply monitors the errors but also participates in a process to statistically predict events (Ide et al., 2013; Sallet et al., 2007). Furthermore, the PHC plays a more receptive role in controls by receiving information about the PE, whereas it plays a more active role in sending information to establish the prediction in the tinnitus group. This supports the idea that the PHC plays a key role in establishing tinnitus, as suggested by De Ridder et al. (2011), some of our previous work with resting state studies (Mohan et al., 2018; Vanneste and De Ridder, 2016), and others with intracranial recordings (Sedley et al., 2015).
The signaling of the dACC by the rest of the predictive coding network in the control group becomes most apparent during the P300 time frame, in line with previous literature showing its role in orienting stimulus-driven attention (Han and Marois, 2014). During this time, we also observed an increase in information transfer to the right AC, right PHC, and right PCC showing right lateralization of the P300 response. This is in consensus with previous literature showing a right lateralization in auditory oddball tasks that is consistent with theories of the right hemisphere network to be prominently involved in sustained attention, stimulus evaluation, target detection, and working memory/context updating (Gilmore et al., 2009). In the tinnitus group, we observe that this right lateralization is nonexistent, and when compared with the control group it shows decreased connectivity within the same regions.
From a task perspective, it is important to consider that the tinnitus group hears a phantom sound and the control group does not. Therefore, when the omission stimulus was played, the tinnitus group had an ongoing internal sound while the controls did not. From this, we could speculate that the tinnitus itself may be filling in the omitted information, thereby reducing the magnitude of the PE and therefore its sensitivity to it. This is evident not only from the decreased sensitivity in the right hemisphere network compared with controls but also in the number of overall connections in the tinnitus group for recoding the sPE. Our findings are also in line with other literature showing reduced sensitivity to detect PEs in patients with phantom perception (McCleery et al., 2018; Sedley et al., 2019). In addition, previous studies consistently reported decreased MMN (Mahmoudian et al., 2013; Sedley et al., 2019) and P300 (Asadpour et al., 2018) amplitudes to sPE in tinnitus patients relative to controls.
In contrast, we observe increased connectivity between the left and right dACC and from the bilateral dACC to the bilateral pgACC in the tinnitus group during the P300. This suggests increased salience as a result of the absence of the 5th stimulus, as shown by previous studies (De Ridder et al., 2011; Vanneste and De Ridder, 2012; Vanneste et al., 2010a). However, this increased salience is accompanied by decreased connectivity from the pgACC to the AC and PCC in the tinnitus group compared with the control and increased connectivity from the dACC to the PCC in the tinnitus group while processing the sPE in the same time frame. Therefore, these results imply that this increased salience due to the omission of the 5th stimulus may be compensated by attention directed to the internal state—i.e., perceiving the tinnitus sound—which is also in line with previous findings (Sedley et al., 2019).
Effect of changes in context of the same stimulus on the PE network in controls and tinnitus
In the current study, cPE is generated by subtracting the ERP of the expected omission of the 5th stimulus from the unexpected omission of the 5th stimulus. Therefore, the changes in controls, tinnitus, and difference analyses indicate the neural markers related purely to the change in expectation of the same stimulus—i.e., when xxxx_ is and is not the established context. Context can be extracted from the configuration of sensory information, which facilitates the recognition of a target stimulus (Kveraga et al., 2007; Sanocki, 1993) and is important for building an expectation of the external world (Aminoff et al., 2013). As the changing of contexts requires the violation of expected regularity rather than detailed information of stimulus, cPEs are more dominated by top-down modulation. This is evident from the increased connectivity to the right AC and right PCC in the control and tinnitus groups from the rest of the PE network in all time frames, respectively.
However, we observe that when xxxx_ is the established context, there is increased connectivity to the PHC and the pgACC in the tinnitus group, suggesting that these regions are key in encoding a perfectly predictable stimulus compared with the same stimulus when it is unpredictable. This is in accordance with previous literature showing that the PHC is at the core of storing the sensory memory trace (Aminoff et al., 2007) and that the pgACC is responsible for updating the context (Will et al., 2017). This effect is not observed in the control group, and the effect observed in the tinnitus group is significantly different from the control group. The stronger connectivity to the PHC and pgACC from the rest of the PE network during the establishment of the context of the predictable compared with the unpredictable stimulus alludes to the strong prior hypothesis of Powers and colleagues (Corlett et al., 2019) which states that hallucinations are driven by the formation of strong predictions of the environment, which cannot be easily updated (Powers et al., 2017).
Another notable difference in the processing of the cPE between the control and tinnitus groups is the increased connectivity to the AC in the control group and to the PCC in the tinnitus group. The dynamic process of DMN helps convey the narrative content of information (Baldassano et al., 2018), which is linked with high-level PE that is associated with the expectation of regularity in the current context or the environment. Recent accounts have articulated the important role of the PCC in detecting sensory changes and driving subsequent shifts in self-referential processing and thus behavior based on Bayesian inference (Pearson et al., 2011). This emphasizes the importance of assessing the behavioral relationship through an intrinsic process, which is believed to be modulated by the DMN. Increased connectivity to the PCC in the current study may indicate an orientation to an internally ongoing process (Leech and Sharp, 2014). Furthermore, previous evidence also demonstrated the aberrant connectivity within and between DMN and other networks in patients with phantom perception (Broyd et al., 2009; Chen et al., 2017; Vanneste et al., 2010b; Zhao et al., 2018). The increased activity of PCC has been observed in tinnitus compared with healthy controls and is negatively correlated with the subjective loudness of tinnitus (Ueyama et al., 2013), suggesting the PCC’s involvement in the maladaptive neural processes underpinning tinnitus perception. Thus, the PCC-dependent network in the tinnitus group may indicate an inordinate orientation to endogenous context (i.e., the perception of the ongoing tinnitus sound) during cPE processing.
Additionally, we observe that the increased connectivity from the dACC and pgACC is communicated to the AC in the control group and to the PCC in the tinnitus group. This suggests a different compensation mechanism for the increased salience due to cPE in the controls and tinnitus. While in the controls, the dACC searches for more information in the auditory network in the control group, and it searches for more information in the DMN in the tinnitus group. The pgACC subsequently sends the changes in context to these regions as well. This, along with evidence from previous literature (Sedley et al., 2019), shows that perceiving tinnitus becomes the new default state of the brain.
Changes in sPE and cPE in relevance to the mechanism of action of phantom perception in other sensory domains
The expectation of a stimulus met with its unexpected absence, which is sPE, is reflective of a changing sensory environment. Here, we observe that patients with a phantom percept (even in the presence of minimal sensory damage) are less sensitive to such a changing environment, indicating that their chronic phantom percept is now possibly filling in for the missing sensory information in the same domain. From a neural correlate perspective, we observe an increase in salience, driven by the dACC, decreased compensation by the pgACC, and a loss of right lateralization in response to the processing of oddballs. Future studies are required to see if similar patterns of connectivity are able to predict the occurrence of an illusory percept when participants with no chronic phantom perception are subjected to an increasingly unpredictable sensory environment. In addition, more direct evidence using fMRI, brain stimulation, or animal models is expected to cross validate the current findings.
However, patients with phantom perceptions are more sensitive to the same stimulus presented in different contexts, which are cPEs. In fact, when stimulus-related changes are removed, it becomes clear that those patients show a stronger tendency to establish the prediction of a perfectly predictable stimulus than controls, suggesting that phantom perception may be generated as a result of a strong, undeterrable prediction of its environment. Furthermore, changing the context of such a strong prediction in chronic phantom perception results in an orientation to an internal state (network central at PCC), rather than to a sensory domain (network central at AC), as observed in controls. Future studies, testing the strong prior hypothesis as explained by Powers and colleagues (Corlett et al., 2019; Powers et al., 2017) may provide more concrete evidence for this mechanism of tinnitus generation.
In an earlier article from our lab, we hypothesized that phantom percepts from different sensory domains may be a compensation of a PE produced in the appropriate sensory domains or a domain-general PE network (Mohan and Vanneste, 2017). Investigating the sPEs and cPEs gives us an idea of different responses that are dependent and independent, respectively, of changes in stimulus characteristics. For example, similar patterns of changes for sPEs and cPEs in the somatosensory domain for chronic pain patients in comparison to a control group would confirm that phantom perception in different sensory domains is a result of an aberration of a more general predictive coding system with domain-specific compensation to the PE. This is a very powerful tool, since we will then be able to start investigating domain-general treatments for aberrant predictive coding, which can be adapted to different sensory systems or may be able to transcend the sensory domain altogether.
Limitations and future implications
Notably, there are several limitations that need to be considered. One significant limitation of the current study is the small sample size, with 10 tinnitus patients and 10 healthy controls. Although the results cannot be generalized to the entire tinnitus population, they serve as a good pilot for future studies to invest in the investigation of network connectivity as an indicator of the mechanism of action in phantom perception.
It is also important to note that while there was no significant difference in sex between the two groups, the contrast in sex distribution needs to be considered given the potential sex effect on the PE processing and related connectivity network (Fujimoto et al., 2016). Thus, future studies should aim to include larger sample sizes and a balanced sex distribution to validate and extend the current findings.
The dSPM and minimum-norm imaging estimates by Brainstorm produce an L2-minimum norm estimate of current density produced using a fixed source orientation constraint. However, Ghumare et al. (2018) suggest different ways of source localization, and there is quite a bit of discussion, from our understanding, on choosing a particular method that is best practice (Ghumare et al., 2018). Therefore, we acknowledge that the results of the current study may be constrained by the parameters chosen here. However, to confirm the results, we need future research to replicate the current results using other parameters of source localization and GC to provide more concrete evidence for the findings.
Although hearing loss may not be a major factor driving connectivity changes in the current study, it is not possible to rule this out completely. There is substantial research suggesting the presence of cochlear synaptopathy in people with normal hearing thresholds (Bharadwaj et al., 2019; Chen et al., 2021). Furthermore, it is possible that these people have hearing loss at frequencies higher than 8 kHz, which was not tested in this study. Therefore, future studies should note these factors during study design.
Notably, the current study only concentrated on the alpha and theta frequency bands since the communication of PEs through connectivity is proposed to be within these bands. However, predictions have been shown to be encoded also through the activity in low-data (14–15 Hz) oscillations and PEs in gamma oscillations (>30 Hz) (Arnal et al., 2011; Arnal and Giraud, 2012). Combining the two, it might be interesting for future studies to combine activity at high frequencies and connectivity at low frequencies to deepen the investigation of the communication of predictions and PEs through cross-frequency coupling.
Despite these limitations, the findings of this study have several potential clinical applications. Understanding the distinct patterns of predictive coding in tinnitus patients can inform the development of targeted therapies. For instance, the observed decreased sensitivity to sPEs and increased sensitivity to cPEs suggest that interventions could be tailored to modulate these specific neural processes. One potential way is the use of neuromodulation techniques, such as tDCS (Song et al., 2012) or transcranial magnetic stimulation (De Ridder et al., 2005), which have shown potential in modulating brain activity in tinnitus patients and tinnitus management. By targeting regions such as the pgACC or dACC, these techniques could help recalibrate maladaptive predictive coding processes and alleviate tinnitus symptoms.
Conclusion
In conclusion, sPEs and cPEs could be used as a way to test the top-down and bottom-up predictive coding processes in phantom perception, like tinnitus. In the control group, while the dynamic network of sPEs reflects the integrated processing of bottom-up sensory inputs and top-down prediction, the contextual difference mainly drives a general increase in connectivity to the right AC through the top-down pathway. Interestingly, the tinnitus group showed a DMN-dominant network during cPE with increased connectivity to the PCC, suggesting a powerful dependence on internal prediction. The group difference in the connectivity network may further support the maladaptive changes in PE processing in tinnitus patients and the potential effects of tinnitus on perceptual processing. As sPE arises, a general decrease in the responsive connectivity network of tinnitus patients compared with controls may reflect the decreased sensitivity to sPE due to the less magnitude of novelty caused by the constant perception of tinnitus. On the contrary, the strong orientation to internal prediction modulated by the increased connectivity to the PCC but decreased one from it is consistent with the increased sensitivity to cPEs of tinnitus patients. Through this study, we develop a powerful tool that can be tested in other sensory domains to confirm if phantom perception may be domain specific or part of a more general predictive coding system.
Footnotes
Acknowledgments
The authors thank Colum Ó Sé for his assistance with data plotting.
Authors’ Contributions
F.C.: data analysis and writing the article, M.F.H.: coding Granger causality and connectivity, data interpretation, and article revision, S.V.: ideation, supervision, and experimental design, A.Y.M.: data collection, supervision, and writing the article.
Author Disclosure Statement
None of the authors have potential conflicts of interest to be disclosed.
Funding Information
F.C. was funded by Trinity College Dublin Postgraduate Research Studentship, M.F.H. was funded by Non-Clinical Post Doctorial Fellowship from the Guarantors of Brain (grant number: 183328), and A.Y.M. was funded by the Government of Ireland Postdoctoral Fellowship 2020–2022 (grant number: GOIPD/2020/663). These funding sources had no further roles in study design; in the collection, analysis and interpretation of data; in the writing of the report; and in the decisions to submit the paper for publication.
Supplementary Material
Supplementary Data S1
Supplementary Figure S1
Supplementary Figure S2
Supplementary Figure S3
Supplementary Figure S4
Supplementary Figure S5
Supplementary Figure S6
References
Supplementary Material
Please find the following supplemental material available below.
For Open Access articles published under a Creative Commons License, all supplemental material carries the same license as the article it is associated with.
For non-Open Access articles published, all supplemental material carries a non-exclusive license, and permission requests for re-use of supplemental material or any part of supplemental material shall be sent directly to the copyright owner as specified in the copyright notice associated with the article.
