




Abstract
Background:
Functional magnetic resonance imaging (fMRI) has not previously been used to localize the swallowing functional area in repetitive transcranial magnetic stimulation (rTMS) treatment for poststroke dysphagia; Traditionally, the target area for rTMS is the hotspot, which is defined as the specific region of the brain identified as the optimal location for transcranial magnetic stimulation (TMS). This study aims to compare the network differences between the TMS hotspot and the saliva swallowing fMRI activation to determine the better rTMS treatment site and investigate changes in functional connectivity related to poststroke dysphagia using resting-state fMRI.
Methods:
Using an information-based approach, we conducted a single case study to explore neural functional connectivity in a patient with poststroke dysphagia before, immediately after rTMS, and 4 weeks after rTMS intervention. A total of 20 healthy participants underwent fMRI and TMS hotspot localization as a control group. Neural network alterations were assessed, and functional connections related to poststroke dysphagia were examined using resting-state fMRI.
Results:
Compared to the TMS-induced hotspots, the fMRI activation peaks were located significantly more posteriorly and exhibited stronger functional connectivity with bilateral postcentral gyri. Following rTMS treatment, this patient developed functional connection between the brainstem and the bilateral insula, caudate, anterior cingulate cortex, and cerebellum.
Conclusion:
The saliva swallowing fMRI activation peaks show more intense functional connectivity with bilateral postcentral gyri compared to the TMS hotspots. Activation peak-guided rTMS treatment improves swallowing function in poststroke dysphagia. This study proposes a novel and potentially more efficacious therapeutic target for rTMS, expanding its therapeutic options for treating poststroke dysphagia.
Impact Statement
Rehabilitation for poststroke dysphagia is often challenging, and many patients are significantly affected by this condition. Repetitive transcranial magnetic stimulation (rTMS) has shown varying degrees of effectiveness in treating poststroke dysphagia. Enhancing the precision of treatment targets could substantially improve clinical efficacy. From a mechanistic standpoint, this study introduces the concept of personalized precision treatment targets, which is more rational compared to traditional targets. Additionally, it generates new avenues for further research on the application of rTMS in treating other neurological disorders that present with dysphagia, such as Parkinson’s disease, multiple sclerosis, amyotrophic lateral sclerosis, and dysphagia prevalent in the aging population.
Introduction
Poststroke dysphagia is a major functional impairment with exceedingly poor prognosis, including risks of pulmonary infection, asphyxia, and even death. Severe dysphagia affects up to 50% of acute stroke patients (Mann et al., 1999). The research gap in rehabilitation interventions for dysphagia primarily lies in the lack of large-scale, randomized controlled trials providing robust clinical evidence. Standardized treatment protocols, long-term efficacy and safety profiles, and a comprehensive understanding of its underlying mechanisms remain insufficiently explored, hindering broader clinical adoption and consensus on its therapeutic potential. One of these interventions is repetitive transcranial magnetic stimulation (rTMS). As a noninvasive, safe brain stimulation device, rTMS can help stroke victims regain brain function by rebalancing the equilibrium of interhemispheric activity (Cramer et al., 1997) and inducing long-lasting neuroplasticity changes (Sasegbon et al., 2020). Based on various studies measuring motor evoked potentials (MEP) in healthy subjects, there is a consensus that low-frequency (≤1 Hz) stimulation is ‘inhibitory,’ while high-frequency (≥5 Hz) stimulation is ‘excitatory,’ with effects depending on the intensity and number of pulses (Lefaucheur et al., 2020). A 2018 meta-analysis of 41 trials (2660 participants) looked at previous interventions for swallowing disorders and discovered that repetitive transcranial magnetic stimulation (including 9 trials) may shorten patients’ hospital stays, improve swallowing function, and reduce the occurrence of pulmonary infections (Bath et al., 2018). Another systematic review and meta-analysis of rTMS for dysphagia after stroke in 2021 showed that rTMS is more effective than conventional training for the recovery of dysphagia (Yang et al., 2021). These findings indicate that high-frequency rTMS is superior to low-frequency rTMS in treating poststroke dysphagia; stimulating the healthy side or both hemispheres is superior to stimulating the damaged side (Bath et al., 2018; Yang et al., 2021). However, several obstacles have hindered the integration these therapies into standard clinical practice, including individual differences in response, questionable safety in treating patients with comorbidities, and a lack of satisfactory data from large-scale clinical trials (Cheng and Hamdy, 2021).
In contrast to other diseases, the stimulation site in rTMS treatment for poststroke patients is comparatively solitary. The site is usually determined by the MEP of the mylohyoid muscle induced by single pulse transcranial magnetic stimulation (TMS) on the unaffected hemisphere within the pharyngeal motor area, which is referred to as the TMS hotspot (Du et al., 2016; Kern et al., 2001; Khedr et al., 2009; Kim et al., 2011; Lim et al., 2014; Park et al., 2017; Unluer et al., 2019). While the mylohyoid and pharyngeal motor hotspots are the only parts of the swallowing motor system that have been significantly studied and have robust evidentiary support (Gow et al., 2004b), we still question their accuracy. Although the use of intraluminal pharyngeal catheters to measure MEP can enhance target localization, the treatment target is determined based on the MEP of a single muscle involved in swallowing. This means that the mylohyoid hotspot reflects the cortical area corresponding to this single muscle on the unaffected side, without considering all the other swallowing-related muscles, as well as the sensory and autonomic nervous systems involved in the complex swallowing process (Leopold and Daniels, 2010). Functional magnetic resonance imaging (fMRI) is an effective noninvasive tool for studying brain function because it recognizes fluctuations in the blood oxygen level-dependent signal as an indirect measure of neuronal activity (Ogawa et al., 1992). Furthermore, task-based fMRI can identify the exact brain regions used for a given task. Previous studies have shown that fMRI is a useful imaging modality for assessing alterations in neuronal activity in the bilateral hemispheres during swallowing by identifying regions of cerebral cortex activation during the process (Soros et al., 2009).
As a result, rather than the usual way of determining stimulation spots mentioned above, i.e., the TMS hotspot method, we aimed to use fMRI scans to establish the therapeutic stimulation location of poststroke dysphagia based on swallowing task, which has never been explored. Due to the immediate effect of a single rTMS therapy session (Lefaucheur et al., 2020), we can evaluate and judge whether site is superior based on clinical improvements in swallowing and activation changes in swallowing-related brain regions before and after each rTMS treatment. This is how we developed the ABBA plan, where A represents the bilateral activation peaks, and B represents the bilateral TMS-induced hotspots. This strategy makes individualized spot-guided rTMS therapy feasible, which also has never been studied before.
We first identified changes in brain activation during volitional swallowing in healthy controls to determine the hotspot. Subsequently, we developed a new rTMS protocol and applied it in a single case study of a patient with poststroke dysphagia as a proof of concept. In this study, we hypothesize that the peaks of activation identified through functional MRI (fMRI) during saliva swallowing exhibit more intense functional connectivity with swallowing-related brain regions compared to the traditionally targeted TMS hotspots. By guiding rTMS treatment based on these activation peaks, we propose that it is possible to achieve a more significant improvement in swallowing function in individuals with poststroke dysphagia. A systems-level technique used to assess the connectivity between a seed region and other brain regions is known as ‘resting-state fMRI seed-based functional connectivity’. It illustrates how dispersed brain regions linked to specific processes can synchronize over time (Cole et al., 2010; Hampson et al., 2002). We aim to investigate the functional network differences between the peaks activated by swallowing saliva and the hotspots induced by TMS. We also examined how functional connectivity between swallowing-related brain regions changed in this patient before and after rTMS therapy.
Materials and Methods
Participants
20 healthy right-handed participants were recruited through advertisements. Each participant provided written informed consent and confirmed they had no history of intoxication, head injury, or neurological or mental conditions. Two participants did not complete this study, two were excluded for head motion exceeding 3 millimeters or head rotation exceeding 3 degrees, and four were excluded for not having a resting state fMRI scan. Therefore, a total of 16 participants completed saliva swallowing study (9 males, 23–27 years old, mean age ± standard deviation: 25.0 y ± 1.5), and 12 participants complete the whole study and all the scans (6 males, 23–27 years old, mean age ± standard deviation: 25.1 y ± 1.6). The ethics committee of the Affiliated Hospital of Hangzhou Normal University reviewed and approved the research involving human volunteers [2021(E2)-HS-041]. Participants provided written informed consent for this study, and additional consent was obtained for the use of any potentially identifiable images or data.
Case description
Patient Z is a 47-year-old male with a history of hypertension. He experienced left limb paralysis and difficulty swallowing two years ago due to a right brainstem infarction. For details about the patient’s MRI scans, neurological function evaluation, and swallowing function assessment at admission, please refer to the Supplementary Data S1.
Experimental design
Prior to the fMRI experiment, operant training was given to all healthy participants and patient Z to ensure that they were familiar with the entire procedure, including the structural, resting, and task-related functional scans. Earplugs were also worn to reduce scanner noise. The participants were advised to remain alert yet relaxed, close their eyes, and stay still during the T1 scan, which was used to obtain the structural image. Wearing cervical gear to reduce head motion, all participants were told to repeatedly swallow at a comfortable, self-paced rhythm. Participants began swallowing their saliva when a picture of an arrow appeared in the middle of the screen. A 30-sec fixation was interspersed with a 30-sec picture. In total, there are 6 blocks, each lasting 60 sec (Fig. 1a). These precise parameters came from our earlier exploratory investigations (Chen et al., 2023). During the resting-state fMRI session, participants were instructed to close their eyes, relax, remain still, not focus on anything specific, and avoid falling asleep. They next proceeded to the TMS room.

The experimental design for this investigation was a single-case study with healthy controls. We designed a plan called “ABBA” to determine which target, the activation peaks or the TMS-induced hotspots, was more suitable for patient Z. A represents activation peaks, while B represents hotspots. Using a facilitatory rTMS protocol, we performed noninvasive brain modulation on the A or B target of patient Z. We applied A on the first day, B on the second, took a day of rest to eliminate cumulative effects, B on the third day, and A on the final day. And an fMRI scan was performed after each rTMS treatment of that day. The Water Swallow Test (WST) and the Standardized Swallowing Assessment (SSA) were conducted before and after each rTMS treatment of that day (Fig. 1b). Based on the swallowing score findings before and after each day of therapy, together with examination of the fMRI scan results, we chose either A or B as the next treatment target. Subsequently, we examined changes in swallowing behavior and conducted consecutive fMRIs immediately following rTMS and 4 weeks later to identify distinct brain activity patterns and functional connections associated with swallowing.
Data acquisition (details in Supplementary Data S2)
MRI data were gathered using a GE 3T scanner, including 8-min resting-state and 6-min task sessions. Key parameters: TR = 2000 ms, TE = 30 ms, FA = 90°, 43 slices, matrix = 64 × 64, FOV = 220 × 220 mm, voxel size = 3.44 × 3 mm. Preprocessing used DPABI_V6.0 based on SPM12. Bilateral mylohyoid muscle MEPs were recorded with surface Electromyography (EMG). Single pulse TMS with a figure-8 coil identified the mylohyoid motor hotspot using the BrainSight navigation system. The rTMS protocol included 10 Hz stimulation at 120% Resting Motor Threshold (RMT), with 500 pulses per session over 10 days. Swallowing function was assessed using SSA, 3-oz WST, and video fluoroscopic swallowing study (VFSS), with Penetration Aspiration Scale (PAS) and Videofluoroscopic Dysphagia Scale (VDS) scoring before, immediately after, and 4 weeks post-rTMS treatment.
We used Gaussian Random-Field (GRF) correction, family-wise error (FWE) correction, and Bonferroni correction to ensure robustness of the results.
Statistical analysis
Identification of task fMRI activation
Group-level statistical analysis and subject-level activation analysis were conducted using SPM12 (high-pass filtering, >1/128 Hz, was selected under “fMRI Model specification”). The group-level activation maps and brain regions of 16 healthy participants are shown in Supplementary Figure S1 and Supplementary Table S1 (GRF corrected, voxel level p < 0.0001, cluster level p < 0.05, two-tailed). Patient Z’s activation map before rTMS treatment, each time after ABBA, immediate after rTMS treatment, and 4 weeks after treatment were recorded in Supplementary Figure S3 (GRF corrected, voxel level p < 0.0001, cluster level p < 0.05, two tailed).
In SPM12, a generalized linear model was used to calculate each individual contrast image. Age-based two-sample t-tests were used to compare the conditions before and after rTMS in the healthy control group. The two-sample t-test was conducted using a FWE rate of 0.05 at the cluster level. The cluster size comprised more than 30 contiguous voxels.
fMRI peaks vs. TMS hotspots in the pericentral gyri
The presentation of the saliva swallowing task was defined as the bilateral peak voxels in the pericentral gyri under a strict threshold for each participant (including patient Z pre-rTMS). The Montreal Neurological Institute (MNI) coordinates of hotspot for mylohyoid muscle were exported from BrainSight system. These coordinates were all positioned above the scalp. The exported scalp coordinates were converted to cortical coordinates by going 6 mm deeper along the line that runs perpendicular to the tangent that passes through the specific location. The coordinates were then transformed into MNI space coordinates in Matlab using a unique code based on each individual’s T1 structural image. Finally, the bilateral locations for each subject (Supplementary Data S3) were determined as the presentation of TMS-induced movement of mylohyoid muscle in the brain. These coordinates were employed to compare the difference in locations between fMRI saliva swallowing activation and TMS-induced movement by using SPSS (https://www.ibm.com/analytics/spss-statistics-software).
Resting‐state fMRI functional connectivity
Using the coordinates of TMS-induced movement presentations and fMRI saliva swallowing peak voxels found in Supplementary Data S3, voxel-wise functional connectivity of resting-state fMRI data was calculated. The mean time course of a sphere (radius 6 mm) centered at the seed point for each participant was initially obtained to ascertain the functional connectivity. At the group level, one-sample t-test was run for each type of movement. Significant functional connectivity with the seed region was considered to be present in voxels above a corrected threshold (voxel level p < 0.00000000001, cluster level p < 0.05, GRF adjusted). The two kinds of functional connectivity maps over the entire brain were compared using a paired t-test. Voxels above the corrected threshold (voxel level p < 0.00000000001, cluster level p < 0.05, GRF corrected) were considered to indicate a significant difference in functional connectivity between the two types of movement. Between healthy participants and patient Z, there was no statistically significant difference in functional connectivity. Only the changes in the functional connectivity between Regions of Interest (ROIs) before and after rTMS treatment are depicted in the functional connectivity matrix diagram.
Results
Swallowing task-based fMRI activation areas in the brain (healthy participants)
To investigate the effectiveness of our designed task in activating relevant brain regions, we performed fMRI activation analysis in healthy participants and patient Z. Numerous brain regions were activated during the saliva swallowing task, including the bilateral pericentral gyri, bilateral supplementary motor area, bilateral anterior cingulate cortex, bilateral cerebellum, bilateral basal ganglia, bilateral insula, bilateral thalamus, bilateral lingual gyri, and left inferior parietal lobe (Supplementary Fig. S1 and Supplementary Table S1). Numerous brain regions were activated during the saliva swallowing task, confirming the task’s effectiveness in activating swallowing-relevant brain regions.
The distinctions between TMS hotspots and fMRI swallowing activations (healthy participants)
To compare the spatial differences between TMS hotspots and fMRI activation peaks, and their respective locations, we performed paired t-tests. The bilateral hemispheres’ Y axis differed significantly, as demonstrated by paired t-tests (Bonferroni correction, 0.05/3 = 0.0167, actual p < 0.001, Table 1). The activations associated with swallowing saliva were located more posteriorly in both hemispheres (Y axis, respectively, Fig. 2).
The Differences of Spatial Localizations in Bilateral Hemispheres (Saliva Swallowing Activation vs. Mylohyoid Muscle Hotspot)
Bonferroni correction.
AP, Activation Peak; MH, Mylohyoid Hotspot.

Localization of the bilateral pericentral areas with fMRI activation and TMS hotspot. The red ellipsoid indicates mean MNI coordinates (±SD) of the TMS hotspot, and the yellow ellipsoid indicates mean MNI coordinates (±SD) of fMRI activation peak voxel. L, left hemisphere; R, right hemisphere; fMRI, Functional magnetic resonance imaging; TMS, transcranial magnetic stimulation.
Functional connectivity results (healthy participants)
To determine which point better activates functional connectivity with swallowing-related brain regions, we analyzed functional connectivity maps based on fMRI activation peaks and TMS hotspots. Figure 3A and 3B (top two rows) displayed the functional connection maps based on mylohyoid muscle hotspots and fMRI activation peaks. For the left hemisphere, the fMRI activation seeds showed positive connectivity with the bilateral cerebellum, insula, cingulate cortex, supplementary motor area, temporal lobe, occipital lobe, parietal lobe, sensorimotor area and left thalamus, negative connectivity with the bilateral cerebellum, temporal lobe, visual area, cingulate cortex, supplementary motor area, frontal lobe. The hotspot seeds showed positive connectivity with the bilateral cerebellum, sensorimotor area, left temporal pole (TP), left middle temporal gyrus, left insula, left supplementary motor area, negative connectivity with bilateral cerebellum, visual area, cingulate cortex, frontal lobe. According to paired t-tests, the saliva swallowing activation seeds had significantly positive functional connectivity than TMS-induced seeds in bilateral postcentral gyri, significantly negative functional connectivity than TMS-induced seeds in right cerebellum, left inferior frontal gyrus, right middle frontal gyrus, left inferior parietal gyrus and left supplementary motor area (SMA) (Fig. 3a, bottom row; Supplementary Table S2). For the right hemisphere, the fMRI activation seeds showed positive connectivity with the bilateral cerebellum, insula, TP, cingulate cortex, supplementary motor area, sensorimotor area and left thalamus, negative connectivity with the bilateral cerebellum, temporal lobe, visual area, cingulate cortex, supplementary motor area, frontal lobe. The hotspot seeds showed positive connectivity with the bilateral cerebellum, insula, TP, middle temporal gyrus, cingulate cortex, supplementary area, parietal lobe, sensorimotor area, negative connectivity with the bilateral cerebellum, temporal lobe, frontal lobe, cingulate cortex, and visual area. Paired t-tests revealed that the saliva swallowing activation seeds had significantly more positive functional connectivity than TMS-induced seeds in bilateral postcentral gyri, and no significantly more negative functional connectivity was observed for mylohyoid muscle activation than that of TMS-induced seed (Fig. 3B, bottom row; Supplementary Table S2). fMRI activation peaks showed stronger functional connectivity with swallowing-related brain regions compared to TMS-induced seeds.

The activation-based and mylohyoid muscle hotspot-based whole brain functional connectivity maps (voxel level p < 0.00000000001, cluster level p < 0.05, GRF corrected) (
Identification of the treatment targets for patient Z (patient)
To identify the most suitable treatment target for patient Z based on clinical effectiveness, we compared the bilateral peak voxels from fMRI and TMS hotspots. Under a strict threshold, the bilateral peak voxels of patient Z in the pericentral gyri were situated in the bilateral postcentral gyri (−47, 32, 17 and 53, 15, 32), called the “A” target, generated by the saliva swallowing task. The MNI coordinates of hotspots for mylohyoid muscle in patient Z were found in the bilateral inferior frontal gyri (−54, −9, 51 and 63, −9, 36), which was termed the “B” target generated by TMS (Supplementary Fig. S2). During the first AB phase, fMRI activation and hotspot-induced rTMS treatment reversed WST and SSA to the same extent. However, fMRI activation-induced rTMS treatment obviously enhanced WST and SSA in the second BA treatment phase compared to mylohyoid muscle hotspot-induced rTMS treatment (Supplementary Data S4). Therefore, we choose plan A, that is, fMRI activation peak-guided, as the rTMS treatment target, and carried out later treatment for the patient. fMRI activation peaks were identified as the most suitable rTMS treatment targets for patient Z based on clinical improvements.
Brain activation changes in fMRI during ABBA plan (patient)
To analyze the differential brain activation between fMRI activation peaks and TMS hotspots, we assessed the imaging differences to determine the suitability of fMRI activation for patient Z. In comparison to the healthy control, this patient significantly overactivated the right superior parietal lobe, right thalamus, vermis, and left cerebellum when performing saliva swallowing before the “ABBA” plan. However, after receiving ABBA rTMS therapy, this overactivation was reduced (Supplementary Fig. S3).
In patient Z, when compared to the pre-rTMS condition, the first A suppressed the activity of the vermis, bilateral thalamus, right superior frontal gyrus, and left postcentral gyrus. Compared to the first A, the activation of the right superior temporal gyrus, left postcentral gyrus, and left parahippocampal gyrus were inhibited after the first B. In comparison to the pre-rTMS state, the activity of the left hippocampus and the right supplementary motor region were suppressed after the second B. In comparison to the second B, the second A inhibited the right cerebellum, left inferior temporal gyrus, right lingual gyrus, right middle frontal gyrus, right precentral gyrus, bilateral postcentral gyri, right occipital gyrus, and right middle cingulate cortex (Fig. 4, Supplementary Table S3). After ABBA rTMS therapy, the patient’s overactivation in several brain regions was significantly reduced.
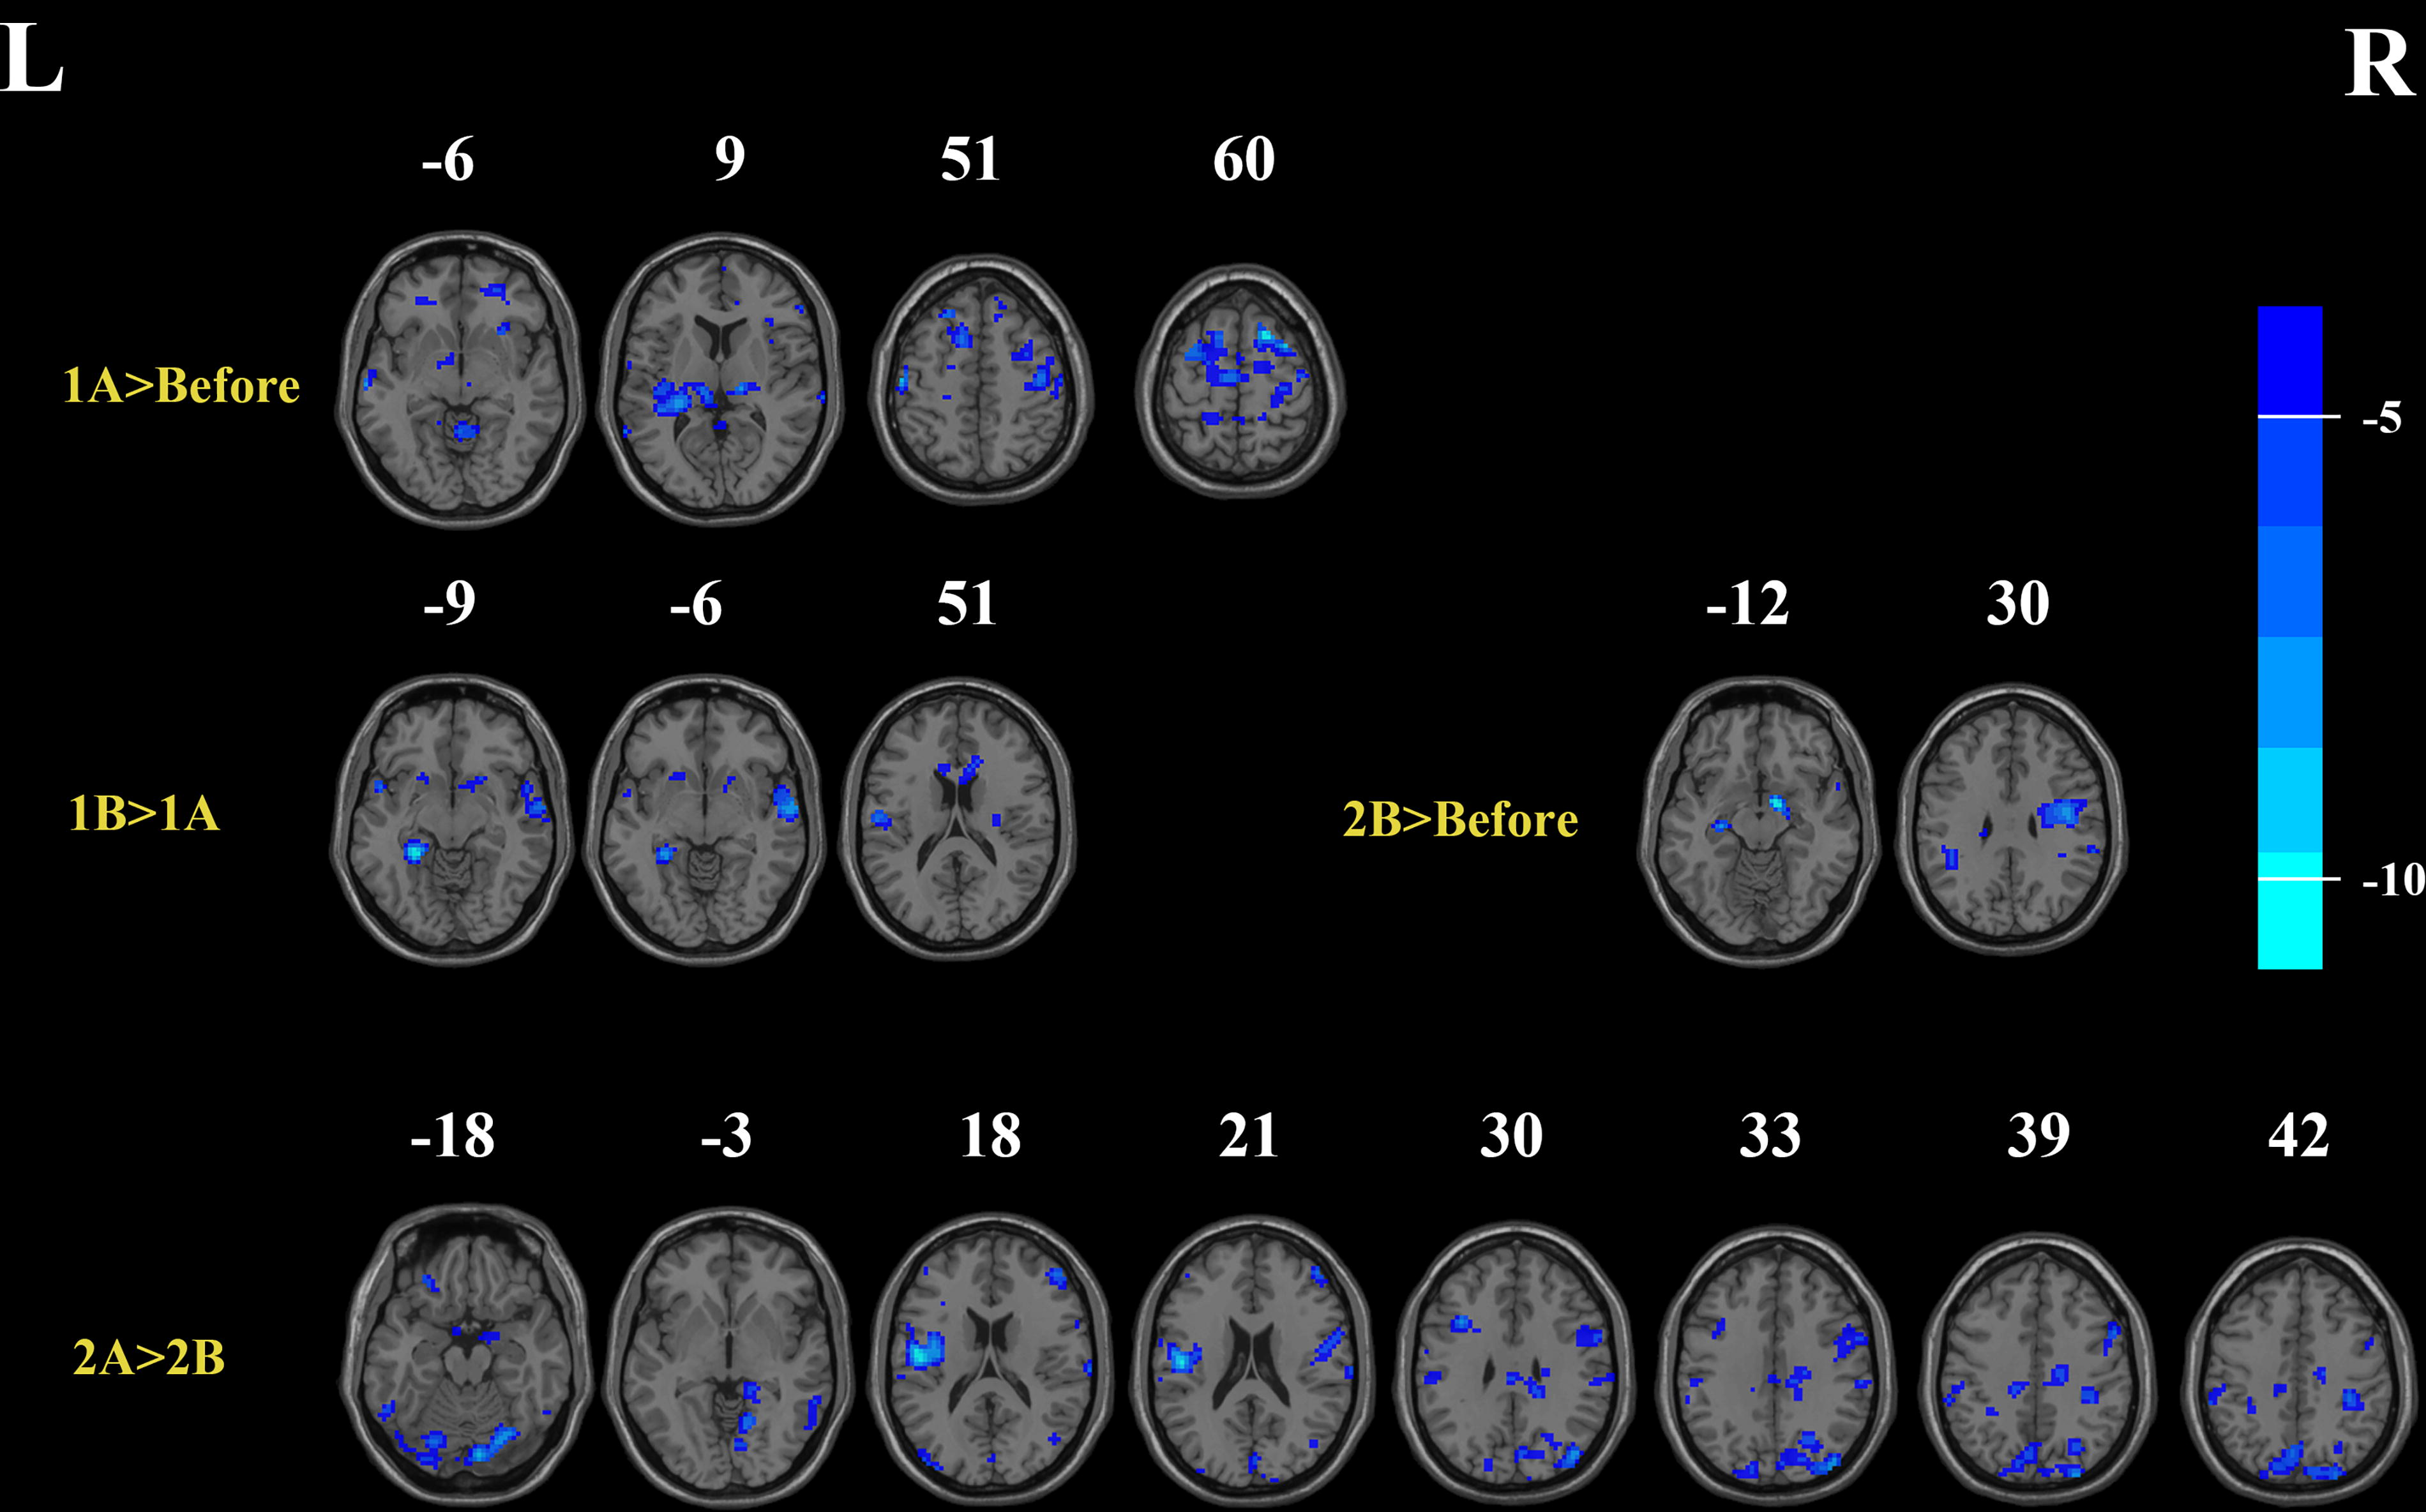
Deactivation (blue colors) produced by rTMS treatment in Patient Z compared with each state (voxel level p < 0.0001, cluster level p < 0.05, GRF corrected). 1A>Before, deactivation of brain area after the fMRI activation peaks-guided treatment in the first day compared to pre-rTMS state; 1B > 1A, deactivation of brain area after the TMS hotspots-guided treatment in the second day compared to state after the first day treatment; 2B>Before, deactivation of brain area after the TMS hotspots-guided treatment in the fourth day compared to pre-rTMS state. 2A > 2B, deactivation of brain area after the fMRI activation peaks-guided treatment in the fifth day compared to state after the fourth day treatment. fMRI, Functional magnetic resonance imaging; rTMS, repetitive transcranial magnetic stimulation; TMS, transcranial magnetic stimulation.
Changes in clinical symptoms with rTMS (patient)
To evaluate the clinical improvement in swallowing function, we assessed patient Z’s symptoms before and after rTMS treatment. Following the entire rTMS operation, the patient reported a subjective improvement in swallowing. The VFSS data revealed a reduction in the vallecular space residue when swallowing solids following immediate rTMS therapy. Four weeks after the completion of rTMS, the shortened pharyngeal transit time remained while swallowing solids, but the vallecular space residue recovered. When swallowing semi-solids, there was a shorter pharyngeal transit time, decreased tongue-to-palate contact, and reduced premature bolus loss following immediate rTMS therapy, and these effects persisted for 4 weeks after the end of rTMS along with a less pyriform sinus residue and a reduction in pharyngeal wall coating (Fig. 5). The VDS score for ingesting liquid was not improved. According to the VFSS data, material never entered the airway, hence the PAS remained 1 before and after all the rTMS therapy. The WST and the SSA indicated that patient Z’s swallowing function improved dramatically immediately after rTMS therapy, and this improvement partially persisted for 4 weeks (Supplementary Data S4). Patient Z’s swallowing function improved significantly after rTMS therapy, with some effects persisting for 4 weeks.
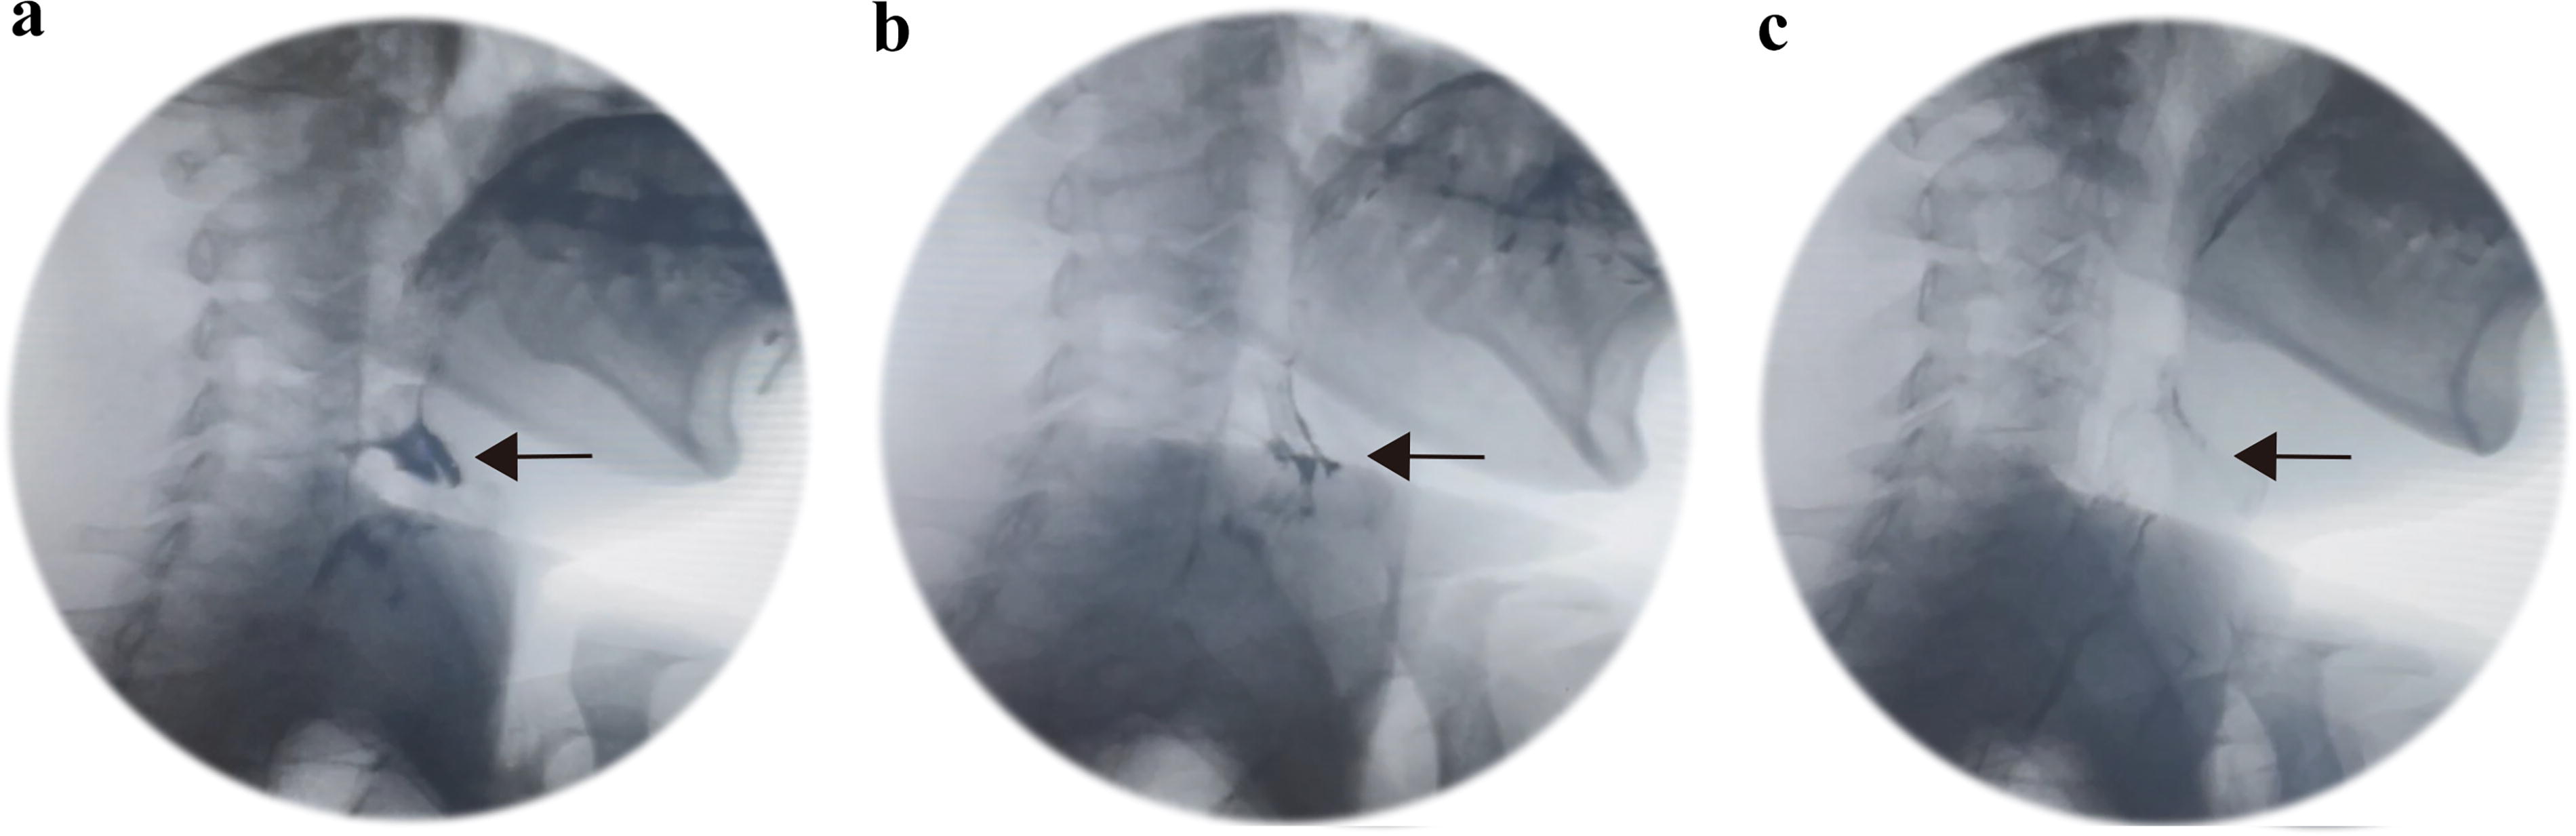
VFSS image taken before rTMS treatment
fMRI brain activity changes following rTMS (healthy vs patient)
To observe the imaging changes in the brain of patient Z before and after rTMS treatment, we compared the pre- and post-treatment fMRI scans. Healthy controls displayed neural activation in the bilateral cerebellum, insula, basal ganglia, thalamus, anterior cingulate cortex, supplementary motor area, pericentral gyri, left inferior parietal lobe, and right lingual gyrus upon volitional swallowing (Fig. 6A, Supplementary Table S1). In comparison to healthy controls, the patient’s pre-rTMS fMRI showed more widespread neural activation (Table 2 and Supplementary Fig. S4A). Nonetheless, in post1 and post2-rTMS, the patient’s neuronal activity turned to deactivation (Fig. 6C, D and Supplementary Table S4). The patient showed significantly extensive activation in the right superior parietal gyrus, right thalamus, vermis, left cerebellum in pre-rTMS compared to healthy controls, and significantly extensive activation was still found in the right superior parietal gyrus, vermis, left cerebellum of the patient at post1-rTMS compared to healthy controls (Table 2, Supplementary Fig. S4 A, B). No significant extensive activation was found between the patient at post2-rTMS and healthy controls.
Brain Regions Display Significant Differences Between Healthy Controls and Pre-rTMS (Before rTMS) and post1-rTMS (Immediately After rTMS) in Patient Z During Swallowing (Family-Wise Error-Corrected p < 0.05, More Than 100 Voxel) and Between Pre- and Post-rTMS in Patient Z (Voxel Level p < 0.0001, Cluster Level p < 0.05, GRF Corrected, Cluster Size >30 Voxels)
AAL, Anatomical Automatic Labeling, L, left, R: right; TMS, transcranial magnetic stimulation.

T-score map of healthy controls in group level
The patient’s fMRI showed more neural deactivation at post1-rTMS in the left cerebellum, right inferior temporal gyrus, left rectus gyrus, left supplementary motor area, and left postcentral gyrus than at pre-rTMS, whereas the patient at post2-rTMS showed more neural deactivation in right cerebellum and left SMA than at pre-rTMS. At post2-rTMS, the patient showed more deactivation in right cerebellum, left TP, bilateral postcentral gyri, right middle temporal gyrus, bilateral frontal gyri than at post1-rTMS. (Table 2, Supplementary Fig. S4C-E). Post-rTMS, the overactivated brain regions in patient Z were significantly suppressed compared to pre-rTMS.
Neural connectivity changes after rTMS (healthy vs patient)
To investigate changes in functional connectivity following rTMS treatment, we analyzed the functional connectivity matrices of patient Z before and after the treatment. Functional connectivity (FC) matrices of saliva swallowing task of patient Z at pre-rTMS, post1-rTMS and post2-rTMS are shown in Supplementary Figure S5. Diagonal diameter of the FC matrix from upper left to lower right corner represents connectivity of each ROI to itself, which is a value of 1 (fully correlated). Lower left and upper right triangles of FC matrix on either side of this diagonal diameter represent identical mirror image connectivity information.
FC matrices showed a pattern of relatively more positive FC among swallow-related ROIs, as demonstrated in red boxes, depicted in warm colors yellow-orange (Supplementary Fig. S5).
The patient at pre-rTMS exhibited relatively more positive connectivity between the bilateral SMA and right precentral gyrus (preCG), right SMA and right postcentral gyrus (postCG), left TP and right pericentral gyrus (periCG), left TP and bilateral SMA. The patient at post1-rTMS exhibited relatively more positive connectivity between right SMA and right periCG, left insula and right periCG, right SMA, right anterior cingulate cortex (ACC), right insula and right ACC, left TP and left SMA, right TP and right postCG, right cerebellum and right preCG, right SMA, right basal putamen, brainstem and right insula, bilateral caudate. The patient at post2-rTMS exhibited relatively more positive connectivity between bilateral SMA and right preCG, bilateral insula and left ACC, right insula and right ACC, bilateral caudate and right ACC, left TP and right periCG, bilateral SMA, bilateral TP and left insula, bilateral cerebellum and bilateral ACC, brainstem and bilateral ACC, insula, caudate, cerebellum (Supplementary Fig. S5). Functional connectivity in patient Z increased between swallowing-related ROIs after rTMS treatment.
Discussion
The aim of this study was to compare the effectiveness of using fMRI activation peaks versus TMS-induced hotspots as targets for rTMS treatment in improving swallowing function in patients with dysphagia. We investigated the spatial differences and functional connectivity between these two targets and assessed the clinical improvements and changes in brain activity following rTMS treatment.
The fMRI activation peaks were located considerably more posteriorly and exhibited significantly better functional connectivity with bilateral postcentral gyri in comparison to the TMS-induced hotspots. Our choice to treat at the activation peaks was influenced by the patient’s overactivated swallow-related brain areas, which gradually repressed as the rTMS treatment progressed. After receiving rTMS treatment, patient Z developed a functional connection between the brainstem and the bilateral insula, caudate, anterior cingulate cortex, and cerebellum.
Swallowing task-based fMRI activation areas in the brain
In our investigation, group-level activation for saliva swallowing in healthy controls included the bilateral precentral gyri, postcentral gyri, insula, basal ganglia, thalamus, anterior cingulate cortex, supplementary motor area, cerebellum, left inferior parietal lobe and right lingual gyrus, all of which are thought to be functionally representational swallowing brain areas (Mihai et al., 2014), aligning with the conclusions of earlier reviews (Michou et al., 2012; Suzuki et al., 2003). The temporal analysis demonstrated a series of activations that culminated in activation in the pons just before subsiding, beginning at the premotor cortex, SMA, and bilateral thalamus, and progressing to the primary sensorimotor cortex, the posterior insula, and the cerebellum (Dziewas et al., 2003; Mihai et al., 2016). There may be minor variations between various swallowing tasks. Before choosing this specific swallowing task in our experiment, we created several swallowing tasks and concluded that this specific task could best reflect the activity of the subjects’ swallowing brain areas in our pre-test. And it turns out that the saliva swallowing task we devised was a good fit. Our results suggested that this task is a reasonable one to employ to evaluate alterations in activity in brain regions associated with swallowing in patients who have dysphagia following a stroke.
The distinctions between TMS hotspots and fMRI swallowing activations
Our study discovered a spatial mismatch in the cortex between saliva swallowing fMRI activation and TMS-induced hotspot, with the fMRI activity being more posterior than the hotspot in both hemispheres. Most hotspots are located in the motor cortex or premotor cortex (primarily in BA6, Supplementary Data S3), whereas most activation peaks are located in the sensory cortex (primarily in BA43, Supplementary Data S3). Although such mismatches may vary depending on fMRI tasks (Humbert and Robbins, 2007; Jing et al., 2020; Kober et al., 2019; Lima et al., 2015) and TMS parameters, this is the first time the discrepancy has been discovered. The cortical regions involved in swallowing, known as the main sensorimotor cortex (SM1), are well-known. Additionally, it has been proposed that M1 is responsible for the initiation and the execution of swallowing (Hamdy et al., 1999; Malandraki et al., 2009; Mosier and Bereznaya, 2001). Cortical mapping experiments employing TMS have shown efferent projections from M1 to the swallowing musculature, including the mylohyoid, pharyngeal, and esophageal muscles (Aziz et al., 1995; Hamdy et al., 1996). The mylohyoid hotspot corresponds to the unaffected side of the mylohyoid muscle, representing a portion of the swallowing process in execution. The swallowing fMRI task demands more voluntary action compared to the TMS-induced hotspot (Domin et al., 2022). The swallowing fMRI task can reflect the entire swallowing process (Mihai et al., 2014), includes preparation and execution. Preparation for swallowing activates a more posterior region corresponding to the bilateral primary somatosensory cortex (Dziewas et al., 2003; Malandraki et al., 2009; Martin et al., 2004; Mosier and Bereznaya, 2001). Researches have also indicated that the oral, laryngeal, pharyngeal, or esophageal regions receive various types of sensory information that activate S1 (Aziz et al., 1997; Faurion et al., 1998; Furlong et al., 2004; Gow et al., 2004a; Miyaji et al., 2014; Zald and Pardo, 2000). It is a voluntary procedure that integrates sensory information with swallowing, engaging both sensory and motor components of the cerebral swallowing system (Cheng et al., 2022; Lowell et al., 2008). Saliva swallowing is a voluntary swallowing process that requires proper preparation and execution. This, we assume, explains why the activation seeds located more posteriorly than the hotspot seeds.
The brain regions related to swallowing exhibit strong functional connections with both the left and right hemispheres’ activation seeds and hotspot seeds. Paired t-tests revealed that the saliva swallowing activation seed had significantly stronger functional connectivity in the bilateral postcentral gyri than the TMS hotspot seed in both hemispheres. Previous reports have consistently demonstrated the involvement of the sensory cortex throughout the swallowing process. To govern and execute actions, the sensory cortex provides feedback to the brainstem and manages the bulbar tract, which directly connects swallowing-related areas in the primary motor cortex and the brainstem (Gonzalez-Fernandez et al., 2013; Suntrup-Krueger et al., 2017; Teismann et al., 2007). Although the brainstem can still produce swallows, they become less coordinated when sensory cortex control is lost or diminished (Teismann et al., 2007). Lesions in the sensory cortex may be associated with the onset of dysphagia in general (Suntrup-Krueger et al., 2017), as well as laryngeal elevating injury and vestibular closure, according to lesion-symptom mapping research conducted on stroke patients (Wilmskoetter et al., 2019). Relearning to swallow also heavily depends on the sensory cortex, particularly in patients with dysphagia caused by subcortical lesions, where fMRI activation was decreased throughout the swallowing network except in the contralateral primary sensory cortex (Mihai et al., 2016). Increased somatosensory demand in poststroke dysphagia results in increased fMRI activation magnitude of the contralesional S1 (Mihai et al., 2016). This underlines the importance of the somatosensory cortex in recovered swallowing function. On the other hand, the TMS hotspot seeds were found to have significantly stronger functional connectivity in some brain regions compared to the saliva swallowing activation seeds in left hemisphere. These regions include the right cerebellum, left inferior frontal gyrus, right middle frontal gyrus, left inferior parietal gyrus, and left supplementary motor area. As previously mentioned, these regions are less actively and profoundly involved in swallowing compared to the somatosensory cortex (Toogood et al., 2017). Although multiple studies have shown cerebellum activation (Hamdy et al., 1999; Mosier and Bereznaya, 2001; Mosier et al., 1999; Zald and Pardo, 1999), its contributions have not been as significant as those of other cortical regions. No significantly stronger functional connectivity was found in the TMS hotspot seeds compared to the saliva swallowing activation seeds in right hemisphere, due to the possibility of lateralized swallowing activation (Lowell et al., 2012; Mihai et al., 2016). Given that the aforementioned research publications highlight the importance of the postcentral gyri in the swallowing process, it is possible that activation peaks, rather than hotspots, would make better therapeutic targets.
Determination of patient Z’s individualized treatment spots
We primarily selected treatment spots based on the patient’s clinical improvement in swallowing function during the ABBA protocol. The improvement in WST and SSA before and after each rTMS treatment guided by A or B was comparable for the first A, first B, and second B; however, there was a dramatic improvement before and after the second A. This explains our decision to use A, the activation peaks, as the treatment site for patient Z. This is consistent with our results from experiments with healthy controls, where activation peaks perform better than conventional hotspots. We also conducted fMRI scans after each rTMS therapy session to further understand activation changes in brain regions related to swallowing. Before starting treatment, the brain regions connected to swallowing in patient Z were more widely overactivated compared to those of normal controls. This is consistent with earlier study findings, which suggest that compensatory overactivation is crucial for the recovery of swallowing after a stroke (Cheng et al., 2022; Kober et al., 2015; Li et al., 2009). Since the patient’s lesion is in the brainstem, it is plausible that the increased activation in the bilateral cortex, subcortex, and cerebellum represents a compensatory recruitment of intact neural networks necessary for recovery. However, these overactivated regions were gradually inhibited as the rTMS treatment continued. It is evident that encouraging the reconfiguration of the swallowing neural network progressively restores equilibrium. The extent and nature of this inhibition were compared following each A or B-guided rTMS therapy to determine which target could be more appropriate for this particular patient. The overactivated brain regions associated with swallowing that were suppressed are as follows: the bilateral thalamus and the left postcentral gyrus were inhibited after the first A; the left postcentral gyrus was further inhibited after the first B; the right SMA was inhibited after the second B; and the right cerebellum, right precentral gyrus, and bilateral postcentral gyri were inhibited after the second A. We believe that for this particular patient, whose brain regions related to swallowing are broadly activated after stroke, A-guided rTMS treatment has a greater inhibitory effect than target B. This is because sensorimotor cortex is the most important brain region to investigate when understanding the functioning of areas connected to swallowing, followed by cingulate cortex, supplementary motor area, premotor cortex, basal ganglia, cerebellum (Hamdy et al., 1999; Hartnick et al., 2001; Li et al., 2009; Paine et al., 2011; Suzuki et al., 2003; Toogood et al., 2005). These findings were consistent with clinical improved.
Clinical symptom, brain activation and functional connectivity changes after rTMS in patient Z
Assessments of the patient’s swallowing ability revealed that, although progress diminished 4 weeks after starting rTMS treatment, the patient’s ability to swallow remained better than it had been before. When swallowing solids and semi-solids, patient Z’s VDS, based on the VFSS, demonstrated an improvement in swallow preparation and execution.
The bilateral postcentral gyri, left SMA, left TP, and bilateral cerebellum-overactive brain regions intimately associated with voluntary swallowing-were gradually repressed following the patient’s rTMS treatment. This aligns with previously published studies on the inhibitory action of high-frequency rTMS treatment on the region of the swallowing brain (Choi and Pyun, 2021; Obeso et al., 2013). Pre-rTMS, patient Z had significantly more widespread activation in the right superior parietal gyrus, right thalamus, vermis, and left cerebellum as compared to healthy controls (Supplementary Fig. S4A). Our findings suggest that, comparison to healthy controls, this patient may require greater resources to manage swallowing from the overactivated brain regions mentioned above. The thalamus, in particular, acts as a transfer station for the primary afferent and efferent impulses traveling from the cortex to the ponto-medullary swallowing center (Leopold and Daniels, 2010). Damage to the brainstem swallowing center causes compensatory overactivation of the thalamus. Additionally, we found that after receiving rTMS therapy, patient Z’s functional connections from the brainstem to the bilateral insula, basal ganglia, anterior cingulate, and cerebellar were restored. This may explain the inhibition of hyperactive brain areas in patients and their increased resemblance to healthy participants throughout rTMS treatment progression.
Given the patient’s lesion was in the brainstem, we were particularly interested in the changes in functional connectivity in the brainstem and the brain areas relevant to swallowing. We found that the patient’s various swallowing-related brain areas and the brainstem did not have a positive functional relationship before undergoing rTMS treatment. Functional connectivity between the brainstem and the right insula and bilateral caudate nucleus developed immediately following rTMS treatment. Four weeks following treatment, the increased connectivity spread to the bilateral insula, caudate, anterior cingulate cortex, and cerebellum. These regions are crucial to the swallowing process. The cerebellum is responsible for motor coordination and correction, the insula appears to be involved in synchronizing kinematic movement during swallowing, the basal ganglia initiates and selects motor programs, and the cingulate cortex connects the bilateral cerebral hemispheres, particularly the bilateral somatosensory area, to ensure the full and seamless progression of voluntary swallowing (Domin et al., 2022; Mosier and Bereznaya, 2001; Suzuki et al., 2003). The secondary swallowing center is located in the brainstem. Its links to other swallow-related regions are severed following stroke in patient Z. The functional connections between them were partly restored by our rTMS treatment. We believe this is a key mechanism that will help improve patient’s swallowing function.
The aim of this study was to compare the effectiveness of using fMRI activation peaks versus TMS-induced hotspots as targets for rTMS treatment in improving swallowing function in patients with dysphagia. Our study is original in utilizing task-based fMRI to identify precise stimulation sites for rTMS, rather than relying on traditional TMS hotspot areas.
In healthy participants, we found that the fMRI activation peaks were located more posteriorly and had significantly better functional connectivity with the bilateral postcentral gyri compared to TMS-induced hotspots. For patient Z, rTMS treatment guided by fMRI activation peaks led to a gradual suppression of overactivated swallow-related brain areas and developed functional connectivity between the brainstem and bilateral insula, caudate, anterior cingulate cortex, and cerebellum. These findings suggest that fMRI activation peaks may serve as more effective therapeutic targets for rTMS in treating dysphagia.
Limitations and future perspectives
There are several limitations in this study. Firstly, our trial was conducted during the COVID-19 pandemic, requiring participants to undergo repeated fMRI scans and clinical assessments of swallowing function before starting formal rTMS treatment. Therefore, this investigation was carried out as a single-case follow-up study using control subjects. To obtain more statistically meaningful results, it is essential to include a larger sample size of patients with dysphagia following a stroke in future studies. Secondly, the control analysis could be biased due to the small sample size of healthy subjects. To enhance the credibility of our results, we need to recruit more age-matched healthy participants as a reference group when increasing the sample size of patient subjects in the future. Although we performed age correction in our statistical analysis, the younger age of the healthy subjects compared to patient Z (median age 25 years vs. 47 years) remains a limitation that needs to be addressed. Thirdly, variations in the fMRI imaging sequences (such as spin-echo versus gradient-echo) have been observed to affect the fMRI activation peak. Future research should consider these variations to standardize the imaging protocols and ensure consistency in the results.
The primary limitation of this study is the use of a single patient case, which may limit the generalizability of the findings. While the results from patient Z are promising, they need to be validated in a larger cohort of patients to confirm the efficacy and reliability of using fMRI activation peaks as therapeutic targets for rTMS treatment of dysphagia. Additionally, exploring the application of this approach in other conditions such as ALS patients and elderly individuals with dysphagia-related difficulties could further demonstrate its clinical impact and potential for improving rehabilitation outcomes and quality of life for these populations.
However, our results highlight the potential clinical impact of using fMRI-guided rTMS for dysphagia treatment, which could be extended to other conditions such as ALS patients, elderly individuals with dysphagia-related difficulties, and potentially improving rehabilitation outcomes and quality of life for these populations.
Conclusion
The saliva-swallowing fMRI activation peaks exhibited more intense functional connectivity in the bilateral postcentral gyri compared to the TMS hotspots. Applying high-frequency rTMS to the swallow task fMRI activation area improved swallowing performance in the patient with poststroke dysphagia. The swallow task fMRI activation peaks could serve as individualized stimulation targets in future rTMS research to treat dysphagia following a stroke.
Footnotes
Acknowledgments
The authors thank all the subjects for participating in this study and
Authors’ Contributions
M.C.: Funding acquisition, conceptualization, formal analysis, methodology, writing—original draft, writing—review and editing, supervision. Z.H.: Formal analysis, investigation, resources, writing—original draft. Y.C.: Conceptualization, methodology, investigation, resources, writing—review and editing. X.Y., X.W.: Conceptualization, methodology, writing—review and editing. W.W.: Formal analysis, investigation, resources.
Author Disclosure Statement
The authors have no competing interests to declare that are relevant to the content of this article.
Disclaimer
This study was not supported by any study sponsors.
Funding Information
This work was supported by
Supplementary Material
Supplementary Data S1
Supplementary Data S2
Supplementary Data S3
Supplementary Data S4
Supplementary Figure S1
Supplementary Figure S2
Supplementary Figure S3
Supplementary Figure S4
Supplementary Figure S5
Supplementary Table S1
Supplementary Table S2
Supplementary Table S3
Supplementary Table S4
References
Supplementary Material
Please find the following supplemental material available below.
For Open Access articles published under a Creative Commons License, all supplemental material carries the same license as the article it is associated with.
For non-Open Access articles published, all supplemental material carries a non-exclusive license, and permission requests for re-use of supplemental material or any part of supplemental material shall be sent directly to the copyright owner as specified in the copyright notice associated with the article.
