
Abstract
Background:
Accurate diagnosis of cerebral ischemia severity is crucial for clinical decision making. Laser speckle contrast imaging-based cerebral blood flow imaging can help assess the severity of cerebral ischemia by monitoring changes in blood flow.
Method:
In this study, we simulated hyperacute ischemia in rats, isolating arterial and venous flow-related signals from cortical vasculature. Pearson correlation was used to examine the correlation between damaged vessels. Granger causality analysis was used to investigate causality correlation in ischemic vessels.
Results:
Resting state analysis revealed a negative Pearson correlation between regional arteries and veins. Following cerebral ischemia induction, a positive artery–vein correlation emerged, which vanished after blood flow reperfusion. Granger causality analysis demonstrating enhanced causality coefficients for middle artery–vein pairs during occlusion, with a stronger left-right arterial effect than that of right-left, which persisted after reperfusion.
Conclusions:
These processing approaches amplify the understanding of cerebral ischemic images, promising potential future diagnostic advancements.
Introduction
Acute cerebral ischemia can rapidly reduce cerebral blood flow (CBF) supply and restrict distal vascular activity (Bernhardt et al., 2017; Fan et al., 2022), leading to brain ischemia and neurological complications. The initial 4 h of acute cerebral ischemia, characterized by instability and a rapid progression (Bandla et al., 2018; Kawano et al., 2013), serve as a golden intervention phase for the clinical treatment of ischemic stroke (Del Zoppo et al., 2009). During this stage, various pathophysiological changes occur, such as the slowing down of arterial blood flow (Ma et al., 2017; Winship et al., 2014), the collapse of capillaries within the ischemic core (Pranevicius and Pranevicius, 2002), and even the potential reversal of venous flow direction (Fan et al., 2022). Accurate assessment of cerebral ischemia is crucial in making appropriate clinical decisions for hyperacute stroke patients (Mandeville et al., 2017), which can pave the way for better postoperative recovery.
The brain is supplied with oxygen through a complex network of arterial branches covering its entire volume. The main arteries responsible for this supply are the anterior cerebral artery (ACA), high-density medial cerebral artery (MCA), and posterior cerebral artery (PCA). Laser speckle contrast imaging (LSCI), a noncontacting optical imaging method, can monitor real-time blood flow changes in the ischemic cortex over a wide field of the cerebral surface (Richards et al., 2017). LSCI produces an intuitive CBF image that includes mixed vascular structures, including large-diameter veins (Li et al., 2009), fast blood flow arteries (Armitage et al., 2010; Li et al., 2009), and multibranch capillary structures (Li et al., 2009). These structures display distinct dilation–shrinkage rhythms (Liu et al., 2021) and optical characteristics (Iwase et al., 2015). In practice, LSCI has been used in neurosurgical monitoring (Huang et al., 2021; Miller et al., 2022; Niemann et al., 2021; Richards et al., 2014; Wang et al., 2012) and to assess ischemic stroke volume (Li et al., 2022; Li et al., 2013). Due to its cost-effectiveness nature and intuitive display of CBF, LSCI has the potential to facilitate rapid assessment of cerebral ischemia across both human and rodent models.
LSCI has been used in rodent models to assess spatiotemporal changes associated with cerebral ischemia. Following cerebral ischemia, specific cortical vascular features have been observed using LSCI, such as pronounced ischemic core and hypoperfusion areas (Biose et al., 2020; Li et al., 2013), notable declines in CBF within the ischemic regions of interest (ROIs) (Wang et al., 2012). It has also been able to identify narrowing vascular diameter (Sutherland et al., 2017), sluggish blood flow velocity (Ma et al., 2017), and deficient evoked cerebral hyperemia (Boas and Dunn, 2010, Sutherland et al., 2017). The hyperacute phase of cerebral ischemia, a crucial intervention window characterized by its inherent instability (Bandla et al., 2018), has been characterized by impaired arterial and vein blood flow (He et al., 2018; Sutherland et al., 2017). However, impaired interactions between distinct vascular signals of LSCI-based CBF during hyperacute ischemia are not known.
The goal of this work was to assess the arterial and venous feasibility using LSCI before, during, and after carotid artery (CA) occlusion. We developed a hyperacute cerebral ischemia rat model by blocking and unblocking the CA and subsequently obtained continuous resting CBF images. The temporal signals of arterial and venous ROIs were extracted from the cortical vascular structure and validated by their negative correlation. We then assessed impaired regional artery–vein correlation and homotopic left-right vessel connection using Pearson correlation and directed Granger causality analysis (GCA) correlation. To the best of our knowledge, we were the first to investigate impaired vascular association during induced hyperacute cerebral ischemia through this method.
Materials and Method
Ethic
The Ethics Committee of the University of Electronic Science and Technology of China conducted the experiment in strict accordance with the National Institutes of Health Guide for the Care and Use of Laboratory Animals.
Animal preparation
Male Sprague-Dawley rats, aged 6–8 months, were procured from Ensiweier Biotech Company (Chengdu, China). They were housed individually with ad libitum access to food and water and kept on a 12/12 light/dark cycle.
To perform thinning cranial surgery on rats, we administered 4.0% gaseous isoflurane induction anesthesia, which was subsequently reduced to 1.5% for the actual surgical procedure. The skull surface was delicately polished with a cranial drill to achieve transparency, thus allowing for the observation of the CBF signal through the exposed vessels. To ensure that the rat remained in a stable physiological state, body temperature, oxyhemoglobin saturation, and respiration were monitored throughout the procedure and maintained at 37.5 ± 0.5°C, 85–95%, and 70–110 beats/min, respectively with the help of an animal monitor (Paulette multi-parameter animal monitor M6vet, Shanghai, China). For CBF image collection, 6% chloral hydrate (400 mg/kg) was intraperitoneally injected to maintain proper anesthesia and sedation depth.
Ischemia-reperfusion progress
Figure 1A exhibited intact progress of induced cerebral ischemia. To simulate hyperacute cerebral ischemia progress caused by CA occlusion, we conducted CA block surgery on healthy rats. The surgery included shaving, blunt separation, CA occlusion, and reperfusion. We initially removed the hair on the left thoracic cavity and then disinfected the area with alcohol. The skin was cut, and the muscle was gently removed to expose the common CA. The vagus nerve was carefully separated to prevent any damage. We then clamped the common, external, and internal carotid arteries using arterial hemostatic clips for 30 min of occlusion progress (as shown in Fig. 1B). Afterward, the clamps were removed, and the CA was reperfused for the following 30 min. Finally, the brain was removed from the skull and strained with 2,3,5-triphenyltetrazolium chloride to determine infarct severity.
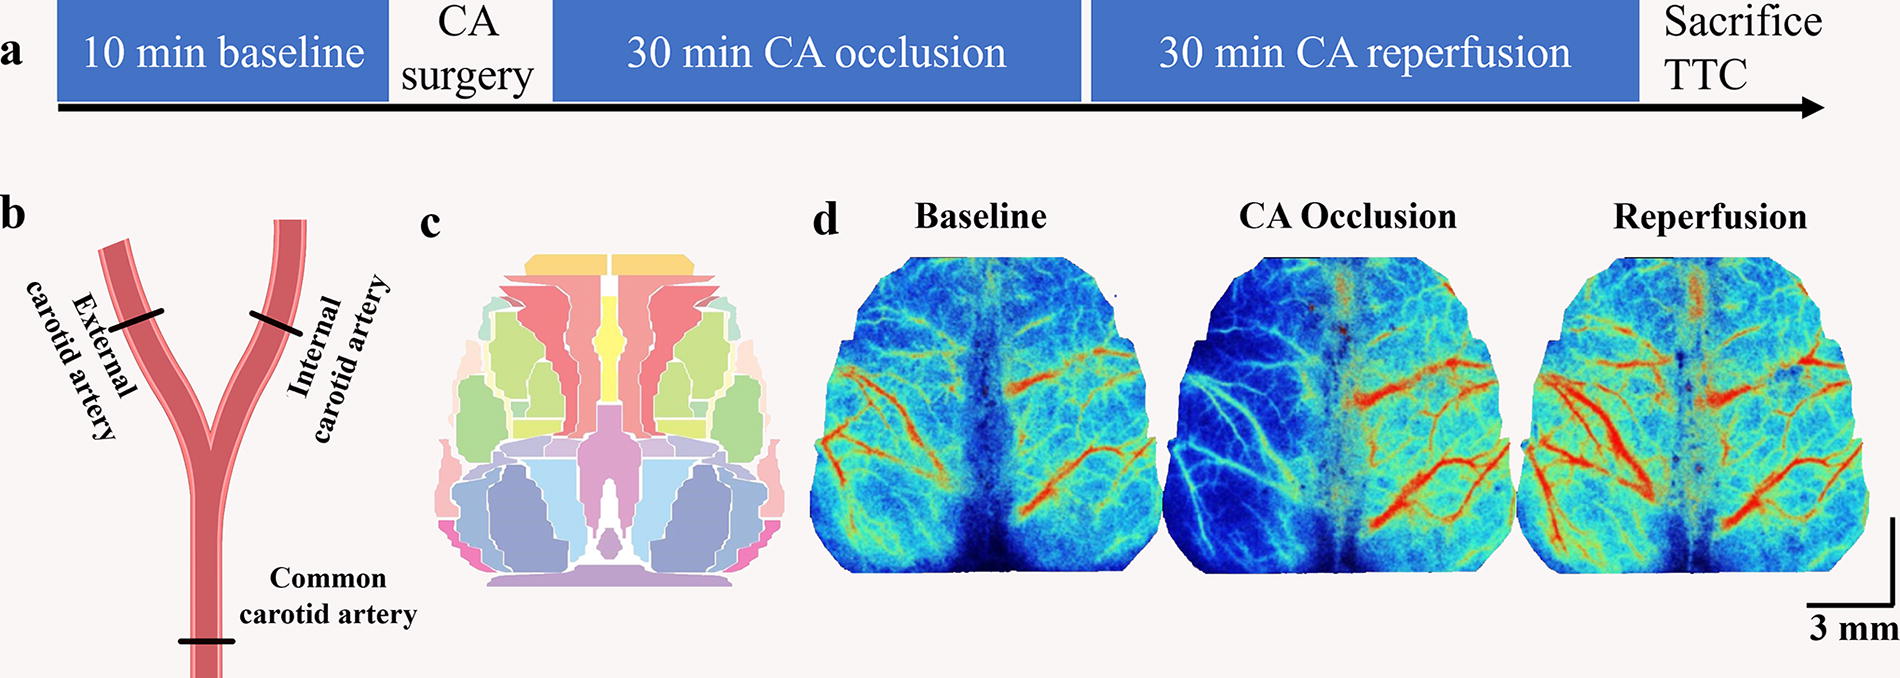
Experiment diagram and CBF data analysis.
Laser speckle contrast imaging system
The study used a laser speckle contrast imaging system (SIM BFI HR Pro, SIM Opto-Technology Co., Ltd, Wuhan, China) to acquire CBF images. The system had a field of view size of 21 mm × 29 mm, work distance of 20 cm, exposure time of 10 ms, image pixel density of 494 × 656 pixels, and sampling rate of 10 Hz. This resulted in a pixel-wise spatial resolution of 42.5 × 44.2 μm2. We fixed the rat’s head in a stereotaxic apparatus to avoid head movement during the data collection phase. To ensure high-quality image collection, the surface of the exposed skull was coated with silicone oil to keep it moist and prevent light spots due to an uneven surface. Resting states consisted of a 10-min baseline, 30-min CA occlusion ischemia, and 30-min blood flow reperfusion.
CBF image preprocessing and vascular ROIs signal extraction
LSCI image preprocessing
The data were analyzed using customized MATLAB scripts. To standardize the CBF images, we created a normalized rat brain surface template based on a previously published histological atlas (Paxinos et al., 2004; White et al., 2011) shown in Figure 1C. We created a brain mask to exclude background scatter and then used an affine transformation to register the image with the cranial bregma, lambda, and edge positions to the normalized horizontal space. Given the influence of machine noise on the acquired signals, raw CBF images were smoothed using a 5 × 5 pixels Gaussian kernel with a standard deviation of 1.3 pixels. Lastly, all CBF images from each rat were processed in an identical pipeline involving denoizing, detrending, and normalization.
Vascular ROIs signal extraction
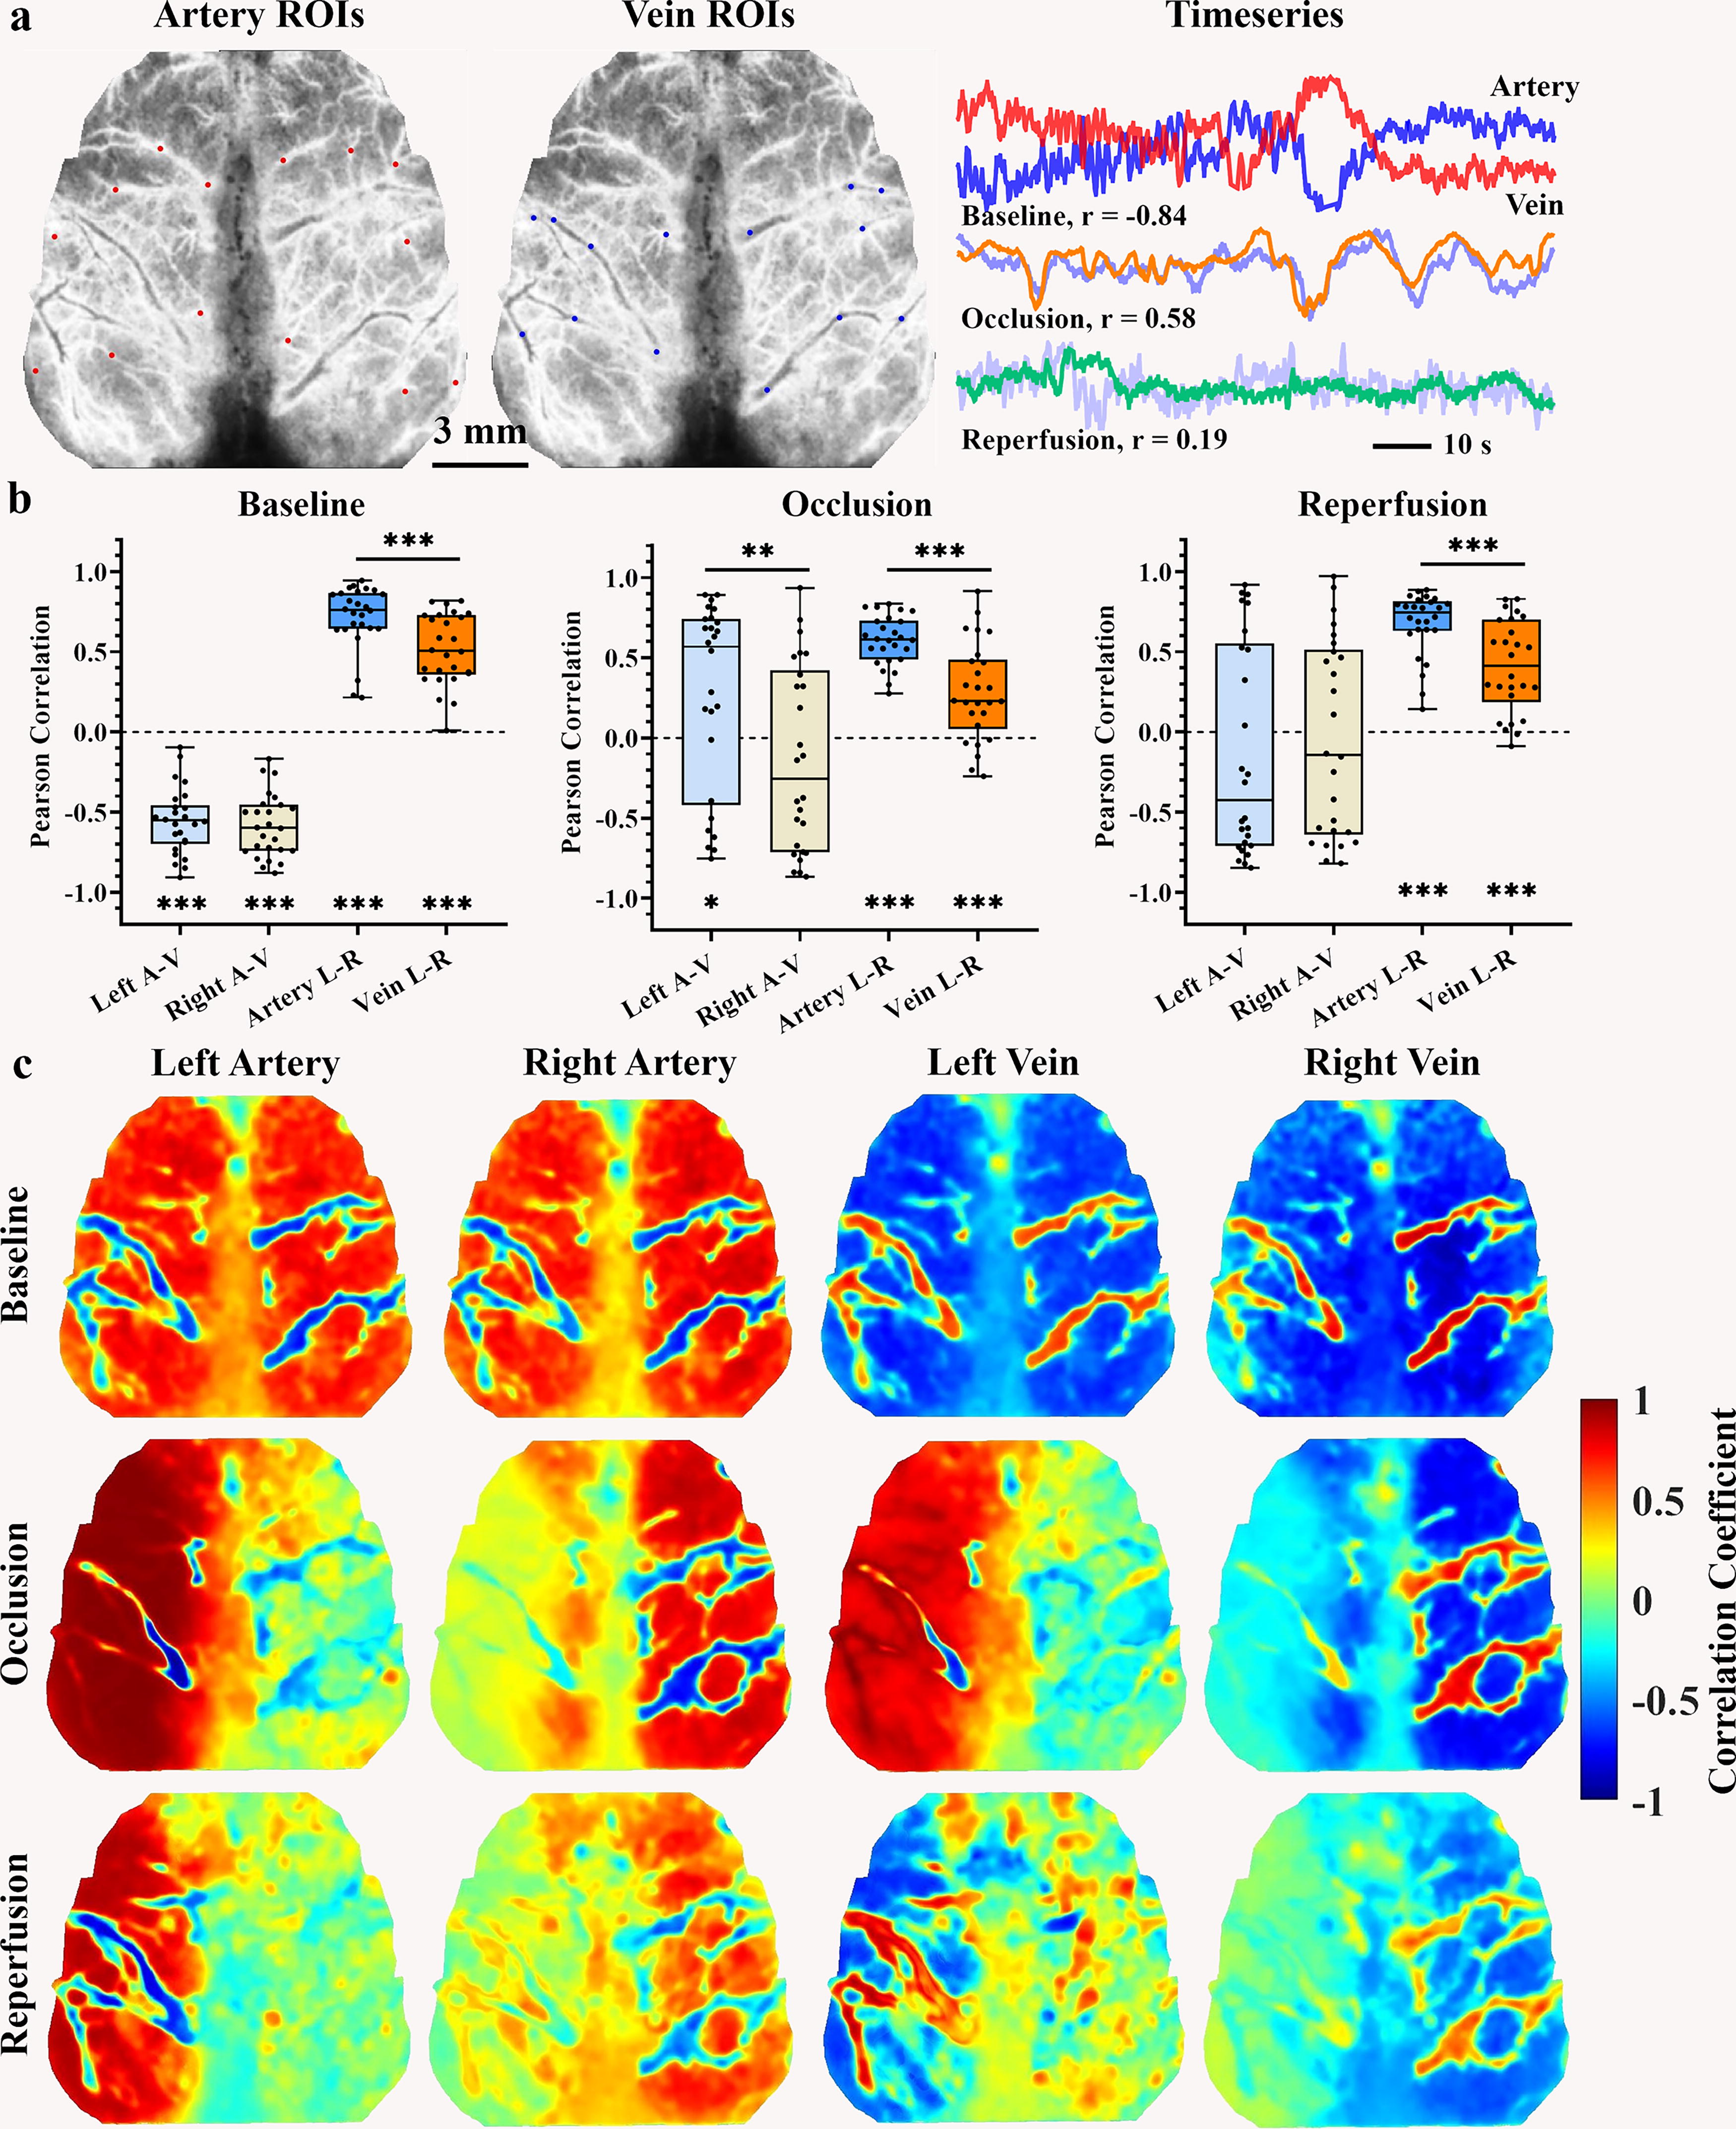
We chose a number of ROIs from arteries and veins by considering their distinct signal characteristics including large vein diameter (Armitage et al., 2010), slender multibranch artery structure, and opposite dilation-shrinkage fluctuation of arterial and venous vessels (Liu et al., 2021). A total of 28 ROIs, each with a diameter circle of 0.24 mm (28 pixels), was selected from the cortical vascular structure (shown in Fig. 2A). The selection of these ROIs was guided by Winship’s definition (Winship et al., 2014) of high-density arterial areas and the rodent cerebral vascular atlas (Xiong et al., 2017), which delineated seven arterial and seven venous ROIs for each hemisphere. Furthermore, to specifically select ipsilateral arterial or venous ROIs, we selected three middle ROIs from the MCA-ACA cross sensorimotor area, which exhibited a high density of arterial vessels and were located within the forelimb, hindlimb, and barrel cortices. In adddition, two central ROIs were chosen from the ACA and PCA regions, which encompassed the M2 and V2M subregions, and another two border ROIs were selected from the MCA border area, which exhibited a low density of arterial vessels and encompassed the V2L, V1, and auditory cortices. Lastly, we performed an average of the signals from the multiple ROIs situated within bilateral central, middle, and border areas, resulting in the creation of six arterial and six venous regional signals.
Pearson correlation between averaged hemispheric artery and vein ROIs.
Pearson correlation and Granger causality analysis for vascular signals
Arteries facilitate the delivery of blood and its oxygen and energy content to the brain tissue, thereby supporting its metabolic requirements. The metabolic waste products are subsequently recycled into venous vessels to establish physiological circulation. Here, we used both undirected and directed correlation methods to investigate the relationships among different vascular signals. Initially, the undirected Pearson correlation and directed GCA correlation (Barnett and Seth, 2014) were used on the averaged temporal signal of hemispheric arterial and venous ROIs to illustrate the vascular connections with the temporal signal in the entire cortex pixels. Subsequently, a total of 28 ROIs and 12 area temporal signals were subjected to two types of correlation, resulting in the construction of undirected correlation and directed causality matrices. Finally, we examined correlation stability across various blood flow signals using a range of window lengths, ranging from 2 to 120 sec. Regional artery–vein and left-right homoplastic vascular correlations were also quantified in different regions.
Statistics
Statistical analysis was performed using MATLAB and GraphPad Prism 8, with significance levels set at *p < 0.05, **p < 0.01, ***p < 0.001. The assessment of normal distribution was conducted through the Kolmogorov–Smirnov test and subsequent quantile–quantile plots. One-way analysis of variance was used to compare parameters (e.g., hyperemia activation, artery–vein Pearson correlation, and state-space parameters) across multiple groups. Paired state comparisons were analyzed with paired t-tests for Pearson correlation and hyperemia percentage. The examination of causality correlation ensued using the Wilcoxon matched-pairs signed rank test due to the non-Gaussion distribution. The left-right difference was examined with a single-sample t-test comparison with zero. False discovery rates were applied to reduce false-positive results.
Results
Instant occlusion and reperfusion progress
Figure 3 displays the initial 80-sec progress of instant CA block and unblock operation, the left CBF signal rapidly dropped to the lowest intensity, recovering within 20 sec to a relatively stable state. Notably, the left hemisphere showed a transient rise in blood flow within 6–8 sec post CA occlusion. In contrast, the right CBF gradually diminished over time. Comparable perfusion images are displayed in Figure 3B for the initial reperfusion progression, revealing that unblocking CA led to augmentation in perfusion signals in both hemispheres, particularly in the left cortex.
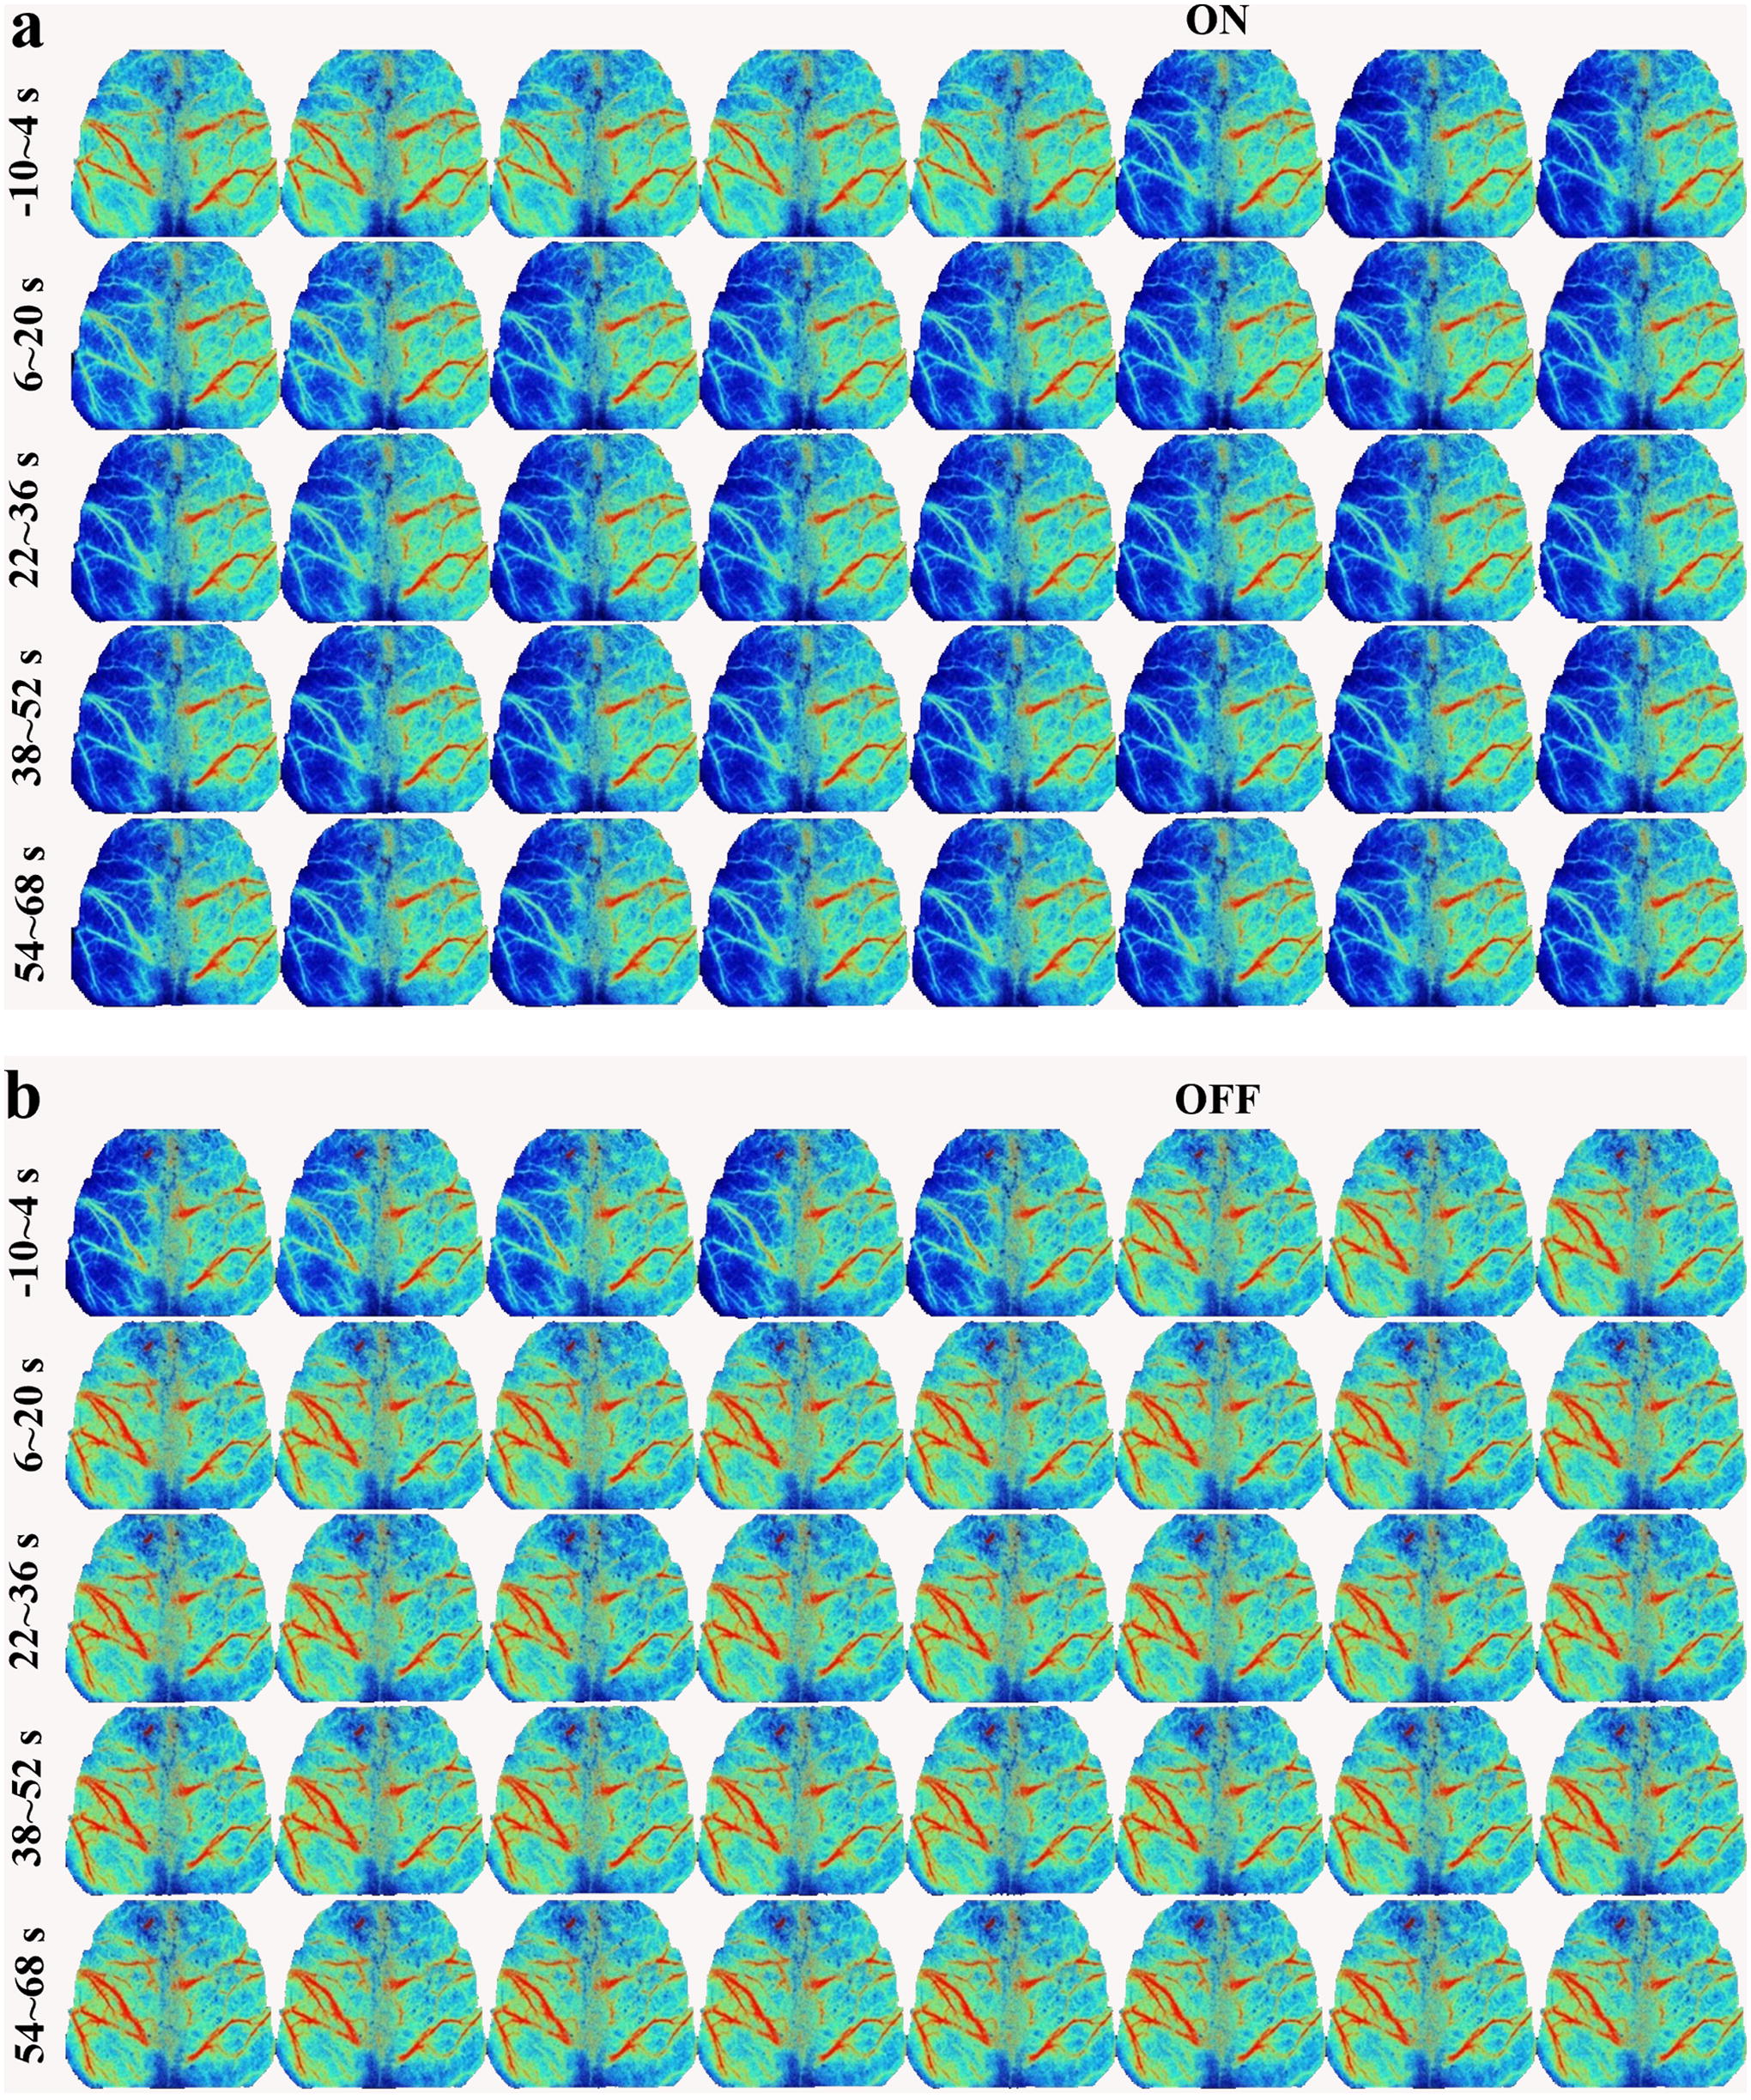
Instant occlusion and reperfusion effect.
Impaired vascular Pearson correlation after cerebral ischemia
The cerebral vascular system facilitates the circulation of blood from arterial to venous vessels, but this process can be disrupted during cerebral ischemia. In Figure 2B, the demo blood flow time series of the inverse artery–vein fluctuation was presented under the resting state. The physiological artery–vein demonstrated a negative correlation intensity across all cortical regions. The middle area exhibited a stronger negative correlation compared with the center area (left middle −0.46 ± 0.045 vs. left center −0.29 ± 0.042, p < 0.001, right middle −0.47 ± 0.043 vs. right center −0.33 ± 0.042, p = 0.0016), coupled with faster coefficient change with extended window lengths. Conversely, the left-right homotopic vessels showed similar fluctuations (Fig. 2B) and positive connections (Fig. 2C, D), with arterial connections being stronger than venous connections. Similarly, the homotopic middle regions demonstrated a stronger arterial connection than the center regions (homotopic middle artery, 0.61 ± 0.043; homotopic center artery, 0.51 ± 0.047; p < 0.001), accompanied by a faster change with extended window lengths (Fig. 4B). Furthermore, Figures 2D, 4A, and Supplementary Figure S1 demonstrated that the arterial signal is negatively correlated with venous pixels and ROIs signal. Conversely, the homologous vascular signals exhibited a positive connection with each other, with the arterial connection exhibiting a greater intensity when compared with the vein.

Pearson correlation of vascular signal in distinct areas.
Following the CA blockage, the artery–vein correlation and left-right homotopic vessel connection became disrupted. During the occlusion, the ischemic artery–vein time series showed similar fluctuations with a positive correlation intensity (Fig. 2B). The Pearson correlation map and correlation matrices of the venous signal showed a diminished negative correlation with the arterial signal (Figs. 4A, Supplementary Figure S1). The strength of the regional artery–vein correlation was weaker during the two ischemic states than the resting state (Fig. 4C and Supplementary Table S1), and even the left border area indicated a positive correlation under occlusion (occlusive left border, 0.29 ± 0.12; p = 0.024). Hemispheric differences were observed in the border and middle areas during occlusion (Fig. 4C, D), but these discrepancies disappeared following CA reperfusion. Furthermore, the connection between homotopic vessels in the middle area became weaker than baseline during occlusion (Fig. 4E).
Damaged vascular causality correlation by cerebral ischemia
Under physiological conditions, oxygenated blood flows are pumped to cerebral tissue through arterial vessels, and deoxygenated blood is recycled into the heart via venous vessels. The GCA results indicated that, under the baseline condition, the causality coefficient of the artery–vein correlation was greater than that of the vein–artery signal (Figs. 5A, 6A, Supplementary Fig. S2), and the causality coefficient of bilateral homotopic arteries performed stronger compared with homotopic veins signal. Moreover, the cerebral cortex exhibited a balanced causality correlation of artery–vein and vein–artery at each side hemisphere, with similar causality connections between left-right and right-left arterial or venous signals. Across different areas, the middle and border areas exhibited greater causality coefficients of artery–vein in comparison with the central area (Fig. 6C). Sliding window analysis showed instability in short window lengths (<30 sec), with increased stability coefficient in extended window lengths (Figs. 6B, Supplementary Fig. S3C).

Granger causality correlation between averaged hemispheric artery and vein ROIs. Causality analysis shows that, under physiological conditions, artery-to-vein causality is stronger than vein-to-artery, with a higher coefficient for artery-to-artery homotopy than vein-to-vein. The GCA correlation maps indicate that the artery-to-whole brain signal has a stronger causality coefficient than the vein-to-whole brain signal, with a lower causality coefficient of the whole brain signal to hemispheric vessels. During both ischemic states, the left and right artery predominantly exert their influence on the right hemisphere. In contrast, the bilateral hemispheric veins primarily receive effects from the left arterial area, particularly the right veins. Moreover, the causality correlation of the left-right artery is stronger compared with that of the right-left under occlusion, and it does not recover with reperfusion in
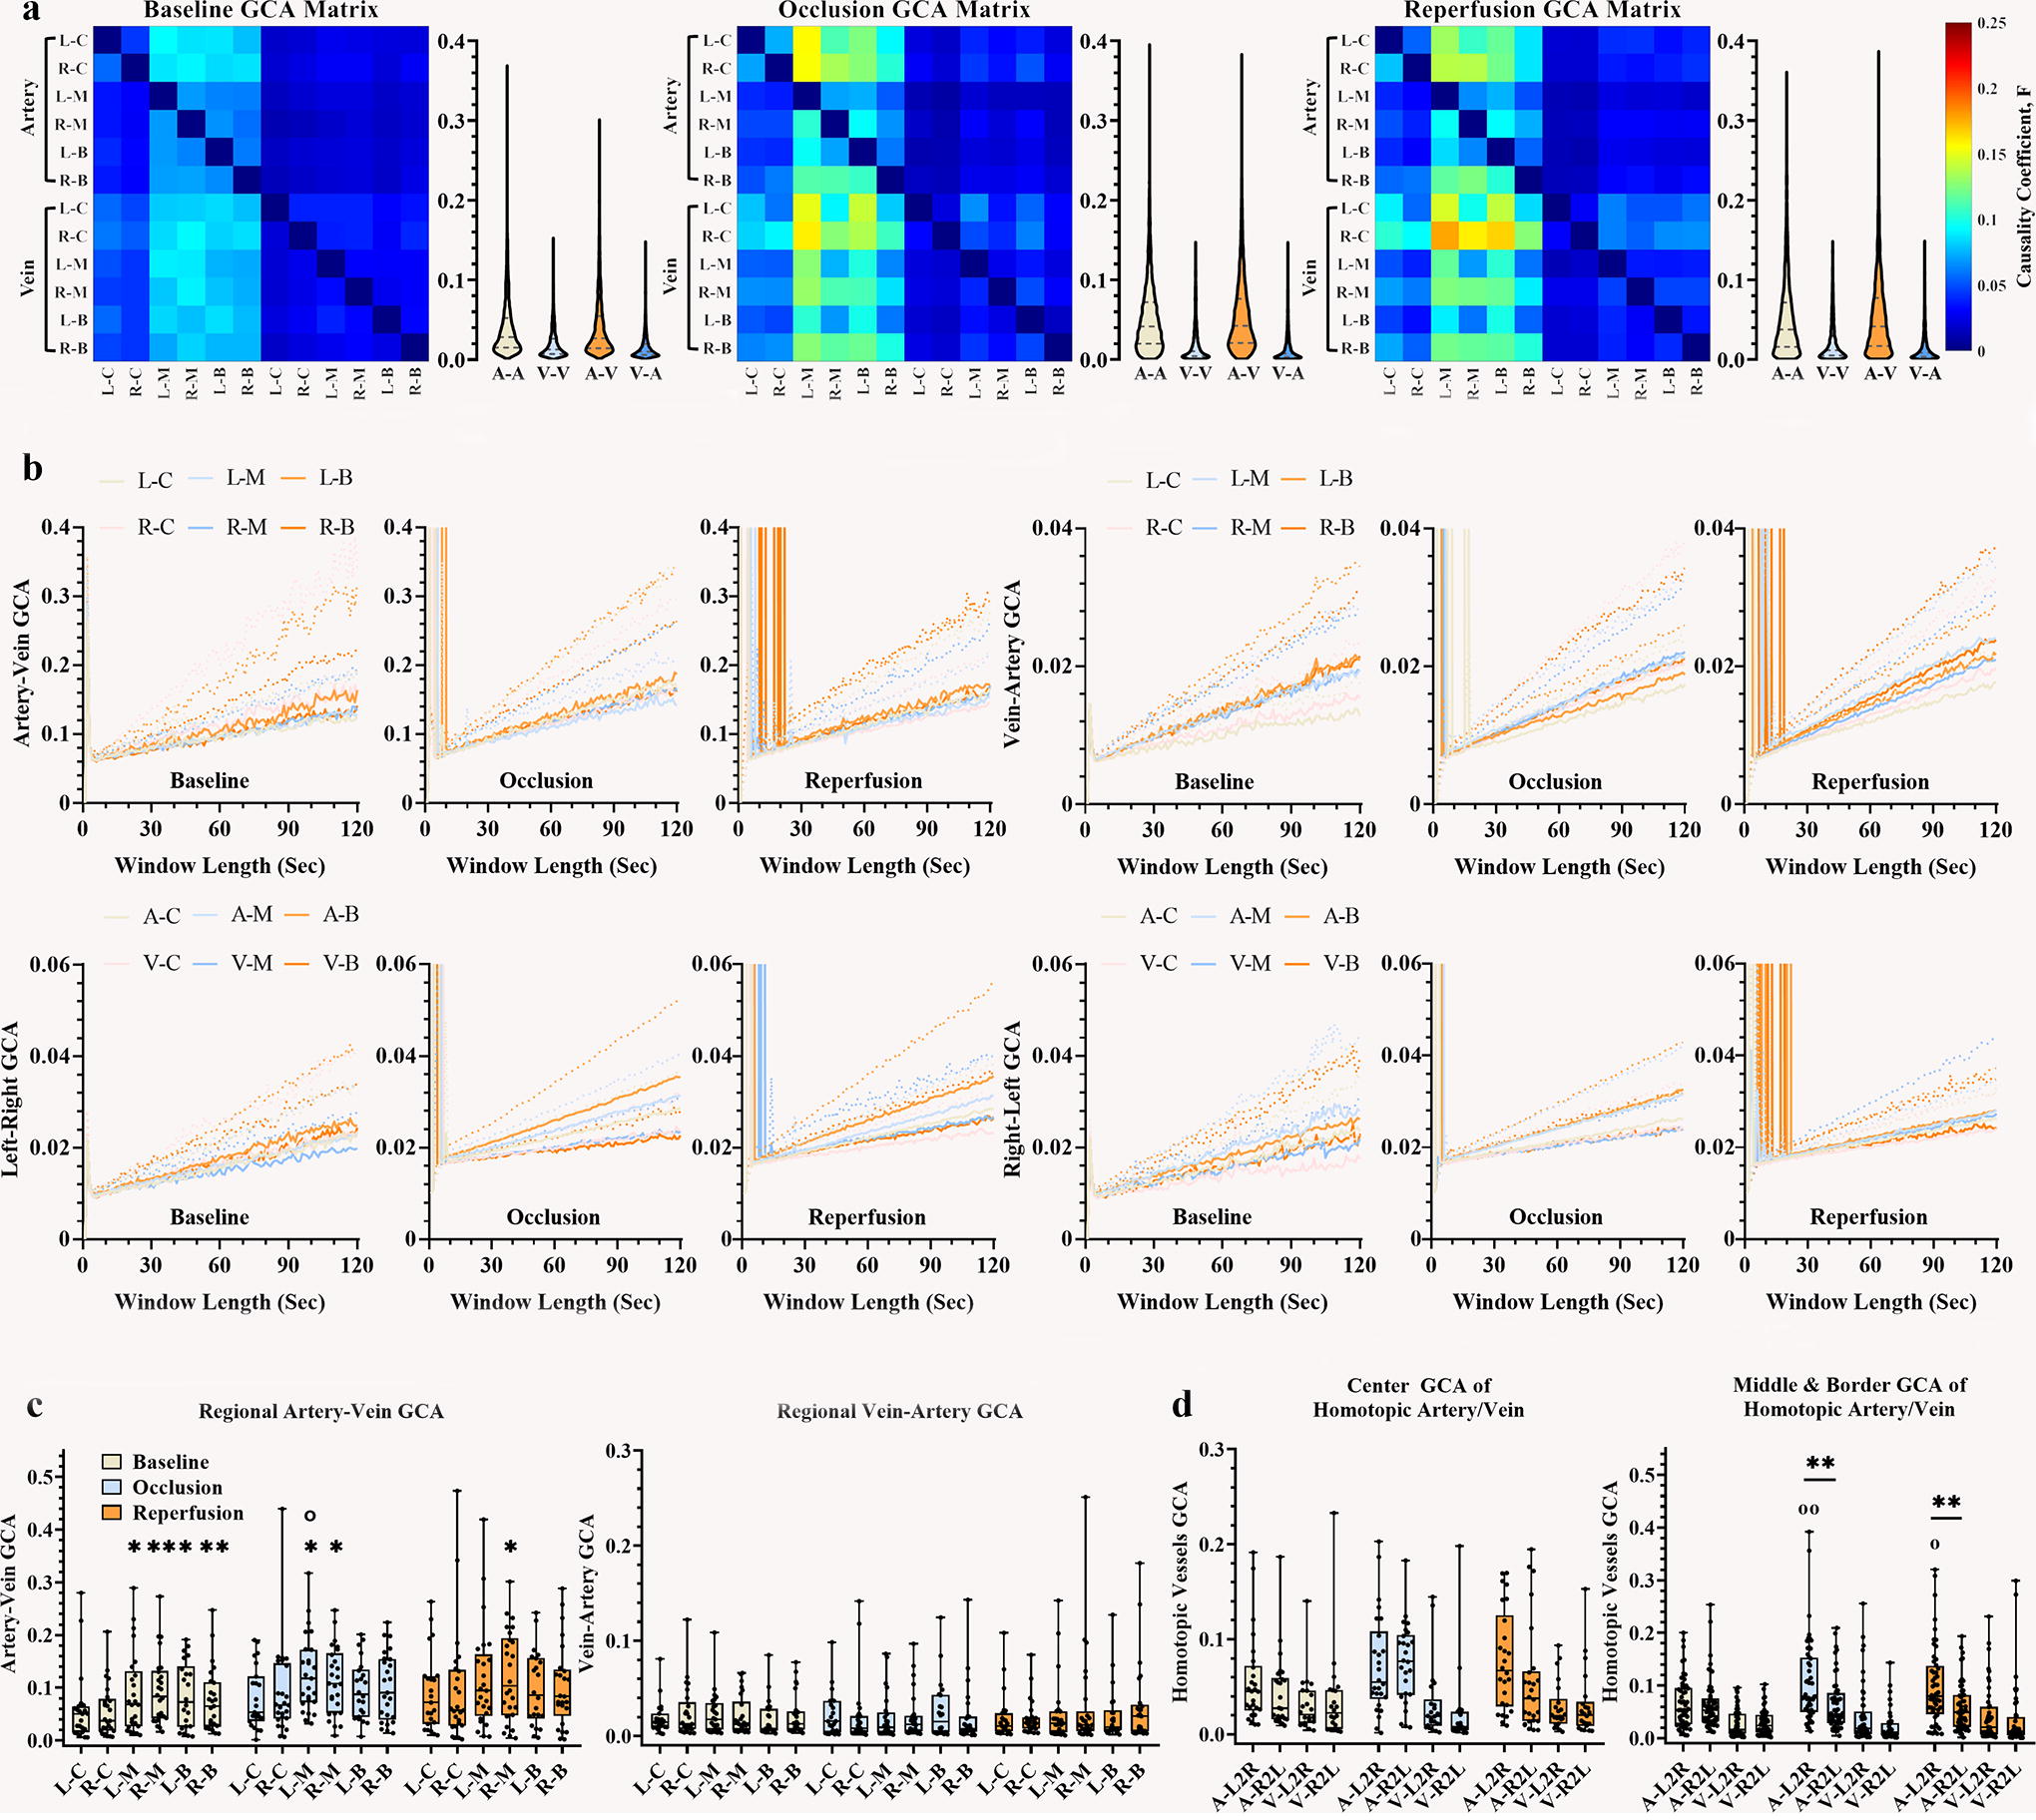
Causality correlation of vascular signal in distinct areas.
However, cerebral ischemia disrupted the baseline vascular causality relationships. Figure 5B demonstrated a causal connection between the averaged ipsilateral vascular signal and the whole brain pixel matrix. Under both occlusion and reperfusion states, the left artery exerted a potent influence on the right hemisphere, whereas the left veins exhibited a robust response to the ipsilateral arterial area. In the right hemisphere, the arterial influence was primarily directed toward the right arterial area, with both the artery and vein also experiencing a substantial influence from the left arterial territory. Statistically, the occlusive artery–vein causality correlation in the left middle territory was significantly stronger than its baseline intensity (median [25%, 75%], occlusion left middle 0.12 [0.072, 0.17] vs. baseline left middle 0.072 [0.026, 0.14], p = 0.041). With regard to the homotopic vessel connection, the central area exhibited no difference in left-right causality and right-left causality under the two ischemic states, whereas discrepancies between left-right effect and right-left effect were evident in the middle and border areas for occlusive and re-perfused arteries (Fig. 6D), with a bidirectional arterial difference observed under occlusion (Supplementary Table S2).
Discussion
In this investigation, we used Pearson correlation and directed Granger causality correlation to grade cerebral ischemia lesions during continuous CBF recording in the context of ischemic occlusion and reperfusion. Using arterial and venous ROIs, we identified their distinct signal patterns that enabled further analysis. Pearson correlation analysis showed attenuated artery–vein correlation and left-right homotopic vessel connection. Granger causality correlation exhibited an enhanced artery–vein correlation and stronger left-right artery effect.
Blood flow circulation, driven by artery blood and recyclable vein blood, is crucial for ensuring basic brain metabolism. Chloral hydrate is a widely used and effective agent for inducing sedation and anesthesia in animal experiments. When administered intraperitoneally, chloral hydrate suppresses cerebral cortex excitability within 3–5 min, maintaining appropriate anesthesia and sedation depth for 2–3 h (Hu et al., 2020). This action is mediated by the enhancement of GABA-A receptor activity, leading to chloride ion influx into neurons and subsequent inhibition of ascending neural network excitatory conduction (Slupe and Kirsch, 2018). Consequently, chloral hydrate reduces signal transmission from both peripheral and central nervous systems, inducing anesthesia. However, physiological studies have shown that anesthesia can adversely affect cardiac muscle function, heart rate, and cardiac output (Silverman and Muir, 1993; Wieling et al., 2016). Low doses may decelerate heart rate and reduce myocardial contractility, while high doses may cause severe cardiac complications, such as hypotension, bradycardia, and cardiac arrhythmias (Silverman and Muir, 1993). In addition, chloral hydrate can cause respiratory depression and alterations in blood gases, including decreased PaO2 and elevated PaCO2 levels (Murakami et al., 1998). Overall, chloral hydrate-induced anesthesia may result in slowed heartbeat, arterial hypotension, and neural hypoxia. However, the direct effect of chloral hydrate on CBF remains unclear due to the nonlinear relationship between CBF and blood pressure (Froese et al., 2021), necessitating further investigation.
At baseline, the arterial flow signal displayed an antiphase fluctuation as compared with the venous signal (Fig. 2B). The resting state analysis showed, for Pearson correlation, negative coefficients between regional artery–vein correlations across all regions (Figs. 2C, 4C) and positive coefficients between left-right homotopic vessels, with a stronger coefficient observed for arteries compared with veins. The correlation matrices revealed a consistent negative Pearson correlation between arterial and venous activity, as well as a positive association between homologous vascular activity and greater arterial connection intensity than venous connection (Figs. 4A, Supplementary Fig. S1). Sliding-window and down-sample analysis revealed that the negative artery–vein correlation stabilizes progressively with an extended window duration up to 10 sec (Figs. 4B, Supplementary Fig. S3A, S3B). With respect to the Granger causality correlation, the arterial-venous correlation exhibited a larger causality coefficient compared with the vein–artery correlation (Figs. 5A, 6A), with a more pronounced homotopic arterial connection than that of the vein. Its causality matrices further demonstrated that the artery exerted a stronger influence on the vein compared with the vein’s effect on the artery, as well as a more active arterial-arterial connection compared with the vein–vein connection (Figs. 6A, Supplementary Fig. S2). These results may suggest that arterial blood flow on the cerebral cortex has an opposite direction relative to venous blood flow. Arterial blood flows away from the heart, while venous blood flows toward the heart. The antiphase wave of arterial-venous blood flow is possibly due to a temporal delay in its flow, influenced by slow myogenic and neurogenic vascular fluctuations (Jan et al., 2012), autoregulated by blood gas concentrations of PaO2 and PaCO2 (Murakami et al., 1998), rather than by rapid respiratory and cardiac activity.
Interestingly, the middle sensorimotor region displayed a stronger artery–vein coefficient of Pearson correlation and Granger causality correlation compared with the central region. The homotopic Pearson connection results also revealed that the middle area exhibited a stronger vascular connection than the central area, which was consistent with Bauer’s (Bauer et al., 2014) finding using optical intrinsic signal imaging in mice. Research indicates that rodent sensorimotor cortices receive blood supply from both MAC and ACA vasculatures (Winship et al., 2014), featuring robust collateral circulation (Ma et al., 2017), high capillary density, large fractional vascular volume, and extensive vascular length (Xiong et al., 2017), thereby supporting robust vascular plasticity and neurovascular coupling capacity in the sensorimotor region (Kurniawan et al., 2014). Our findings of robust artery–vein connections in the sensorimotor cortex provide novel evidence for the high neuronal and vascular plasticity in this region, which is a high metabolic intensity within the rat default model network (Lu et al., 2012), an active network during the rest state.
In occlusion, cerebral ischemia emerges, leading to reduced arterial flow and weakened autoregulation of blood flow circulation. Pearson correlation analysis indicated that the left border region exhibited a positive artery–vein coefficient (Fig. 4C), while the left middle region had no significant positive value. This could be attributed to the less distal vessel branches and weaker collateral circulation in the border area (Xiong et al., 2017), increasing its susceptibility to ischemia. Compared with the baseline, the middle region exhibited a weaker artery–vein Pearson correlation (Fig. 4C) and heightened Granger causality coefficient (Fig. 6C). The left-to-right causality effect of the middle and border areas was greater than the right-to-left effect (Figs. 6D). This may account for that cerebral ischemia induced both intravascular hypertension and arterial blood flow reduction (Murakami et al., 1998), coupled with worsened blood oxygenation, narrowed arterial vessel diameter (Bernhardt et al., 2017; Ma et al., 2017), primarily affecting the left occlusive arteries. In the central region, there was no obvious change in the artery–vein correlations of Pearson and causality relative to baseline, with a negligible distinction observed between left-right and right-left arterial connections. The correlation between the homotopic central region remained unchanged than baseline, consistent with previous research (Bauer et al., 2014). This may be attributed to the additional blood supply received by the central region from the ACP, PCA, and basilar arteries (Xiong et al., 2017).
With reperfusion of blood flow, the border and middle areas partially recovered from severe cerebral ischemia. The left border and middle areas performed partial recovery from positive Pearson coefficients (Fig. 4C), with disappeared left-right differences (Fig. 4D), but they were still worse than the baseline. The causality discrepancy between the left-right and right-left homotopic arterial persisted (Fig. 6D). These altered vascular correlations indicated that blood flow circulation partially recovered from the restoration of blood flow but had a distance from the physiological state.
The investigation currently has some limitations. The extraction of the CBF signal through the selection of arterial and venous ROIs was prone to subjective experience, which may not account for all vascular components. Moreover, the manual selection of ROIs limits the applicability of this analysis to large datasets. To address these limitations, we recommend the use of algorithms, such as deep learning, to automatically identify and segment various vascular elements in the future. In addition, our study solely examined CBF activity during the hyperacute stage of cerebral ischemia, and longer observation of CBF activity, along with behavioral tests during the acute and subacute phases, could provide a more comprehensive understanding of progressive ischemia. Moreover, the disrupted artery–vein blood flow circulation under two ischemic conditions was evaluated based on mathematical calculations, which requires further experimental evidence, such as two-photon microscopy, to support our hypothesis.
Conclusion
Our research has uncovered previously unexplored aspects of cerebral ischemia and shed light on the impaired vascular interactive correlation within the hyperacute ischemic stage. Careful selection and categorization of ROIs for arteries and veins enabled a comprehensive analysis of vascular signals. Pearson correlation analysis showed a significant negative association between regional artery–vein activity under physiological conditions, with the middle sensorimotor area exhibiting a stronger intensity than the central area. After cerebral ischemia, the activity of the regional artery–vein correlation in the ischemic hemisphere became less negative and, in some cases, even positive. Of note, cerebral ischemia states showed hemispheric differences in artery–vein Pearson correlation. In addition, causal correlation analysis demonstrated a stronger left-right effect compared with a right-left effect under two ischemic states.
By carefully selecting different vascular ROIs from CBF images and conducting both unidirectional and directional correlations, we can deepen our understanding of cerebral ischemia. This approach not only improves the depth of CBF image processing but also accelerates our understanding of cerebral ischemia for future research.
Authors’ Contributions
B.N.: Conceptualization, data collection and curation, methodology, software, and writing—original draft. S.G.: Writing—review. H.G.: Conceptualization and methodology. P.H.u: Software. P.S.: Writing—editing. X.L.: Writing—Review. Y.X.: Writing—editing. D.Y.: Writing—editing. B.K.-B.: Writing—review. B.B.: Writing—review and editing, supervision, and funding acquisition.
Data Availability Statement
Reasonable requests regarding data and the MATLAB scripts used in this study will be made available from the corresponding author on reasonable request.
Declaration of Competing Interest
The authors declared no potential conflicts of interest with respect to the research, authorship, and/or publication of this article.
Declaration of Generative AI and AI-Assisted Technologies in the Writing Process
During the preparation of this work, the author does not use AI and AI-assisted techniques in the writing progress.
Author Disclosure Statement
No competing financial interests exist.
Footnotes
Funding Information
The authors disclosed receipt of the following financial support for the research, authorship, and/or publication of this article. This work was supported by the National Natural Science Foundation of China (NSFC82250410380, NSFC62171101), Natural Science Foundation of Sichuan Province (24NSFSC6257), and the China MOST2030 Brain Project (2022ZD0208500). The funding sources were not involved in study design, monitoring, data collection, statistical analyses, interpretation of results, or article writing.
Supplementary Material
Supplementary Table S1
Supplementary Table S2
Supplementary Figure S1
Supplementary Figure S2
Supplementary Figure S3
Supplementary Figure S4
References
Supplementary Material
Please find the following supplemental material available below.
For Open Access articles published under a Creative Commons License, all supplemental material carries the same license as the article it is associated with.
For non-Open Access articles published, all supplemental material carries a non-exclusive license, and permission requests for re-use of supplemental material or any part of supplemental material shall be sent directly to the copyright owner as specified in the copyright notice associated with the article.