
Abstract
Background:
Individuals with spider phobic (SP) fear show hypervigilance and amygdala hyperactivity toward fear-associated stimuli, which may promote the development of other anxiety disorders. The amygdala is a key region within the fear network, which is connected to the anxiety system, where the bed nucleus of the stria terminalis (BNST) plays a crucial role. However, the BNST’s involvement in phobic fear is unknown. Therefore, this study investigated the association of phobic fear and anxiety on these regions’ functional connectivity (FC) in SP compared to healthy controls (HC).
Methods:
7T-functional MRI resting-state FC of 30 individuals with SP and 45 HC was assessed to detect network differences between these groups. The association of phobic fear severity, trait anxiety, and social anxiety on FC was explored using linear regressions combined with seed-to-voxel analyses with amygdala and BNST as primary seeds, corrected for age and sex.
Results:
In SP, phobic fear was associated with reduced FC between the left amygdala and the right supramarginal gyrus. In contrast, anxiety severity was related to increased FC between the right BNST and the left inferior frontal gyrus. Moreover, social anxiety was related to decreased FC between bilateral BNST and left precuneus.
Conclusions:
These findings show changes in FC in SP, connecting fear with altered activity in the BNST and amygdala. The results suggest that persistent anxiety in phobic fear is associated with abnormal brain function in these regions, potentially explaining susceptibility to anxiety disorders and processes involved in phobic fear, such as threat perception, avoidance, and salience.
Impact statement
This is the first study to report altered FC mechanisms of BNST and amygdala in individuals with SP using 7T ultra-high field resting-state data. So far, only distinct characterization of brain regions, especially of BNST and amygdala, involved in those disorders exists. Our results contribute to closing this knowledge gap by providing the first evidence that deviant BNST and amygdala function in SP might elucidate the susceptibility to other anxiety disorders.
Introduction
Phobic fear affects ∼7.2% of the global population, making them the most prevalent form of mental disorders (Eaton et al., 2018; Zsido et al., 2023). The development of specific phobias can be attributed to genetic predisposition as well as environmental and psychological factors, including traumatic experiences and learned behavior (Kendler et al., 2001; Trumpf et al., 2010; Zsido et al., 2023). Phobic fear is predominantly triggered by a specific object or situation and maladaptive to the actual danger posed by the specific object or situation (Diagnostic and Statistical Manual of Mental Disorders, DSM-V; American Psychiatric Association, 2013). Fear is known as a primarily adaptive, rapidly emerging response to an imminent threat that rapidly declines when the threat has disappeared. Fear serves as an essential mechanism for survival, allowing organisms to react swiftly to danger and thereby increasing their chances of avoiding harm.
The physiological and psychological changes that accompany fear, such as increased heart rate, sweating, and heightened senses prepare the body to either confront or flee from the threat. This response, known as the “fight-or-flight response,” is crucial for immediate survival (Fink, 2016, Dhabhar, 2018).
In contrast, sustained anxiety describes the persistent feeling of an unspecific and unpredictable threat (Grillon and Baas, 2003; Krueger, 1999; Schmitz and Grillon, 2012). Unlike fear, which is triggered by a clear and immediate danger, sustained anxiety is characterized by a continuous state of unease and apprehension without a specific or immediate cause (Avery et al., 2016). This type of anxiety can be debilitating, as it keeps the body and mind in a constant state of alert, leading to chronic stress and related health issues. Sustained anxiety is a significant symptom of various mental health conditions, including generalized anxiety disorder, panic disorder, and depression (Schmitz and Grillon, 2012).
The neurobiology of fear and anxiety
Fear and anxiety underlie a complex interplay of brain structures that generate adaptive fear responses, or when altered, can be linked to anxiety disorders. One key structure for multiple anxiety and fear processes is the amygdala, which serves as a hub for the neural mechanisms of emotions and affectivity (Buckner et al., 2008), social cognition (Cha et al., 2016), fear conditioning (Davis et al., 2010), and complex decision making in ambiguous and uncertain situations (Sladky et al., 2018). The bed nucleus of the stria terminalis (BNST) is a brain region at the size of a sunflower seed located in the basomedial forebrain and is structurally and functionally connected to the amygdala (Avery et al., 2014; Gorka et al., 2018; Oler et al., 2012). This amygdala–BNST connection is conserved across several species (Oler et al., 2012). Seminal rodent studies have shown that lesions in the BNST reduce sustained anxiety behaviors in response to diffuse or unpredictable cues and contexts, which is similar to human anxiety (Breitfeld et al., 2015; Theiss et al., 2017). Through this connection, the BNST mediates anxiety and fear responses of the amygdala (Alvarez et al., 2011; Avery et al., 2016; Davis et al., 2010; Lebow and Chen, 2016) such as hypervigilance and arousal (Davis et al., 2010) and increased environmental sensitization (Davis and Walker, 2014). Besides the connection with the amygdala, the BNST is also structurally and functionally linked with subcortical regions, including limbic, thalamic, and basal ganglia structures, the temporal pole, and the paracingulate gyrus (Avery et al., 2014). Due to the BNST’s small size and the vicinity to other subcortical grey matter nuclei, its MRI signal is difficult to delineate, especially on lower-field strength MR images. Additionally, the BNST is susceptible to signal artifacts due to its proximity to fluid-filled lateral ventricles and blood vessels. Recent advances in MRI technology such as the increasing signal-to-noise ratio with higher magnetic field strengths make it now possible to investigate circuits of smaller brain regions such as the BNST (Yen et al., 2023). Previous studies have shown structural and functional connections at rest between BNST and amygdala at 3 and 7T (Kruger et al., 2015; Oler et al., 2012; Pedersen et al., 2017b). Moreover, there is substantial evidence that the BNST not only mediates threat anticipation and confrontation but also fear- or anxiety-related stress response via the hypothalamic–pituitary–adrenal (HPA) axis.
For example, when faced with a fear-provoking stimulus, such as encountering a spider, individuals with SP typically respond with heightened stress reactions like increased heart rate and trembling. This stress response is regulated by the HPA axis (Avery et al., 2016; Mobbs et al., 2010; Münsterkötter et al., 2015). Snyder and Silberman (2021) concluded that stress, alcohol, or drug exposure increases levels of norepinephrine and corticotropin-releasing hormone in the BNST, two signaling molecules released during the body’s stress response mediated by the HPA axis (Snyder and Silberman, 2021). Furthermore, alterations in HPA-axis function are associated with impaired fear inhibition, leading to overreactive behavior and increased stress responses toward fearful stimuli such as the presence of a spider in spider phobic (SP) fear (Hinds and Sanchez, 2022; Jovanovic et al., 2010; Mayer et al., 2017). Sustained anticipatory anxiety (e.g. expecting spiders in the basement) is related to activity in the BNST (Avery et al., 2016; Davis et al., 2010; Grupe et al., 2013; Zinbarg et al., 2006), and the amygdala (Carlson et al., 2011; Vytal et al., 2014). Pathological apprehensive expectations were hypothesized to induce hypervigilance in the BNST creating a continuous anxious state in patients with anxiety disorders (Hilbert et al., 2014). Hypervigilance is a key symptom in anxiety disorders including phobic fear and is related to alterations in BNST connectivity (Clauss et al., 2019; Grupe et al., 2013). Individuals with specific phobias such as SP fear are known to be more susceptible to developing other anxiety disorders through aberrant functioning of fear and anxiety networks such as general hypersensitivity to fear-associated stimuli (Eaton et al., 2018; Gorman et al., 2000).
The connections between these fear- and anxiety-related brain regions, as well as between fear and anxiety responses are so far inconsistently characterized. Despite all the recent efforts to better understand the BNST’s role in anxiety, its association with phobic fear and the interaction with the degree of anxiety is unknown. While several studies suggest clear differences in neural processing of fear and sustained anxiety responses through either amygdala (fear) or BNST (sustained anxiety) (Davis et al., 1997; Davis and Whalen, 2001; Straube et al., 2007), others support the theory of contribution of BNST and amygdala to both fear and anxiety responses (Davis et al., 2010; Grupe et al., 2013).
A suitable method to measure the functional connection between these fear- and anxiety-related brain regions is resting-state functional MRI (fMRI) functional connectivity (FC).
Resting state functional connectivity
Resting-state FC measures the correlation of intrinsically co-activated and deactivated spatially segregated brain regions in fMRI data (Biswal, 2015). This method has been well established in the investigation of disrupted resting-state networks that have been linked to various psychological disorders including anxiety disorders (Pariyadath et al., 2016). Therefore, resting-state FC serves as the optimal analysis tool to investigate FC changes of the amygdala and BNST in correlation with SP fear severity and anxiety scores.
In the current study, bilateral regions of interest (ROI) and previously identified resting-state networks involved in phobic fear processing were assessed in a resting-state FC analysis and associated with the severity of phobic fear symptoms and general anxiety in SP. In detail, the amygdala (fear recognition and processing), BNST (sustained anxiety), hippocampus (fear memory), parahippocampal gyrus (object-recognition and-location), orbitofrontal cortex (emotional processing), thalamus (fear memory formation), and striatum (decision making; mediating behavioral responses to threats) were used as ROIs. Salience (vigilance, detection, filtering, and determination of stimuli) and default mode (DMN; episodic memory, decision making, anticipation of future events, discrete experiences of emotion) networks have been previously shown to be involved in altered fear and anxiety processing and were therefore included in the analyses (Alvarez et al., 2011; Buckner et al., 2008; Buff et al., 2017; Cano et al., 2018; Fox et al., 2015; Makovac et al., 2016; Martynova et al., 2020; Menon, 2015; Ray and Zald, 2012).
To analyze the resting-state FC, this study used two separate analysis approaches:
An ROI–ROI analysis is calculated to assess the FC between a predefined set of ROIs such as resting-state networks. ROI–ROI analyses combine the blood-oxygen-level-dependent (BOLD) time series from all the voxels within each ROI for correlation with the BOLD time series of the other ROI(s). Due to the a priori hypothesis-driven selection of ROIs, the ROI–ROI method is a confirmatory approach to investigate alterations of FC between study groups, assuming ROIs to be relatively homogeneous in size. A ROI–ROI analysis is therefore more restrictive when assessing different, more inhomogeneous brain regions like the ones analyzed in this study.
The second approach, a seed-based connectivity (SBC) analysis, is used to explore the FC between a priori-defined seed regions (i.e., equally to the ROI–ROI method) with the entire brain. Hence, the seeds were also chosen based on the study hypotheses, yet the correlations were computed with all remaining voxels of the brain in particular, the FC between a seed and each voxel is assessed using the Fisher-transformed correlation coefficient between the average BOLD time series in the seed and the BOLD time series in each target voxel separately. Next, voxel-level statistics are computed in group/second-level analyses. This analysis approach is fine-grained and flexible to detect effects that may not be homogeneous (i.e., different locations throughout the brain and various in size) across different ROIs and had not been hypothesized.
Hypotheses
The current study aimed at identifying putatively aberrant resting-state FC of the BNST with brain regions in and outside the fear and anxiety networks in SP.
As individuals with spider phobia show a general hypersensitivity to fear-associated stimuli and are more susceptible to developing other anxiety disorders, we expect that they show higher levels of general anxiety as well as trait, state, and social anxiety than the control group.
Based on the structural and functional connections between the BNST and the amygdala, along with the BNST’s mediating role in amygdala-driven fear responses and its involvement in anxiety, we hypothesized the following outcomes for the SBC analyses:
First, we expected increased FC of the amygdala with other fear-related brain areas (i.e., salience network, hippocampus) in correlation with higher SP fear but not with general, state, trait, and social anxiety in SP. Second, we expected the BNST’s FC with fear-related brain areas to be reduced with SP fear severity but increased with general, state, trait, and social anxiety in SP. Third, we suggested higher FC of the hippocampus, orbitofrontal cortex, salience network, and striatum with other fear- and anxiety-related brain areas (i.e., prefrontal cortex) in correlation with SP fear severity, general anxiety, and state, trait, and social anxiety in SP when compared to HC.
For the ROI–ROI analysis, we expected higher FC of the amygdala with the hippocampus, orbitofrontal cortex, salience network, and striatum but not BNST in correlation with SP fear severity in SP. Furthermore, we hypothesized higher FC of the BNST and the amygdala and connecting anxiety-related brain areas (i.e., hippocampus) in correlation with general, state, trait, and social anxiety but not with SP fear severity in SP.
Materials and Methods
Participants
Participants took part in an observational study. Participants between the ages of 18 and 50 years were recruited via adverts in local newspapers and online marketplaces as well as through word-of-mouth propaganda. Those who were eligible were informed about the study and screened for inclusion and exclusion criteria. Participants were excluded if they met the following criteria: diagnosed neurological or psychiatric disorders other than phobic fear, use of psychoactive drugs, contraindications to perform an MRI, pregnancy, and inability to understand study procedure. In total, 119 potential study participants were screened; 19 individuals with spider phobia and 25 HC were not included due to age, other comorbidities, drug use, or withdrawal of interest in participating.
The study sample comprised 30 participants with SP (26 women, 4 men) with an average age of 28.30 years (standard deviation [SD] 5.94). The healthy control (HC) sample comprised 45 participants (17 women, 28 men) with an average age of 26.27 years (SD 5.99). A detailed sample description is shown in Table 1.
Demographic and Clinical Variables of Participants with Phobic Fear and Healthy Controls
BSCL, Brief Symptom Checklist (general, clinical symptoms); FSQ, Fear of Spiders Questionnaire (spider phobic fear); HC, healthy controls; LSAS, Liebowitz Social Anxiety Scale (social anxiety); SP, participants with spider phobic fear; STAI, State-Trait Anxiety Inventory (general anxiety); VAS, Visual Analogue Scale (subjective fear); T, t-test; U, Mann–Whitney U test; χ 2, chi-square test. Significance threshold: p < 0.05.
All participants provided written informed consent and the study was approved by the local ethics committee (KEK-number: 2020-01259) and registered at the Deutsches Register Klinischer Studien (DRKS00023089). All study participants received 50 Swiss Francs for their participation and members of the SP group received the opportunity to participate in a group therapy for SP fear.
Study procedure
Participants were first contacted by phone, where they were informed about the study and screened for inclusion and exclusion criteria including possible SP fear. Afterward, each subject received the detailed study information as well as the informed consent form before the study assessment. Eligible participants were assigned to either the phobic fear (SP) or control group (HC) based on their declaration at screening and their scoring in the Fear of Spiders Questionnaire (FSQ); (Szymanski and O’Donohue, 1995). An FSQ score over 50 was used for SP group assignment.
Subsequently, the participants were invited to the study Swiss Institute for Translational and Entrepreneurial Medicine at Inselspital Bern, where final questions about the study were answered and the subject’s written consent was obtained. They then completed several questionnaires regarding sociodemographic and clinical aspects. Subsequently, the second assessment took place, and the participants were asked to fill out questionnaires regarding anxiety and fear pre-MRI followed by the MRI measurement. Prior to the resting-state fMRI measurement, participants were instructed to close their eyes and attempt to stay awake for the duration of the sequence. Afterward, participants were asked to fill out questionnaires regarding anxiety and fear post-MRI measurement.
Measurements
As individuals with spider phobia show a general hypersensitivity to fear-associated stimuli and are more susceptible to developing other anxiety disorders, we expect that they show higher levels of general anxiety as well as trait and state anxiety than the control group. Therefore, different questionnaires were used to assess general pathological anxiety.
Clinically significant symptoms like general anxiety were assessed by the global severity index of the Brief Symptom Checklist (BSCL; Derogatis, Derogatis, 1993). Conducting the BSCL is important to confirm that both study groups, HC and SP, consist of healthy participants, except for the diagnosis of spider phobia in the SP sample. The BSCL consists of 53 items assessing the following symptom dimensions: obsession-compulsion, somatization, depression, interpersonal sensitivity, hostility, anxiety, phobic anxiety, paranoid ideation, and psychoticism. To assess for different dimensions of fear and anxiety, the underlying study focused not only on the BSCL total score but the BSCL Anxiety subscale as well. A score of 63 or above is considered clinically relevant (Derogatis, 1975). SP fear was assessed with the validated 18-item self-report FSQ; (Szymanski and O’Donohue, 1995). State (i.e., transient reactions directly related to a stimulus and moment) and trait (i.e., stable reaction over time) anxiety was assessed using the State-Trait Anxiety Inventory (STAI); (Spielberger, 1989; Vagg et al., 1980) and social anxiety with the Liebowitz Social Anxiety Scale self-report version (LSAS); (Fresco et al., 2001; Hoyer, 2005; von Consbruch et al., 2016). An LSAS self-report score over 73 is considered a cutoff score with maximum specificity (Rytwinski et al., 2009).
A Visual Analogue Scale (VAS), ranging from 0 (no fear) to 10 (maximum fear), was used to assess subjective acute fear levels before the MR measurement as a baseline and after the MR measurement to evaluate fear levels influenced by the MR procedure (e.g., noise, limited space).
MRI-data acquisition
MRI data were acquired at the Department of Diagnostic and Interventional Neuroradiology, University Hospital of Bern, with a 7 Tesla Siemens MAGNETOM Terra scanner and with a 32-channel receive 32 Rx/1 Tx RF coil (Nova Medical, Wilmington, MA, USA). For high-resolution structural images, a bias-field corrected MP2RAGE sequence with the following parameters was used: 256 slices, field of view = 240 × 240 matrix, voxel size = 0.63 × 0.63 × 0.63 mm3, repetition time = 6000 ms, echo time = 2.06 ms, inversion time T1 = 800 ms, and T2 = 2700 ms. The MP2RAGE sequence generated two gradient echo images (INV1 and INV2) and a T1-weighted image (UNI) out of which a denoised image (UNI-DEN) was calculated automatically.
fMRI resting-state data were acquired using an EPI-sequence with the following parameters: 60 slices, 360 volumes, field of view with a 204 × 204 matrix, voxel size = 2 × 2 × 2 mm3, repetition time = 1000 ms and an echo time = 25.0 ms.
Resting-state fMRI data preprocessing
Resting-state fMRI data were preprocessed using the default preprocessing pipeline of the CONN FC toolbox (Nieto-Castanon and Whitfield-Gabrieli, 2021).
Images were first realigned and unwarped to bring each of the volumes into alignment with the reference volume (first slice). All scans were coregistered and resampled to the first image using b-spline interpolation. This process also corrects for potential susceptibility distortion caused by motion. This was achieved by estimating the derivatives of the deformation field relative to head movement and resampling the functional data to align with the deformation field of the reference image. Then, slice-timing correction was done to correct for temporal misalignment between different slices of the functional data within each volume. The imaging data was time-shifted and resampled using sinc interpolation to align with the midpoint of each acquisition time. The slice time order was extracted from the functional JSON metadata. Potential outlier scans were identified based on the observed global BOLD signal and the extent of subject motion in the scanner. For functional outlier detection, intermediate settings (97th percentile in normative sample) were used. Functional and anatomical data were then coregistered, segmented, and normalized to MNI coordinates. Images were then checked for preprocessing/normalization quality, and manually reoriented were needed. Last, smoothing was performed using a Gaussian kernel of 3 mm full-width half maximum.
Denoising of resting-state fMRI data
To minimize the influence of artifactual factors on FC measures, the default denoising pipeline of the CONN toolbox was applied. It employs an anatomical component-based noise correction procedure (aCompCor) to account for potential confounding effects, including noise components from cerebral white matter and cerebrospinal areas (Behzadi et al., 2007), estimated subject-motion parameters (Friston et al., 1996), identified outlier scans or scrubbing (Power et al., 2014). Motion-related BOLD variability was corrected using a total of 12 potential noise regressors defined from the estimated subject-motion parameters. These include three translation parameters, three rotation parameters, and their associated first-order derivatives. Scrubbing for motion and outlier correction, and denoising were done using linear regression of potential confounding effects in the BOLD signal. A temporal high-pass filter of 0.006 Hz was then applied minimizing the influence of physiological, head-motion, and other noise.
Computation and analysis of ROI–ROI and SBC of functional resting-state data
The spatial FC over time in the predefined ROIs was analyzed in a first-level analysis of the CONN toolbox. This was followed by statistical (group) comparisons of FC data between SP and HC groups (second-level analysis).
First-level SBC and ROI–ROI analysis
According to the hypothesis, the following bilateral ROIs implemented in the CONN toolbox were chosen based on previous research on fear- and anxiety-related brain areas: amygdala (Brinkmann et al., 2017; Buff et al., 2017), hippocampus (Pedersen et al., 2017a; 2017b), orbitofrontal gyrus (Sladky et al., 2012), thalamus (Cano et al., 2018; Troyner et al., 2018), parahippocampal gyrus (Aminoff et al., 2013; Kirlic et al., 2022), striatum (caudate, putamen, and pallidum), default mode network (medial prefrontal cortex, posterior cingulate cortex, and lateral parietal region) (Soravia et al., 2018), and salience network (anterior insula, rostral prefrontal cortex, supramarginal gyrus, and anterior cingulate cortex) (Soravia et al., 2018). Additionally, a previously validated bilateral BNST mask, counting 396 voxels with a 2-mm isovoxel resolution (Avery et al., 2014) was added manually to the CONN toolbox. All previously mentioned ROIs were then used to calculate first-level analyses of resting-state FC data. First, a whole brain SBC and ROI–ROI analysis with the before-mentioned seeds was calculated in a participants-wise general linear model (GLM) to assess altered FC in SP. Subject-wise GLM calculations were then further investigated in a second-level SBC and ROI–ROI analysis.
Second-level SBC analysis
Second-level group analysis of SBC between SP and HC was performed with a GLM for each predefined seed or network (connectivity maps of first level) using age and sex as covariates of no interest, correcting for multiple testing (
FC Results of Resting-State fMRI Data of Participants with Spider Phobic Fear in Correlation with Clinical Variables
Single ROI results are reported as T, and multiple ROI/network results are reported as F.
a., anterior; BNST, bed nucleus of the stria terminalis; BSCL, Brief Symptom Checklist (general, clinical symptoms); DMN, default mode network; FC, functional connectivity; L, left; FSQ, Fear of Spiders Questionnaire (spider phobic fear); inf., inferior; LSAS, Liebowitz Social Anxiety Scale (social anxiety); p., posterior; POC, parietal operculum cortex; R, right; STAI, State-Trait Anxiety Inventory (general anxiety). Significance threshold: p < 0.05.
To assess whether the resulting statistically significant clusters of the SP group, which reflected altered FC dependent on the fear or anxiety severity, showed a comparable relationship in the HC group, binary masks of these clusters were derived. Next, individual peak-voxel FC strengths of both SP and HC participants were extracted from each cluster for statistical comparison between SP and HC.
Post hoc group comparisons
Peak-voxel FC values of each significant connection of the SBC analysis were subjected to a linear model fitting using the ggplot2 package in R (R core Team, 2022; Wickham, 2016). This linear model fitting was performed for each group separately, yielding R and p values depicted in Figures 1 and 2. To test whether the observed group differences were statistically relevant, mean peak-voxel FC and questionnaire scores were z-transformed and compared between the groups using Pearson correlation coefficients in the cocor toolbox implemented in R (Diedenhofen, 2015; R core Team, 2022). To assess possible FC differences between the groups SP and HC, peak-voxel FC was subjected to a Wilcoxon test for each connection separately (Figures 1 and 2, top right corner in each subplot). All post hoc tests were considered statistically significant at p < 0.05.
Second-level ROI–ROI analysis
A second-level group analysis of the ROI–ROI analysis was then calculated to assess group differences in ROI–ROI FC as well as in correlation with covariates of interest (FSQ, LSAS, BSQL, STAI-trait, STAI-state, and VAS fear). All effects were thresholded with p < 0.05 (uncorrected) at connection level and p < 0.05 (FDR corrected) at cluster level using the multivariate pattern analysis omnibus test.
Statistical analyses of demographic and clinical variables
Sociodemographic and clinical variables between SP and HC were compared using parametric t-tests for normally distributed variables. Non-normally distributed variables were investigated using the Mann–Whitney U test. A chi-square test was used for dichotomous variables. All tests were calculated in the Statistical Package for Social Sciences SPSS 27.0 (SPSS, Inc., Chicago, Illinois). All tests were two-tailed and a probability of <0.05 was considered statistically significant.
Results
A post hoc power analysis was conducted using G*Power 3.1 (Faul et al., 2009) to test the difference between two independent group means using a two-tailed test, a medium effect size (d = 0.50), and an alpha of 0.05. The result showed that a total sample of 45 participants with two groups (HC = 45, SP = 30) was required to achieve a power of 0.55.
Study population
SP did not differ from HC regarding sociodemographic variables such as age (p = 0.060) or years of education (p = 0.471) but sex (p = 0.000027), in the way that more female participants were in the SP group. Regarding the clinical variables, the SP group showed higher scores in almost all anxiety measurements as shown in Table 1. SP showed a significantly higher FSQ total (p = 2.5497e−13), BSCL Anxiety (p = 0.035), STAI-trait (p = 0.021), STAI-state pre- and post-MRI (ppre = 0.00041; ppost = 0.005), and VAS Fear pre- and post-MRI (ppre = 0.006; ppost = 0.002), but not LSAS (p = 0.058) or BSCL total (p = 0.194) scores compared to HC. For details, refer to Table 1.
SBC analysis
No group differences in the SBC analysis between SP and HC could be observed for all investigated seeds. Following group comparison analysis, linear regression analysis within each group was performed.
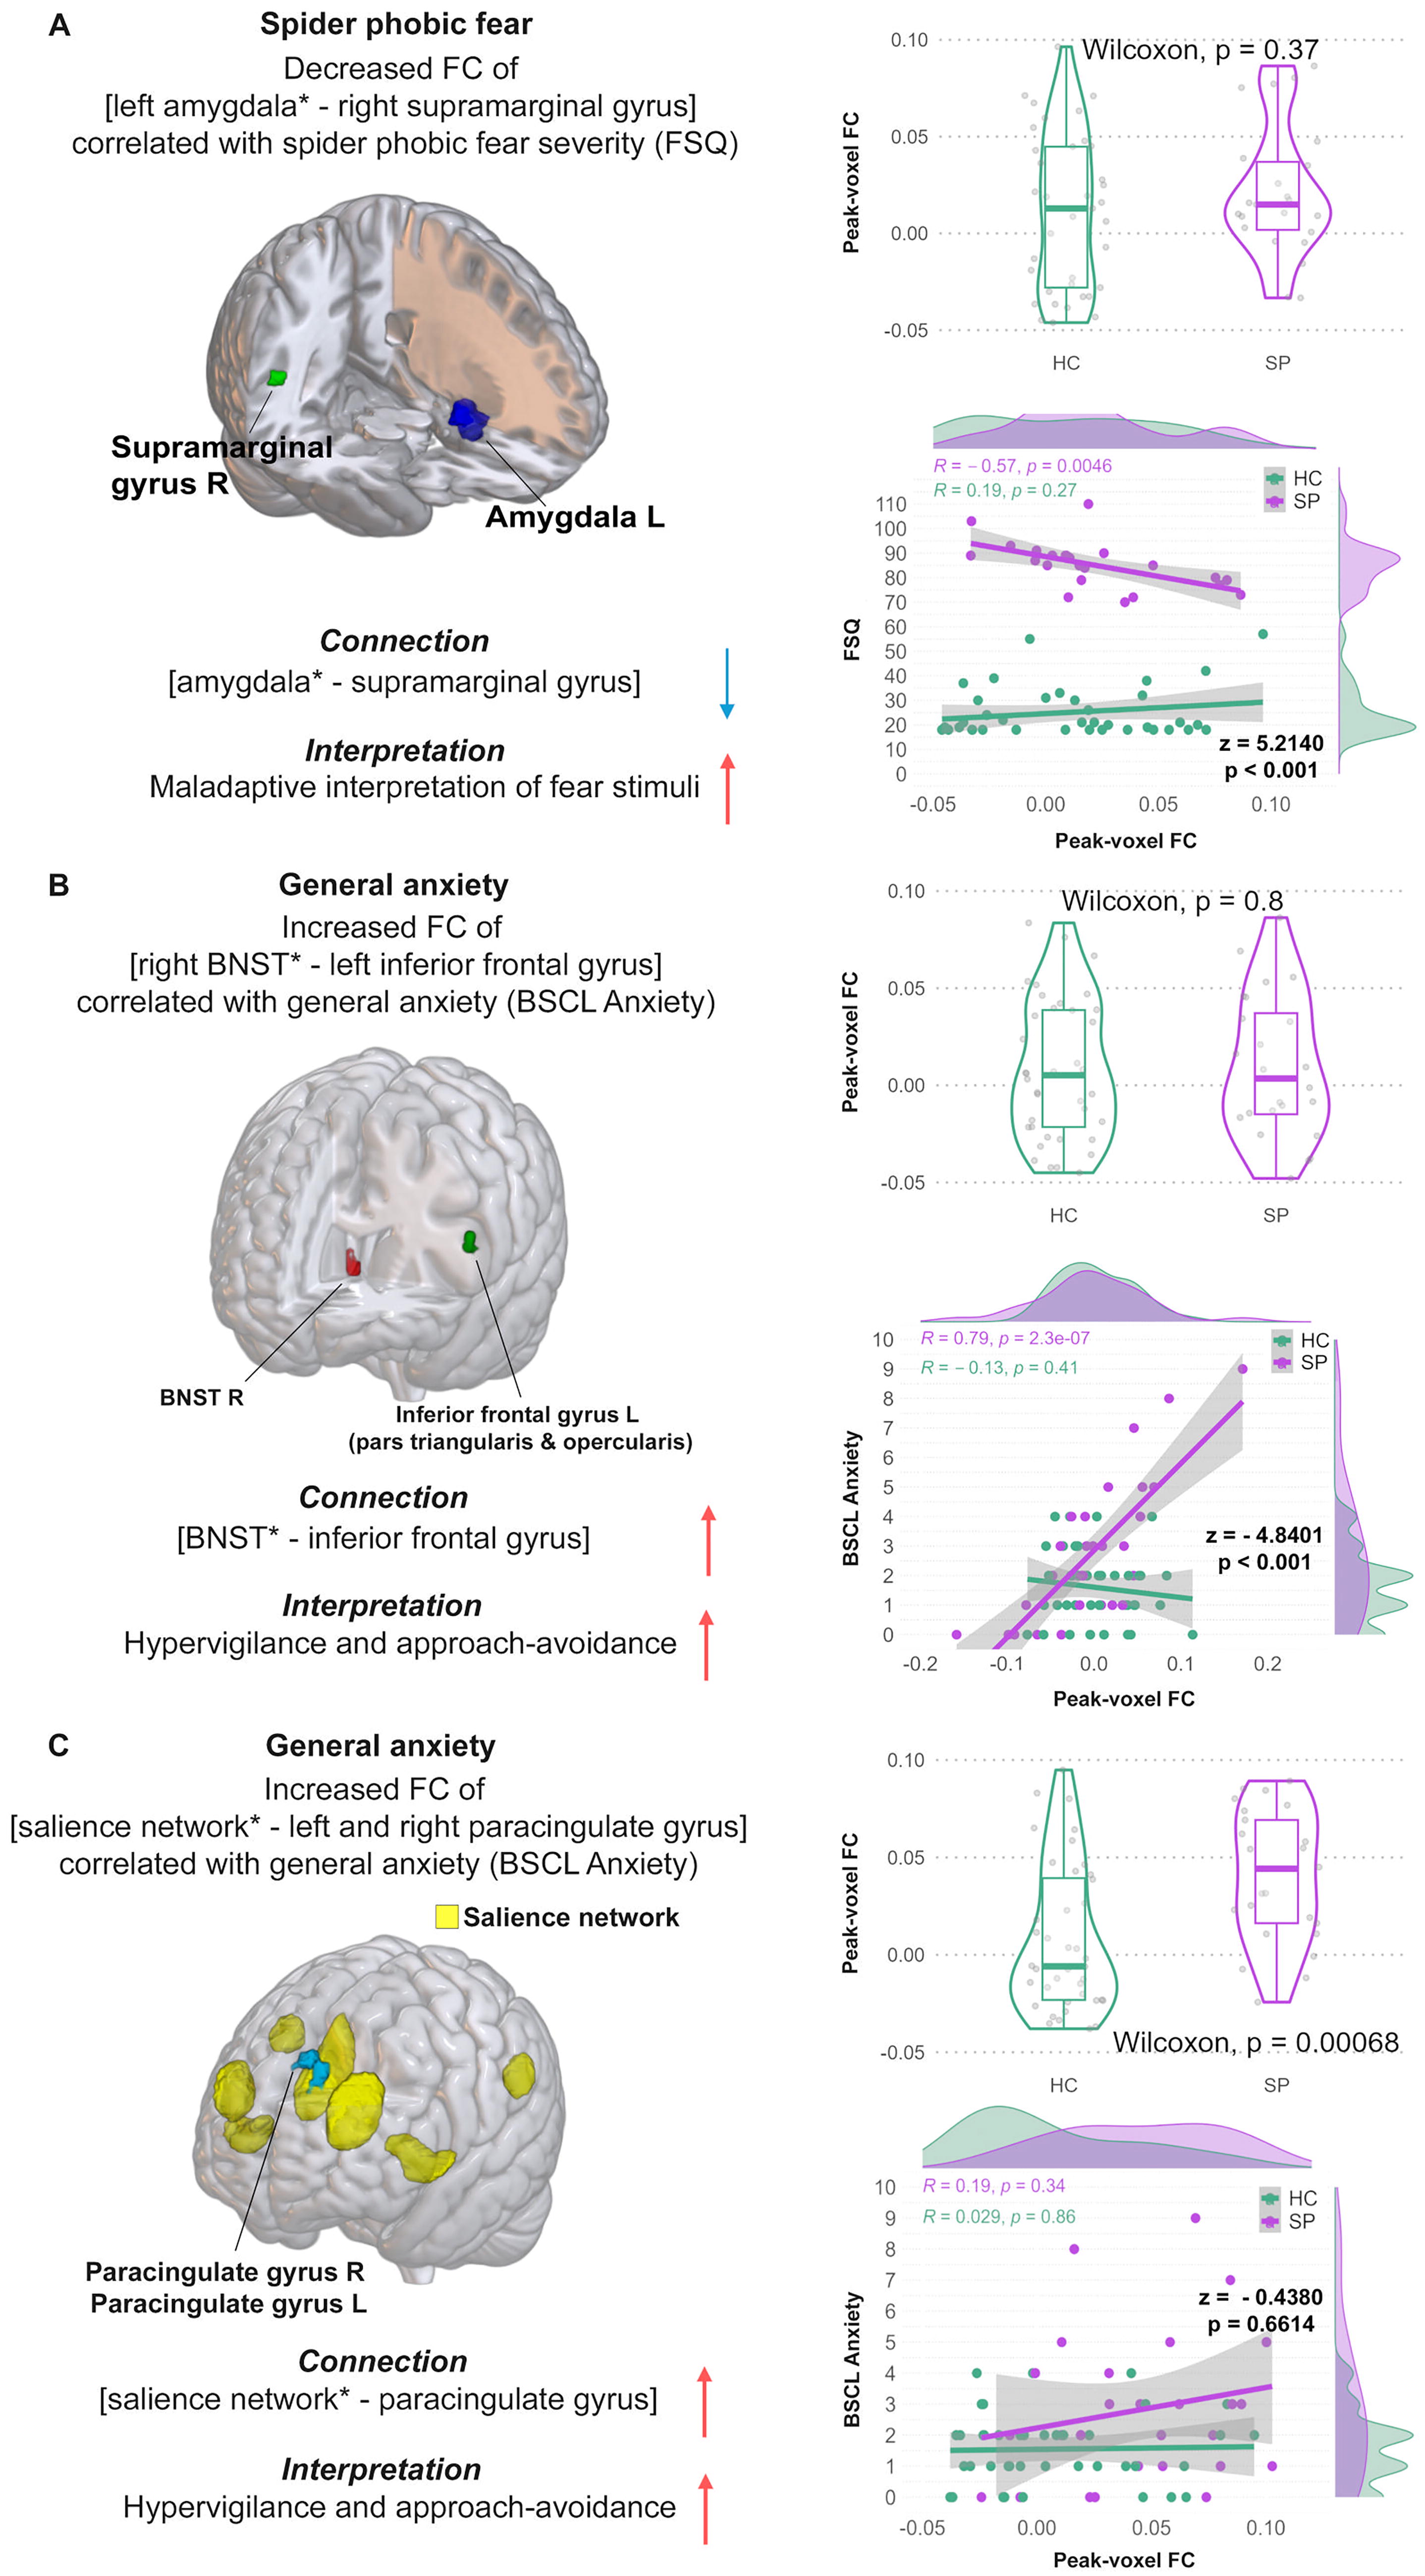
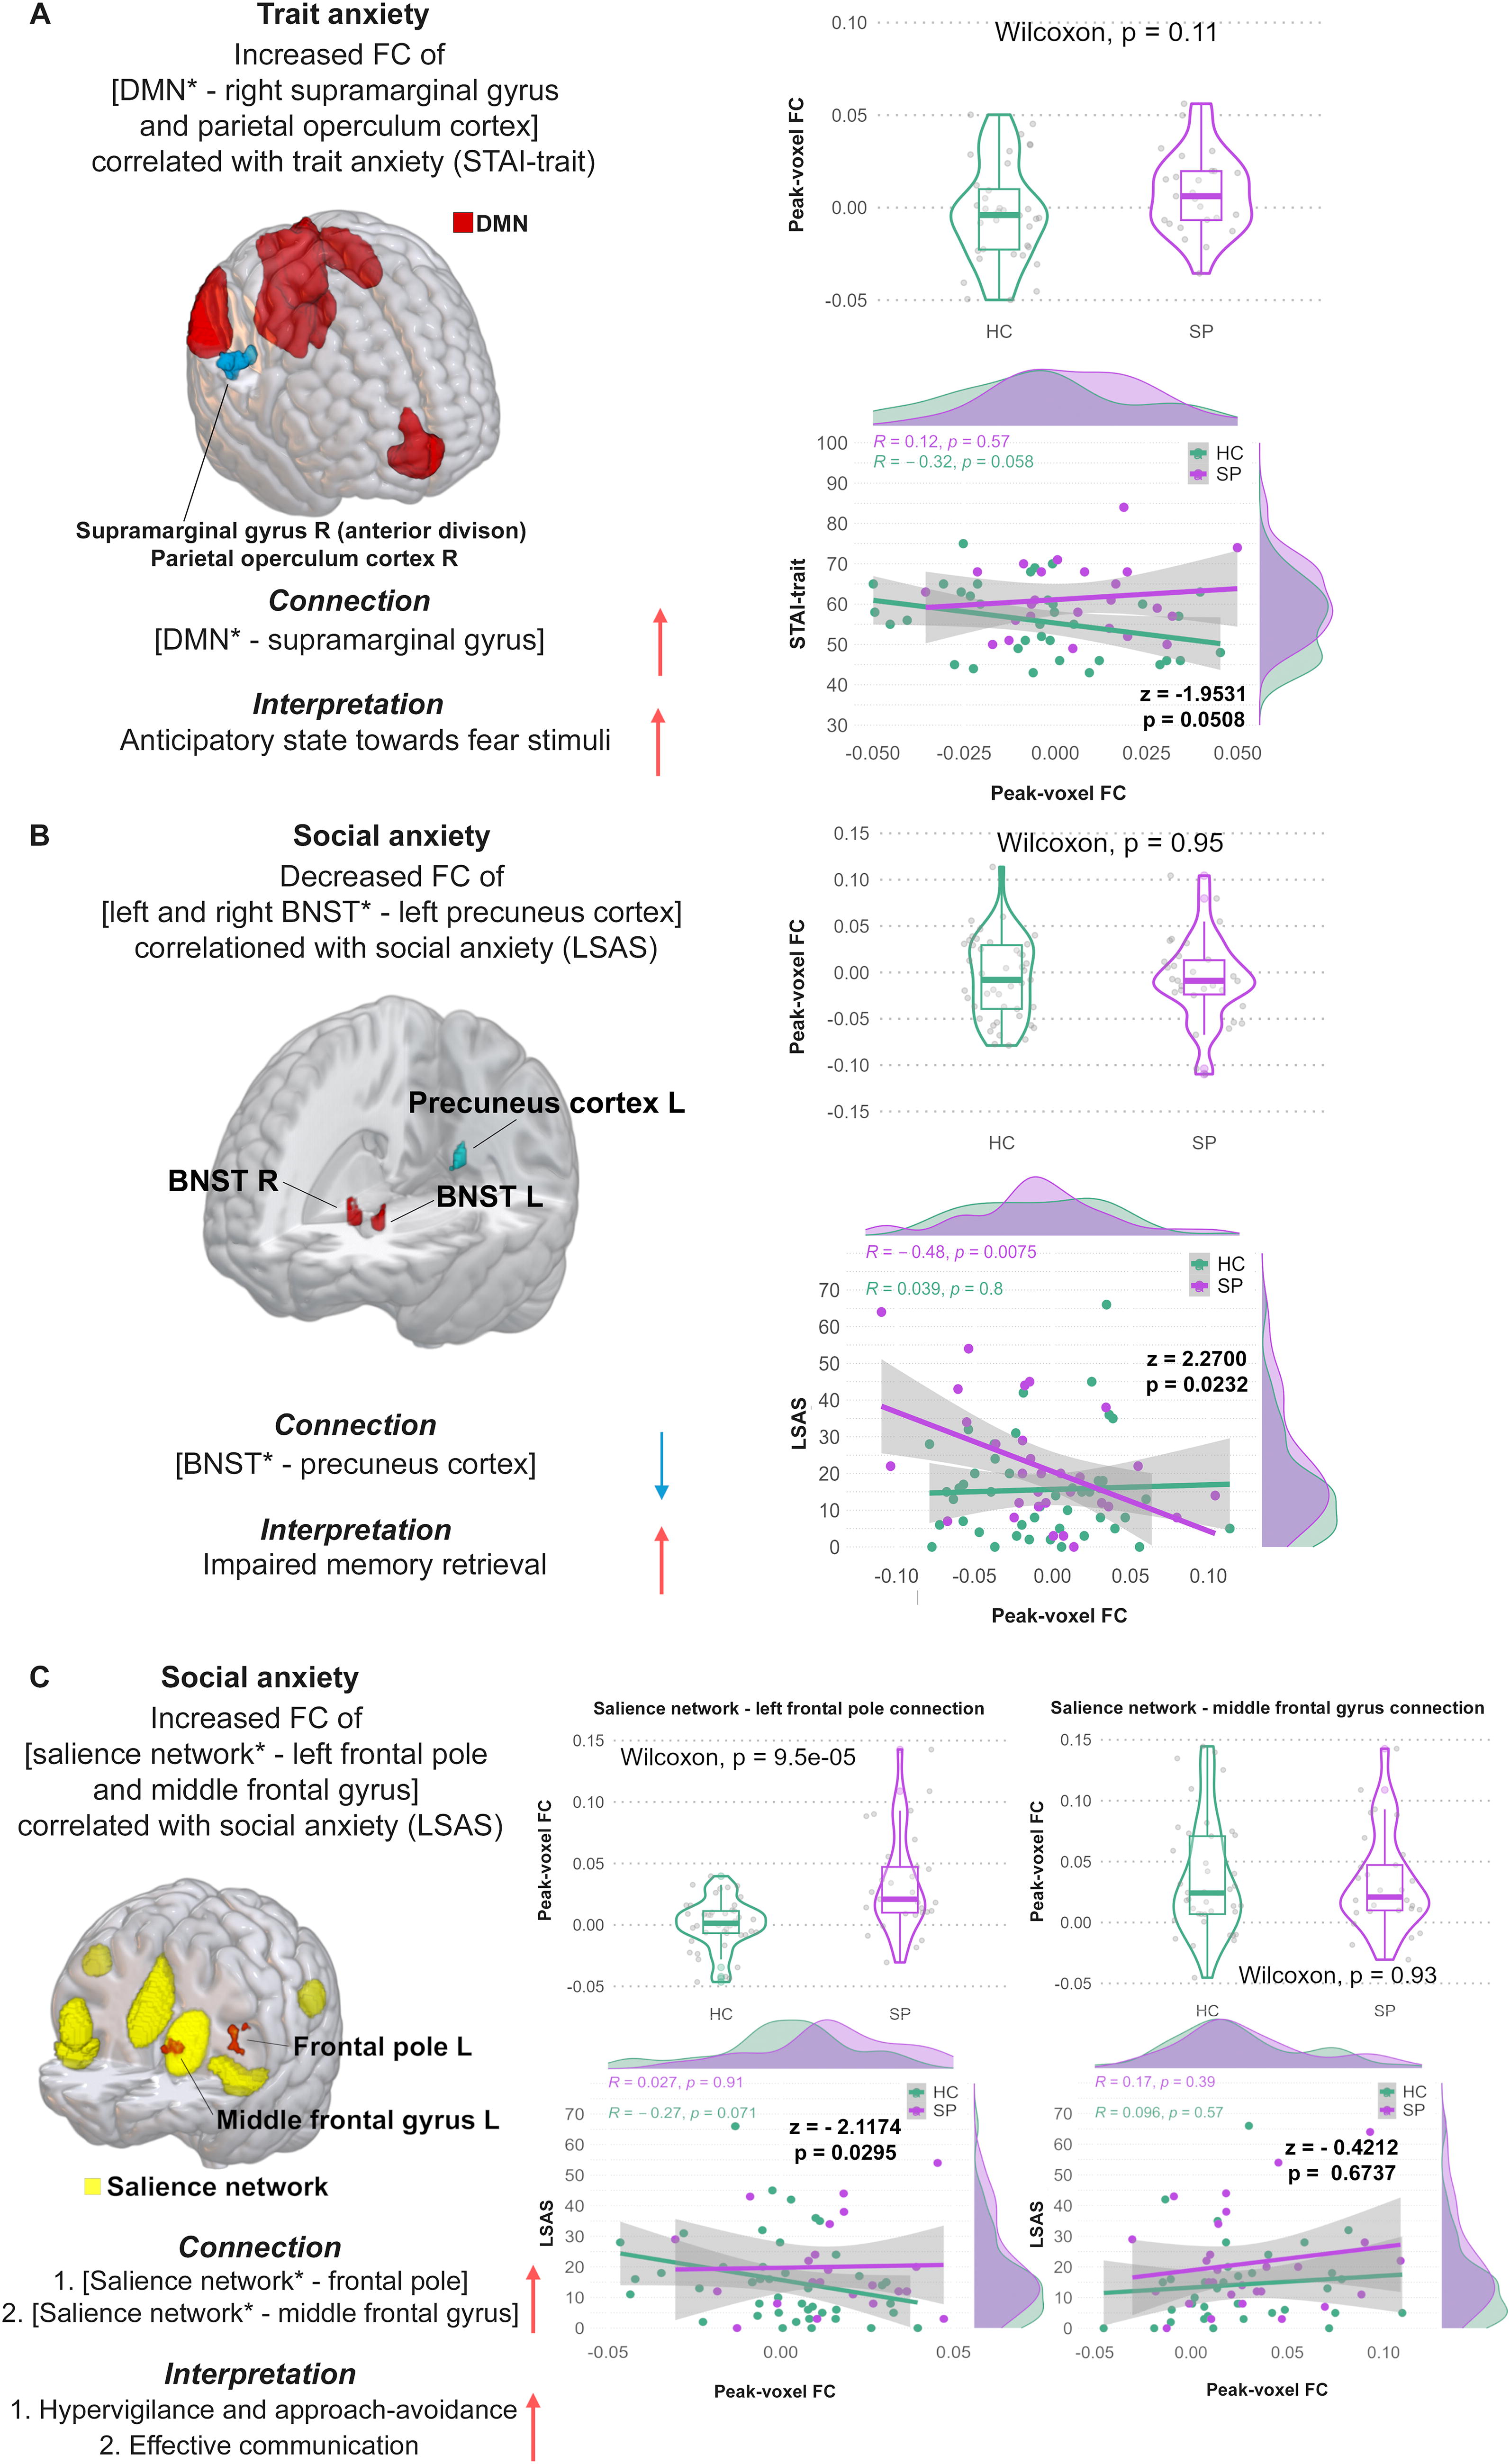
The SBC analysis in SP showed decreased FC between [left amygdala—right supramarginal gyrus] with increased FSQ scores (T[28] = −7.16, p = 0.001; see Table 2; Figure 1A, left panel). Furthermore, SP showed increased FC of [right BNST—left inf. frontal gyrus] (T[28] = 6.78, p = 0.040; r [28] = 0.79, p = 2.8e−07) as well as increased FC of [salience network—left and right paracingulate gyrus] (F[7 22] = 6.33, p = 0.021; r [28] = 0.19, p = 0.34) in correlation with the BSCL anxiety score (see Table 2, Figure 1B+C, left panel). Higher STAI-trait scores reflected in increased FC of [DMN—right anterior supramarginal gyrus and the right parietal operculum cortex] (F[4 25] = 11.58, p = 0.005; r [28] = 0.12, p = 0.57) in SP (see Table 2, Figure 2A, left panel). Moreover, SP showed decreased FC between [left and right BNST − left precuneus cortex] with higher LSAS scores (F[2 27] = 20.07, p = 0.015; r [28] = −0.48, p = 0.008) as well as increased FC of [salience network—left frontal pole] (F[7 22] = 4.16, p = 0.00057; r [28] = 0.027, p = 0.91) and [salience network—middle frontal gyrus] (F[7 22] = 2.8, p = 0.0038; r [28] = 0.017, p = 0.39; see Table 2; Figure 2B+C, left panel). The remaining SBC results of SP are not further discussed but can be found in Supplementary Table S1.
The SBC analysis in HC did not show significant FC effects in the identical seed–cluster connections of SP. All FC results of HC are shown in Supplementary Table S2.
Post hoc group comparisons
Mean FC group comparisons displayed a significant group difference in the [salience network− left and right paracingulate gyrus] (see Figure 2C, middle panel, top) and [salience network − left frontal pole] connection (see Figure 1C, right panel, top). No other mean FC group differences could be observed (see Figures 1 and 2).
Post hoc group correlation analyses showed a significant negative correlation of peak-voxel FC values of the [left amygdala − right supramarginal gyrus] connection and FSQ score in SP but not in HC (z = 5.2140, p < 0.001, Figure 1A, right panel, bottom).
Furthermore, a higher BSCL Anxiety subscale correlated positively with the [right BNST – left inferior frontal gyrus] connection in SP but not HC (z = −4.8401, p < 0.001, Figure 1B, right panel). No significant group difference of the [salience network − left and right paracingulate gyrus] connection in combination with the BSCL Anxiety score was found (z = −0.4380, p = 0.6614, Figure 1C, right panel, bottom).
STAI-trait scores showed no group difference in the correlation with the [DMN − right anterior supramarginal gyrus and the right parietal operculum cortex] connections (z = −1.9531, p = 0.0508, Figure 2A, right panel, bottom).
In contrast, the group comparison between SP and HC including peak-voxel FC values of the [bilateral BNST − left precuneus cortex] connection with the LSAS score showed a significant negative correlation with the LSAS score in SP but not in HC (z = 2.2700, p = 0.0232, Figure 2B, right panel, bottom). No significant post hoc result could be observed for the [salience network − left frontal pole] (z = −2.1774, p = 0.0295, Figure 2C, right panel, bottom) and the [salience network − middle frontal gyrus] connections in relation to the LSAS score (z = −0.4212, p = 0.6736, Figure 2C, right panel, bottom).
ROI–ROI analysis
No ROI–ROI differences between SP and HC could be observed between any of the investigated ROIs.
Discussion
The primary focus of this study was to explore differences in resting-state FC between individuals with SP fear and HCs, particularly in the BNST and the amygdala.
SBC Analysis
Amygdala and SP fear
Focusing on the SBC analysis, higher SP fear severity was coupled with decreased FC between the left amygdala and right supramarginal gyrus in SP (see Figure 1A, a finding that was not observed in the HC group. Post hoc group correlation analyses showed a significant negative correlation of peak-voxel FC values of the [left amygdala − right supramarginal gyrus] connection and FSQ score in SP but not in HC. Previous studies show that the supramarginal gyrus is involved in visuospatial imagery (i.e., the position of a spider in a room), identifying postures (i.e., spider or bug), and gestures of other people, controlling empathy toward other people (Maguire, 2001; Makovac et al., 2016; Wada et al., 2021), yet especially crucial in interpreting phobic stimuli (Mizzi et al., 2024; Schwab et al., 2020). This aligns with our SBC hypothesis predicting decreased amygdala FC with fear-related brain regions, with the supramarginal gyrus also being involved, and higher SP fear severity. The finding of decreased resting-state FC of the [left amygdala − right supramarginal gyrus] connection in correlation with higher SP fear severity indicates that participants with stronger SP fear severity also tend to show maladaptive interpretation of fear-related stimuli. Participants with SP fear might therefore struggle to put those fear-stimuli into an anxiolytic context resulting in maladjusted behavior mechanisms.
BNST, salience network, general anxiety, and social anxiety
Altered BNST FC in SP compared to HC was found in regression analyses:
First, SP showed increased FC of the [right BNST − left inferior frontal gyrus] (Figure 1B) as well as increased FC of the [salience network − left and right paracingulate gyrus] (Figure 1C) connections in correlation with general anxiety scores (BSCL anxiety). Furthermore, peak-voxel FC group comparisons displayed a significant group difference in the [salience network-left and right paracingulate gyrus] connection (see Figure 1C, right panel, top). These findings are in line with our SBC hypothesis of increased BNST and salience FC with anxiety-related brain areas (including the inferior frontal gyrus and paracingulate gyrus); and in correlation with general, state, and trait anxiety in SP. Previous studies have found higher FC between the inferior frontal gyrus, a crucial region for the interpretation of stimulus meaning, and the caudate nucleus in patients with social anxiety disorder compared to HC (Anteraper et al., 2014) as well as increased FC in the inferior frontal gyrus in patients with generalized anxiety disorder (Ma et al., 2019). Furthermore, disrupted feedback between the inferior frontal gyrus and the prefrontal-limbic control circuit resulting in less inhibition of the amygdala was found in clinically anxious individuals (Cha et al., 2016; Du et al., 2021). As previously shown, the amygdala seems to be less inhibited by the activation of the inferior frontal gyrus, in combination with the result of [increased BNST − inferior frontal gyrus] FC this indicates a higher coactivation of BNST and amygdala via frontal-limbic (inferior frontal gyrus − amygdala − BNST) pathways. The increased FC of the [salience network − left and right paracingulate gyrus] connection in correlation with general anxiety scores reinforces this finding as the paracingulate gyrus is part of the limbic network and responsible for emotion processing, learning, and memory (Hadland et al., 2003; Ray and Zald, 2012; Stanislav et al., 2013). The salience network contributes to a variety of complex brain functions such as social behavior and communication by integrating sensory, emotional, and cognitive information (Menon, 2015; Uddin, 2017). Increased FC of the [salience network − left and right paracingulate gyrus] connection mirrors higher coactivation of those regions contributing as well to increased hypervigilance and approach–avoidance toward fearful stimuli such as spiders.
Second, SP showed decreased FC of the [left and right BNST − left precuneus cortex] as well as increased FC of the [salience network and the left frontal pole] connections in correlation with higher social anxiety scores. These two findings are also in line with our SBC hypothesis of increased BNST and salience FC with anxiety-related brain areas (including the precuneus cortex and frontal pole); and in correlation with general, state, trait, and social anxiety in SP. The precuneus cortex is involved in episodic memory retrieval [i.e., precuneus activation during regeneration of previous contextual associations; Lundstrom et al (2005)] and plays a central role in assessing the context of (fear-) stimuli (Hebscher et al., 2019; Lundstrom et al., 2005; Utevsky et al., 2014). For instance, Hebscher et al (2019) were able to show that memory is altered after stimulation of the precuneus cortex (Hebscher et al., 2019). Furthermore, the BNST’s activity of mediating sustained anxiety and hypervigilance through the amygdala is known to be increased in people with anxiety disorders such as a specific phobia, contributing to aberrant responses to fearful stimuli and creating a continuous anxious state and abnormal behavior such as scanning each room for spiders before entering (Alvarez et al., 2011; Avery et al., 2016; Davis et al., 2010; Hilbert et al., 2014; Lebow and Chen, 2016). Previous studies have already reported that the BNST mediates fear- and anxiety-related stress responses via the HPA axis (Avery et al., 2016; Mobbs et al., 2010; Münsterkötter et al., 2015; van de Poll et al., 2023). Alterations in HPA-axis function are believed to be associated with impaired fear inhibition leading to hyperreactivity and increased stress responses toward fearful stimuli such as the presence of a spider (Hinds and Sanchez, 2022; Jovanovic et al., 2010; Mayer et al., 2017). Thus, decreased FC of the [BNST − precuneus cortex] connection in participants with SP and higher social anxiety levels indicate that episodic memory retrieval toward fearful stimuli/situations is reduced compared to HC. This indicates that SP perform worse in connecting salient stimuli inputs to their previous experiences and memories making it harder for them to interpret those salient stimuli in a regular context and react appropriately. Misinterpretation of these stimuli as well as the increased BNST − inferior frontal gyrus functional connection result in hyperactivity of the BNST and are responsible for creating a continuous anxious state in participants with specific phobia resulting in permanent stress response of the body through the HPA axis. SP might therefore present with a higher stress level due to threat anticipation mechanisms preparing them for fight-or-flight reactions toward fearful stimuli. Taken together, we found evidence of aberrant BNST connections in the brain SP. These alterations could be responsible for sustained anxiety through the BNST’s connection with the HPA axis, leading to a continuous anxious state. These sustained anxiety mechanisms might be the key neurophysiological correlate of hypervigilance in phobic fear and other fear and anxiety disorders. Finally, SP showed a positive coupling of the salience network and the left frontal pole with higher social anxiety scores (Figure 2C). This is in line with our hypothesis of increased FC in the salience network. The frontal pole plays an important role in controlling emotional approach–avoidance actions. Appropriate regulation of emotional behavior is key to successful participation in human society and is often impaired in people with anxiety disorders (Bramson et al., 2020; Cisler and Olatunji, 2012; Jacob et al., 2014).
The left middle frontal gyrus is responsible for effective communication (i.e., ability to speak and listen) as well as for rapid eye movements to scan numerous details within a scene or image in a short amount of time (El-Baba and Schury, 2024). An increased FC of the [salience network − left frontal pole] connection could contribute as well to increased hypervigilance and approach–avoidance toward fearful stimuli such as spiders. The increased [salience network − left middle frontal gyrus] connection could therefore reflect reinforced effective communication in participants with SP, especially when faced with fear-provoking stimuli.
However, post hoc peak-voxel FC group comparisons displayed a significant group difference in the [salience network − left frontal pole connection] with SP showing higher mean FC in this connection when compared to HC (see Figure 1C, right panel, top). No such observation could be made for the [left and right BNST − left precuneus cortex] connection. Furthermore, the post hoc correlation analysis of extracted peak-voxel FC values of the [salience network − left frontal pole] and [salience network − middle frontal gyrus] connection and the social anxiety score showed no significant impact of social anxiety scores on these connections.
DMN and trait anxiety
Increased hypervigilance can furthermore be reflected in the result of higher trait anxiety scores of SP, as higher trait anxiety correlated with FC of the [DMN − right anterior supramarginal gyrus and right parietal operculum cortex] connection (Figure 2A). This result of higher FC of DMN and anxiety-related brain areas was not hypothesized previously but supports our hypothesis of higher trait anxiety scores in SP. The DMN plays an important role in cue safety learning as well as in facilitating a state of readiness in response to environmental changes such as stimuli (Buckner et al., 2008; Fullana et al., 2016; Kluetsch et al., 2012; Marstaller et al., 2021). As previously mentioned, the supramarginal gyrus is important in decoding phobic stimuli (Hudson et al., 2020; Schienle et al., 2005; Schwab et al., 2020). The parietal operculum is known to contain the second somatosensory cortex, a brain area responsible for integrating spinothalamic-driven information such as pain, heat and cold sensitivity, crude touch, and itching (Cattaneo et al., 2015; Garcia-Larrea and Mauguière, 2018). The combination of its function and anatomical closeness to thalamus, insula, and other limbic structures the parietal operculum is believed to be a key area for the final perceptual experience (Garcia-Larrea and Mauguière, 2018; Richardson and Fridriksson, 2016). An increased FC of the [DMN − right anterior supramarginal gyrus and right parietal operculum cortex] connection reflects a higher anticipatory state of SP toward stimuli. Nevertheless, post hoc group comparison has shown no significant influence of trait anxiety scores between both groups on the [DMN − right anterior supramarginal gyrus and right parietal operculum cortex] connection.
ROI–ROI Analysis
The ROI–ROI analysis neither showed any significantly different group interactions nor any significant correlations with the fear and anxiety specific variables of interest. This might be due to differences in sensitivity of ROI–ROI compared to SBC analysis. A ROI–ROI analysis is used to assess the FC between a predefined set of ROIs such as resting-state networks, thereby assuming relatively homogeneous ROIs. It is therefore more restrictive when assessing different, more inhomogeneous brain regions. In contrast, SBC analyzes the connectivity patterns between specific ROIs and the rest of the brain, accounting more for inhomogeneous regions. The SBC analysis provides more flexibility to detect effects that may not be homogeneous across ROIs (Nieto-Castanon, 2023; Nieto-Castanon and Whitfield-Gabrieli, 2021). Given the ROIs included in this study being relatively inhomogeneous due to their different locations throughout the brain and their difference in size, the nonfinding could be explained by a lower sensitivity in the ROI–ROI compared to the SBC analysis.
General FC and ROI–ROI discussion
Differences in correlations between resting-state FC and fear or anxiety indices must be addressed. These can be explained by each finding circumscribing a unique connection between two or more brain regions. Hence, these connections serve a variety of subfunctions of the fear and/or anxiety circuits (i.e., fear conditioning, anticipatory anxiety) (Adhikari, 2014; Shin and Liberzon, 2010). Moreover, one should consider that the identified connections are based on a linear relationship between the anxiety or fear index and the FC of the SP group only. And since in the SBC analysis, there was no group effect, the same connections did not show any relationship between the indices and FC in the HC group. This observation seems reasonable because the HC group does not show a lot of variance in the fear and anxiety indices. Hence, we can assume that those connections exist in the HC but are not modulated by anxiety or fear during rest. In contrast, in SP, due to their apprehensive state and their hypervigilance toward a threat situation in the absence of a real threat during rest, these relationships can be measured.
Finally, the absence of group effects in the SBC and ROI–ROI analyses but not in the post hoc group comparisons is discussed. The [salience network − left and right paracingulate gyrus] (see Figure 2C, middle panel, top) and [salience network − left frontal pole] connection showed a group difference in mean peak-voxel FC values. One might wonder why this difference did not occur in the SBC or the ROI–ROI analysis. In our view, the different statistical tests lead to this discrepancy. The SBC analysis includes all grey matter voxels of the brain and must be corrected for false positives that would occur by chance only. Therefore, the FWE correction is applied, likely masking effects that might be true. On the other hand, our post hoc tests comparing differences in group FC were conducted using a Wilcoxon test that compares central tendencies of the two-group data without assuming normal distribution.
Demographic and clinical variables
Group comparisons in demographical and clinical variables showed the following differences: First, SP differed significantly in gender ratio compared to HC. This difference arises most likely because SP fear is more prevalent in women in our population (Bourdon et al., 1988). Various studies on phobia show that almost twice as many women suffer from phobias than men (Fredrikson et al., 1996; Oosterink et al., 2009). The gender difference is therefore according to our expectations and previous literature. To rule out an influence of the covariate “sex,” the covariate was tested for an effect on SBC and ROI–ROI FC data in both samples. As none of the significant/main effects relate to the striatum seed and vice-versa the covariate “sex” did not affect any other seed than connections with the striatum seed. Hence, in the SBC data, a gender confound is not likely. Likewise, no gender effect was present in the ROI–ROI analysis.
Second, SP showed increased fear and anxiety values in several assessed questionnaires (FSQ total, BSCL Anxiety subscore, STAI-trait and -state, and VAS pre- and post-MRI), but not in LSAS and BSCL total score when compared to HC. These differences in fear and anxiety values compared to HC indicate higher susceptibility toward other fear- and anxiety-related disorders in SP and are according to our hypothesis of increased levels of general anxiety as well as trait, state, and social anxiety in SP. Furthermore, previous studies have shown similar results in SP fear or other specific phobias (Eaton et al., 2018; Fraunfelter et al., 2022; Kimbrel, 2008).
Limitations
Concerning the limitations of this study, the accuracy of normalized ROIs must be addressed. Pre-existing and previously validated ROIs of the CONN toolbox and Avery et al (Avery et al., 2014) were applied to all participants after normalization. A previous study by Sohn et al. has found evidence of subject-specific variation among ROIs (Sohn et al., 2015). Therefore, to ensure complete subject-wise accuracy, especially in small brain areas such as the BNST, future studies should consider using subject-specific ROIs.
As a second limitation, the statistical power (0.55) must be addressed. While this may seem rather low, the use of 7T ultra-high field MRI provides substantial benefits. In their study, Torrisi et al. (2018) demonstrated that using 7T ultra-high field MRI significantly enhances statistical strength and power when compared to 3T MRI (Torrisi et al., 2018). This advancement allows for modifications in study protocols, such as smaller sample sizes or shorter scan durations. Therefore, this study’s power provides sufficient power to detect medium to large effect sizes. However, future studies should replicate our results by investigating larger sample sizes to gain greater statistical power (Lieberman and Cunningham, 2009).
Conclusion
Overall, this is the first 7T MRI study investigating the BNST and amygdala in SP and the findings suggest that alterations in FC in specific brain regions are associated with phobic fear, particularly the amygdala and BNST. These alterations may contribute to hypervigilance, difficulties in contextualizing fear-related stimuli in the external environment, and misinterpretation of such stimuli. The connection between the BNST and the HPA axis may perpetuate a chronic state of anxiety and elevated stress levels in individuals with phobic fear.
Footnotes
Authors’ Contributions
L.S., A.F., W.S., and M.G.: Responsible for the study concept and design. E.J., M.G., and A.F.: Contributed to the acquisition of data. E.J. and M.G.: Performed the analysis. E.J. and M.G.: Drafted the article. E.J., N.D., T.D., L.S., M.G., A.F., and W.S.: Provided critical revision of the manuscript for important intellectual content. All authors critically reviewed the content and approved the final version for publication.
Data Availability Statement
The data that support the findings of this study are available on request from the corresponding author. The data are not publicly available due to privacy or ethical restrictions.
Author Disclosure Statement
All authors declare that they have no conflicts of interest that are related to the research described in this article.
Funding Information
The study was funded by the
Supplementary Material
Supplementary Table S1
Supplementary Table S2
References
Supplementary Material
Please find the following supplemental material available below.
For Open Access articles published under a Creative Commons License, all supplemental material carries the same license as the article it is associated with.
For non-Open Access articles published, all supplemental material carries a non-exclusive license, and permission requests for re-use of supplemental material or any part of supplemental material shall be sent directly to the copyright owner as specified in the copyright notice associated with the article.