
Abstract
Background:
The brain’s function changes during various activities, and numerous studies have explored this field. An intriguing and significant area of research is the brain’s functioning during imagination and periods of inactivity.
Objective:
This study explores the differences in brain connectivity during music listening and imagination: by identifying distinct neural connectivity patterns and providing insights into the cognitive mechanisms underlying auditory imagination.
Methods:
Effective connectivity matrices were generated using generalized partial directed coherence (GPDC) and directed Directed Transfer Function (dDTF) methods applied to non-invasive electroencephalography data from these two conditions. Statistical tests were performed to illustrate the differences in brain connectivity, followed by the creation of brain graphs and the application of a non-parametric permutation test to demonstrate statistical significance. Data classification between listening to music and imagining it was performed using an Support Vector Machine (SVM) classifier with different feature vectors.
Results:
Combining features extracted from GPDC and dDTF achieved an accuracy of 71.3% while using GPDC and dDTF features individually yielded accuracies of 60% and 62.1%, respectively. Among all the graph’s global features, only modularity and small-worldness showed statistically significant differences in dDTF and GPDC. Overall, findings reveal that information flows from the left hemisphere to the right hemisphere increases during music imagination compared with listening, highlighting distinct neural connectivity patterns associated with imaginative processes.
Conclusion:
The study provides novel insights into the distinct neural connectivity patterns during music listening and imagination, contributing to the broader understanding of cognitive processes associated with auditory imagination and perception.
Impact Statement
This research provides a novel analysis of brain connectivity patterns during music listening and imagination using electroencephalography data, employing advanced techniques like generalized partial directed coherence and directed Directed Transfer Function. The findings reveal distinct neural connectivity differences between these cognitive states, enhancing our understanding of imaginative processes. By highlighting specific brain regions involved, this study paves the way for further research in cognitive neuroscience and potential applications in neurorehabilitation and brain–computer interfaces. These insights could significantly influence approaches to studying brain connectivity and developing new interventions for cognitive and neurological disorders.
Introduction
The study of the brain has always been of considerable importance in the history of science. In the past, however, structural analysis of the brain has received more attention, and understanding of the behavior and function of the brain are more significant today. To investigate the brain’s function, one of the main interesting approaches is to study brain connectivity. From this perspective, three types of connectivity are structural, functional, and effective (Sporns, 2022). In functional connectivity analysis, the functional relation between brain regions is investigated, and there are no obligations that the regions are connected anatomically. An effective connectivity analysis evaluates the types of relation (sender or receiver in information flow) (Cao et al., 2022). Brain connectivity analysis has become very popular and widely used in different approaches. One of the main ones is exploring the effects of diseases on brain connectivity, such as epilepsy (Royer et al., 2022), autism (Cociu et al., 2018), and other neurodegenerative diseases (Pievani et al., 2014). Investigation of aging by brain connectivity is also of great interest (Vecchio, 2021). Exploring connectivity variations during the progression of neurological diseases such as Alzheimer’s Disease (AD) is also of great interest in the literature (Ahmadi et al., 2022; Ahmadi et al., 2020). Also, modified methods were employed to analyze brain connectivity (Ahmadi et al., 2021a). Another recent study has focused on the brain connectivity of the dying brain, which is novel (Blundon et al., 2022). Wang et al. (2020) introduced brain biometric identification utilizing connectivity analysis, and the results exhibit improvement in recognition rate.
There are various methods to study the brain. One of the non-invasive, prominent, and most prevalent is electroencephalography (EEG). EEG is the recording of the brain’s electrical activity from the scalp by employing surface electrodes (Gavaret et al., 2023). EEG has been widely used in brain connectivity analysis (Chiarion et al., 2023; Wang et al., 2020; Wu et al., 2023; Coronel-Oliveros et al., 2024) and also in different groups such as attention deficit and hyperactivity disorder and autism (Salehi et al., 2022; Talebi and Motie-Nasrabadi, 2022). Zhang et al. (2017) investigate the effective connectivity from EEG data to explore the impact of emotions on effective connectivity patterns. Results demonstrate that there are more interactions under negative emotions in comparison to positive ones. Also, the prefrontal areas assume the main part in emotion processing. In reference (Aydın and Onbaşı, 2024), the authors explore distinct neural circuits involved in the emotions of fear and anger using EEG data. Utilizing long short-term memory networks and logistic regression modeling, the research achieves a classification accuracy of 91.79% for these emotions and identifies specific brain connectivity patterns associated with each emotion. Maggioni et al. (2021) investigated the effective connectivity during music listening and resting state in patients who have Parkinson’s disease. According to the results, the information flow was diminished in the EEG intra-networks while increasing activity. A study (Mahmood et al., 2022) explores the effect of music listening on EEG functional connectivity. To perform a comprehensive study, different lobes are analyzed separately, and the EEG is decomposed into different frequency bands. According to statistical tests, listening to relaxing music strengthens the connection’s strength and increases functional connectivity in the frontal lobe. Functional connectivity decreases in the beta band while it increases in the alpha and theta frequency bands. These findings confirm that relaxing music provides alertness, relaxation, and activeness. Another study (Chakladar and Pal, 2024) investigates brain connectivity networks for face perception using EEG. An algorithm selects optimal EEG channels, and multi-variate transfer entropy maps effective connectivity. Brain dynamics are analyzed with global efficiency (GE) measures, yielding mean GE scores of 0.800, 0.695, and 0.581 for the respective face stimuli.
Another interesting study (Tanaka and Kirino, 2019) focused on the functional connectivity of the angular gyrus. They compared the imagination of music performance and resting-state conditions. Results demonstrate that the functional connectivity was increased, and the anterior cingulate cortex and superior temporal gyrus were engaged newly while imagining music performance compared with the available connections in the resting conditions. Also, several connections were eliminated during the task. Accordingly, they have concluded that the angular gyrus functional connectivity is affected by music performance imagination. In reference (Watanabe et al., 2020), the authors classified the imagined speech, reached 38.5% accuracy, and mentioned that it is significantly higher than the rate of change (33.35). In a recent study, Marion et al. (2021) investigate the effects of imagined music utilizing EEG data of musicians. Results indicate that listening and imagery assignments evoked a covering yet particular topology of brain reactions to sound. A study (Eskine, 2023) explores how listening to music affects brain networks. Using 128-channel high-density EEG, the researchers measured resting-state brain activity in 26 participants before and after music exposure. Results showed increased activation in the default mode, cognitive control, and salience networks, indicated by higher spectral frequency power in whole-brain beta, parietal theta, and whole-brain gamma bands, supporting the theory that music enhances creative cognition by activating key brain networks. Recent research (González et al., 2024) analyzes EEG connectivity networks in expert cellists during rest and while interpreting tonal and atonal music, both real and imagined. It finds global desynchronization and increased local information-transfer efficiency, especially during imagined interpretation of atonal music. Significant differences in brain connectivity patterns between tonal and atonal interpretations suggest cognitive and perceptual variations influenced by musicians’ training and brain plasticity.
While extensive research has explored brain activity patterns during various cognitive and emotional tasks, the neural dynamics of imagination remain relatively underexplored. Imagination is a fundamental cognitive process, yet the specific brain connectivity changes that occur during auditory imagination, such as imagining music, are not well understood. This gap is significant because understanding how the brain orchestrates neural activity during imagination could have broad implications for cognitive neuroscience, especially in fields related to creativity, memory, and auditory processing. This study addresses this gap by comparing effective brain connectivity during two distinct cognitive states: listening to music and imagining it. Using EEG data and employing generalized partial directed coherence (GPDC) and directed Directed Transfer Function (dDTF) methods to uncover distinct neural patterns and information flow, providing novel insights into the unique connectivity changes that accompany auditory imagination. The graph theory methods have been utilized to construct effective connectivity matrices, allowing to discern differences between these two cognitive states. A key novelty of the presented research is its goal approach, investigating data from multiple subjects rather than focusing on single ones. This enables a more robust and generalizable understanding of brain connectivity patterns. Moreover, the utilization of feature vectors for classification procedure addresses an advancement over existing methods in the literature.
The rest of the article is structured as follows: the second section belongs to Materials and Methods. The database, pre-processing steps, and the employed tools are introduced. The Results section provides the outcomes and uses tables and figures for better understanding. In the Discussion section, the results are discussed and explored. Finally, the research is concluded in the last part.
Materials and Methods
The flowchart in Figure 1 illustrates the process of conducting the research.

The flowchart of the study. dDTF, directed Directed Transfer Function; EEG, electroencephalography; GPDC, generalized partial directed coherence.
EEG data
Music imagery information retrieval (Stober et al., 2015) is a public EEG dataset for music perception and imagination. There are 10 subjects (3 male and aged 19–36) who listened to and imagined 12 music pieces (the mean length of each track is about 10 sec) and had no history of brain injury. The participants have opted to form a homogenous database through Goldsmith’s Musical Sophistication Index and clarity auditory imagination scale. EEG was recorded by a BioSemi Active-Two system with 64 + 2 EEG channels at 512 Hz. The recording procedure consists of two steps, each containing five blocks. In one block, all 12 pieces were played in randomized order. They can take breaks between the blocks. The other four conditions were as follows: “(a) Stimulus perception preceded by cue clicks (b) Stimulus imagination preceded by cue clicks (c) Stimulus imagination without cue clicks (d) Stimulus imagination without cue clicks, with feedback.” Finally, each subject had 240 trials (12 stimuli × 4 conditions × 5 blocks). The design of the recording is depicted in Figure 2.

The study chart for EEG recording (Stober et al., 2015).
Pre-processing
As mentioned in the database, the raw data had noise and needed to be cleaned before any other processing. First, A high-pass filter with a 1-Hz cutoff frequency is used to eliminate the DC component of the signals. For the rest, the EEGlab toolbox (Delorme and Makeig, 2004) is employed. Using artifact subspace reconstruction tools in EEGlab, the data are denoised and the several channels in each subject (0–5 for each participant) are eliminated due to the high noise level. It is worth mentioning that the removed channels are interpolated using the interpolate electrodes section, and, finally, each subject’s data contains 64 filtered EEG channels.
Independent component analysis (ICA) is used for blind source separation. ICA plays a principal role in EEG analysis for identifying the local distribution of effective connectivity networks. Utilizing the ICA section, brain-independent sources are extracted. The default numbers of components are equal to the number of channels (Debener et al., 2010). Then, using the adjust plugins, the sources that do not correspond to the brain activity are eliminated. Usually, these sources contain artifacts such as muscular, eye blinking, and movement. The number of removed sources is 2–12 in each subject. The flowchart of the pre-processing procedure is depicted in Figure 3.
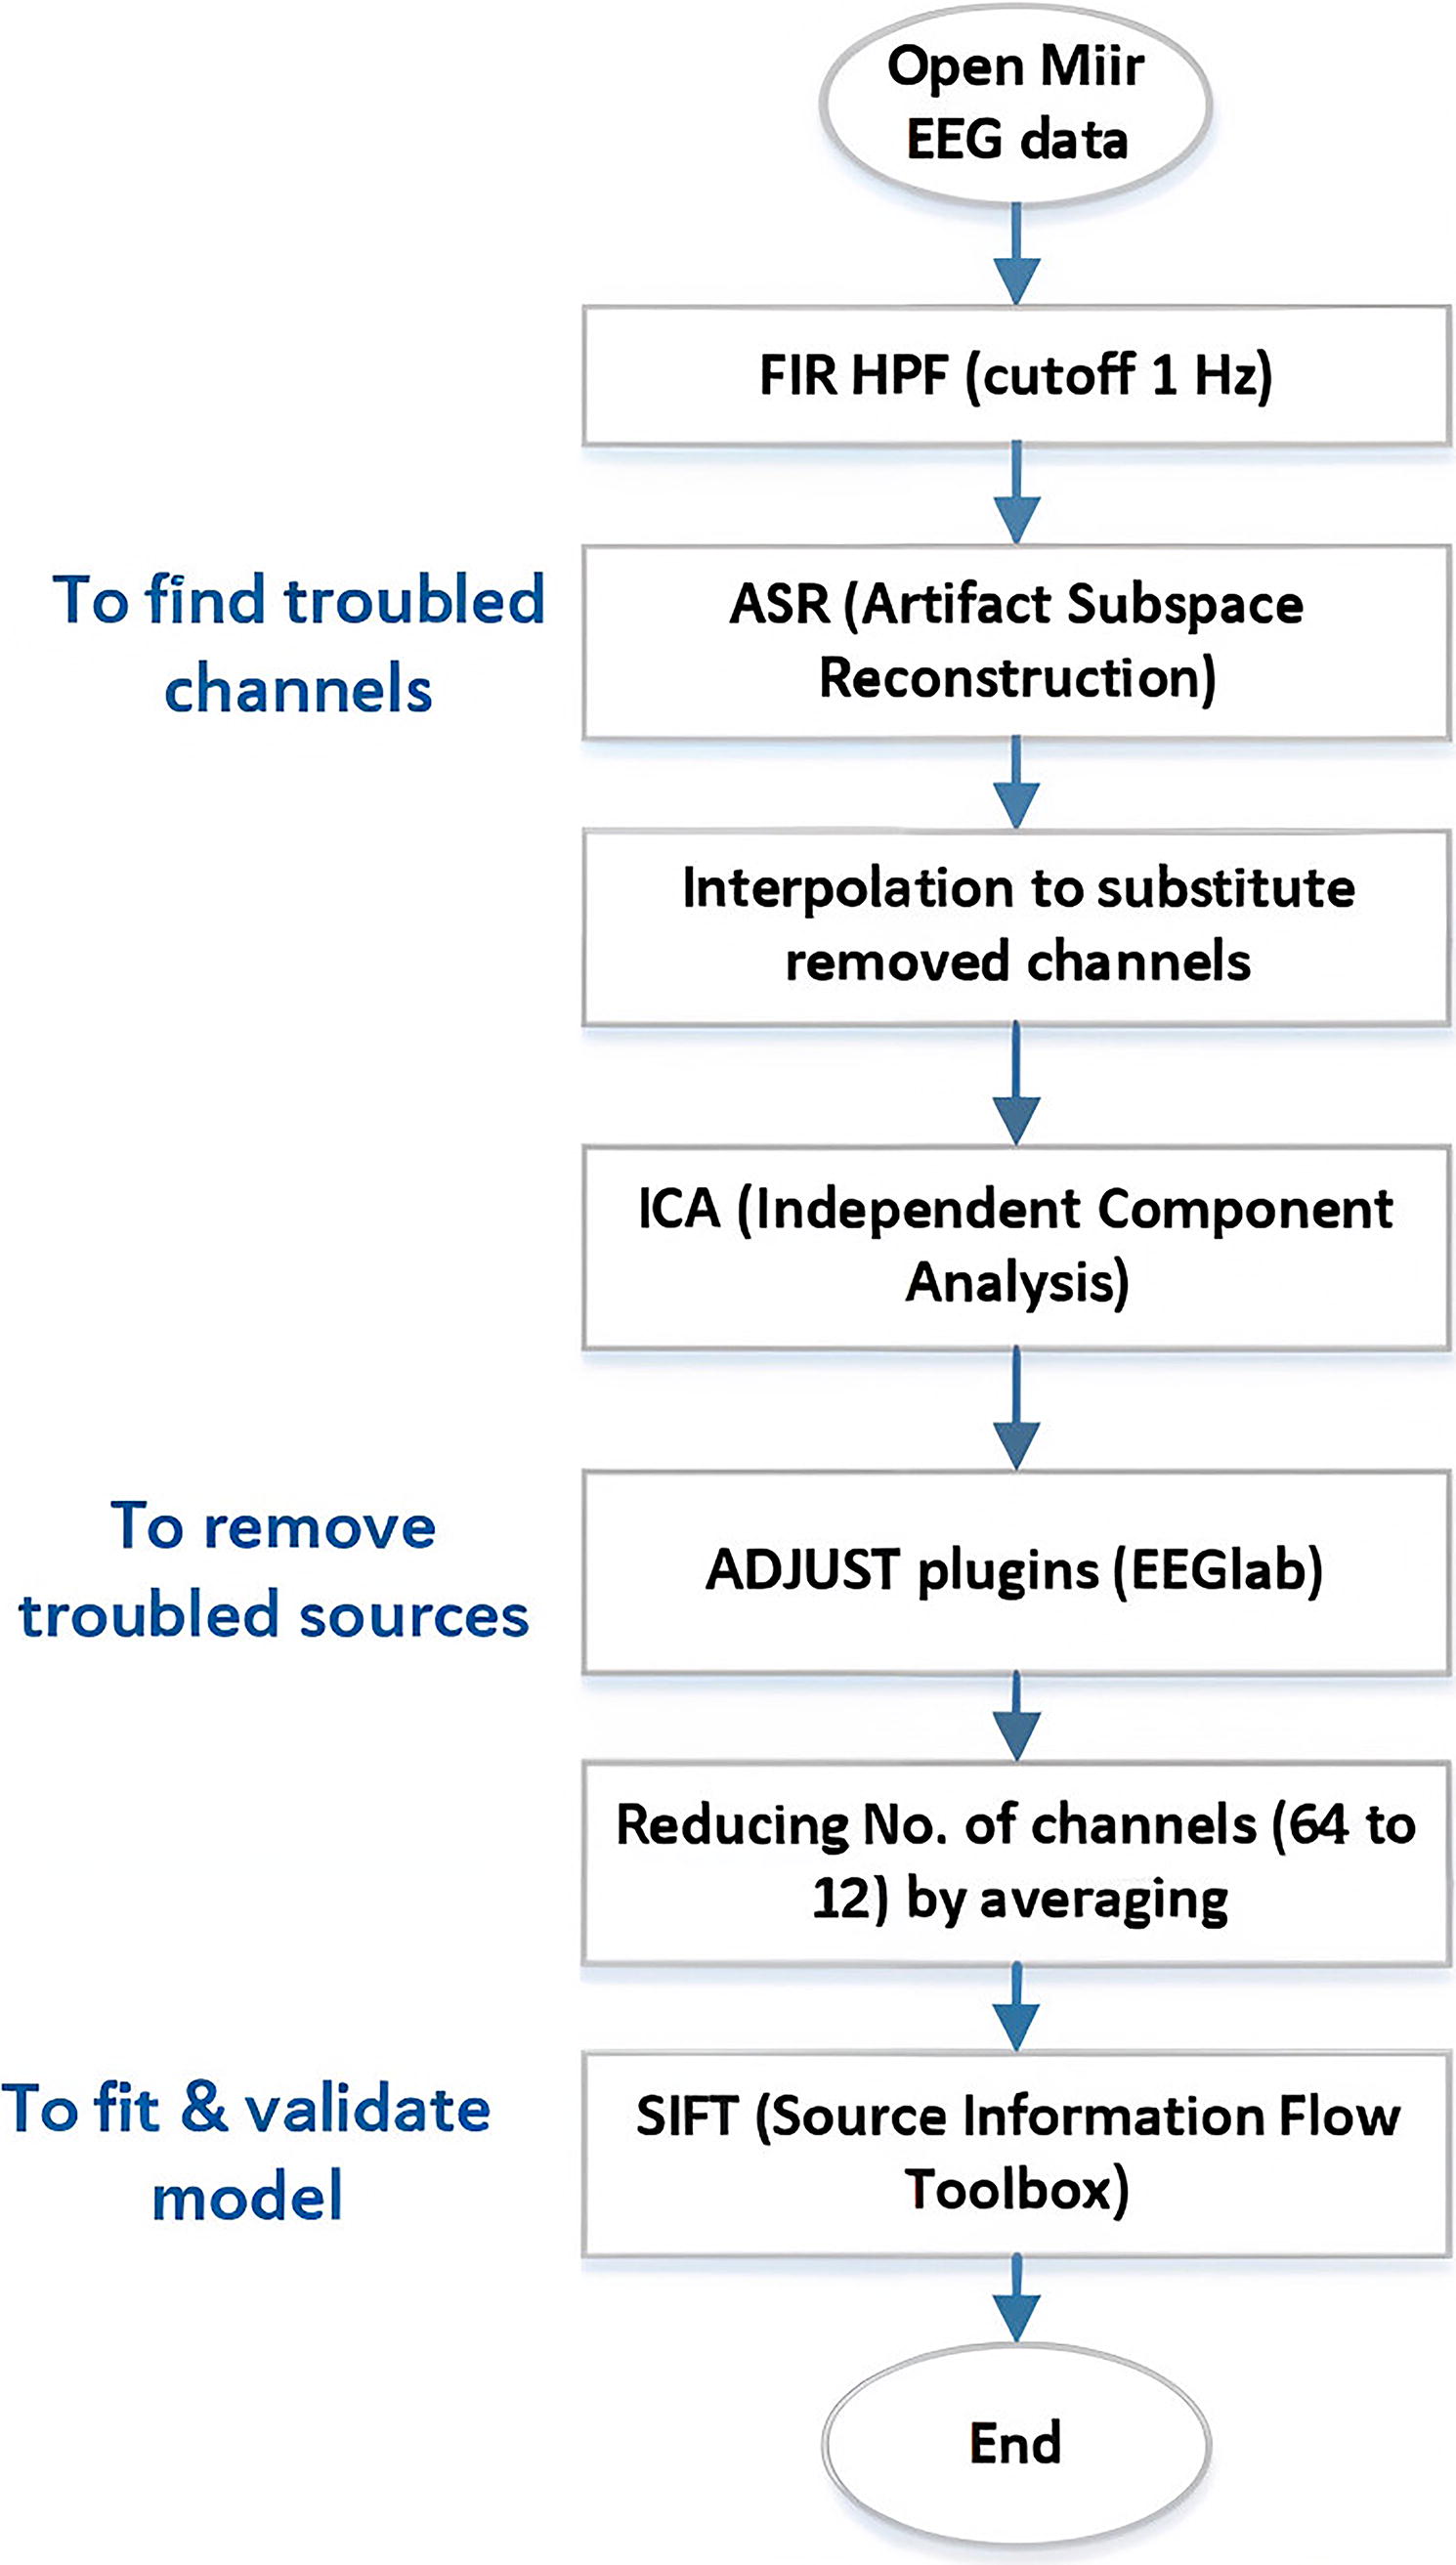
The flowchart of the pre-processing procedure. EEG, electroencephalography; MIIR, music imagery information retrieval.
Investigation of effective connectivity among 64 channels is too complicated; accordingly, for further analysis, the number of channels is diminished to 12 by averaging several channels located in the neighborhood. The brain topology for channel reduction is demonstrated in Figure 4.

The map for channel reduction.
Connectivity matrix
By employing the Source Information Flow Toolbox, dynamical interactions are obtained (Mullen, 2010). A multi-variate autoregressive (MVAR) model is fitted to the data. The Vieira-Morf algorithm was employed to estimate the MVAR model parameters. For model order selection, the Hannan–Quinn criterion was applied. The minimum and maximum model orders were set to 1 and 30, respectively, and the final model order was determined to be 10. This order was selected to ensure that the residual noise of the model is white, indicating that the model adequately captures the dynamics and provides meaningful connectivity information (Mullen, 2010).
Two approaches are employed for effective connectivity calculation, including dDTF and GPDC. GPDC and dDTF are selected due to their ability to handle volume conduction and provide clear directional information about neural interactions. This is crucial for effective connectivity analysis in EEG data. Specifically, dDTF offers true direct connections, focusing exclusively on direct interactions between brain regions. On the other hand, GPDC normalizes by the power of the noise, allowing for a more refined analysis. These methods offer complementary insights into the flow of information between brain regions, making them ideal for distinguishing cognitive states (Chiarion et al., 2023). DTF is used to compute the direction and frequency content of brain activities. In this method, the EEG transfer function is obtained based on autoregressive models, and the elements of the matrices are normalized to optimally express the diffusion direction and spectrum characteristics of the signal. The DTF formula is shown in Eq. (1):
The PDC is calculated as follows:
Accordingly, GPDC has added the normalized variance to overcome this issue as follows:
After calculating the dDTF and GPDC, the data are decomposed into sub-bands, including delta (1–4 Hz), theta (4–8 Hz), alpha (8–13 Hz), beta (13–30 Hz), and gamma (30–40 Hz).
To summarize the data for further analysis, please note that there were 10 subjects. Each listened and imagined 12 music pieces (it means 24 conditions). The channels were reduced to 12, so the connectivity matrices were 12 × 12 and separated into five different frequency bands.
Wilcoxon statistical analysis
Wilcoxon is a non-parametric statistical test applied without the assumption of Gaussian distribution of the data. The goal of the test is to compare the numbers of two states, which belong to identical populations. Three conditions should be considered to ensure utilization of the Wilcoxon test: (1) the dependent variable was measured continuously, (2) independent variables consisted of two groups with the same participants, and (3) the populace dispersion of the distinction scores is symmetric (McCrum-Gardner, 2008).
The Wilcoxon test is implemented in this study in each frequency band and both GPDC and dDTF methods. The results are five matrices (five frequency bands), each of which is 12 × 12 (number of channels). The elements of the matrices are p-values that demonstrate the differences between imagination and listening to music. In other words, p-values show whether two states (imagination and listening) are substantially different by employing a statistical test. The significance level is considered 5%.
Graph theory
In recent years, graph theory has been widely utilized in brain connectivity analysis. In brain networks, the graph nodes correspond to brain regions of interest, and edges represent structural, functional, or effective connections (Sporns, 2018). In the present study, the reduced EEG channels (12 ones) are graph nodes, and the effective connectivity calculations (GPDC and dDTF) between each pair of channels are the links of the graphs. After generating the graphs, several features are computed to exhibit the brain network characteristics. Usually, the features display the brain’s functional integration and segregation and are divided into global and local features. The graph features that are computed in the present study and the formulation are presented in Table 1.
Graph Features, Explanation, and Formulas a
Ahmadi et al. (2021).
In Table 1, the graph is introduced by G = (V, E) where G are the nodes and E are the edges. Also, dG
(x, y) is the distance between the x and y. n and l are the numbers of nodes and links, respectively. GFC
corresponds to a fully connected graph, and Ax,y
is the connectivity matrix. The C
r and L
r correspond to an equivalent random network. δx,y
is 0 if the two vertices are from one community. The average efficiency of a graph is
Braph toolbox (Mijalkov et al., 2017) is employed for brain network analysis and computations of features. While GPDC and dDTF provide robust measures of directional connectivity, additional graph metrics were incorporated to assess the overall network properties. This combined approach allows for a more complete analysis of both the directional flow of information and the brain’s global connectivity structure. The use of these complementary measures ensures that both the specific and broad aspects of brain connectivity are captured, offering a deeper understanding of the neural dynamics involved in music listening and imagination.
Permutation statistical test and SVM classifier
The non-parametric permutation test (Nichols and Holmes, 2002) is employed to statistically analyze features between listening to music and imagination in each frequency band. In addition, classification is done by an Support Vector Machine (SVM) classifier. SVM is a reliable classifier that uses linear and non-linear kernels to classify the data. Such a classification method attempts to select a line with the maximum confidence margin. The training samples nearest to the decision boundary (support vectors) define the decision boundary equation (Suthaharan, 2016). Based on the features, the data are divided into two groups (listening and imagination) to find out how the brain network features are different in listening and imagination. Seventy percent of the data is used for the training and the rest for the test phases. Also, 10-fold cross-validation is performed to evaluate the classification process.
Results
After pre-processing and fitting the Vieira-Morf VAR model, the effective connectivity matrices are generated utilizing GPDC and dDTF algorithms. Consider that the data were decomposed into five sub-bands delta (1–4 Hz), theta (4–8 Hz), alpha (8–13 Hz), beta (13–30 Hz), and gamma (30–40 Hz). The results were averaged among all subjects (10 subjects) in all 12 music pieces. There were 12 EEG channels, and consequently, there were 144 effective connectivity links (12 × 12). First as a sample, the effective connectivities in the delta band by the GPDC method are shown in Figure 5 (there are two methods, each containing five different sub-bands). For better demonstration, the 10 strongest edges are drawn. In addition, the arrow corresponds to the receiver and the thickness corresponds to the strength of the connection. Brainnet Viewer (Xia et al., 2013) is used for illustration.
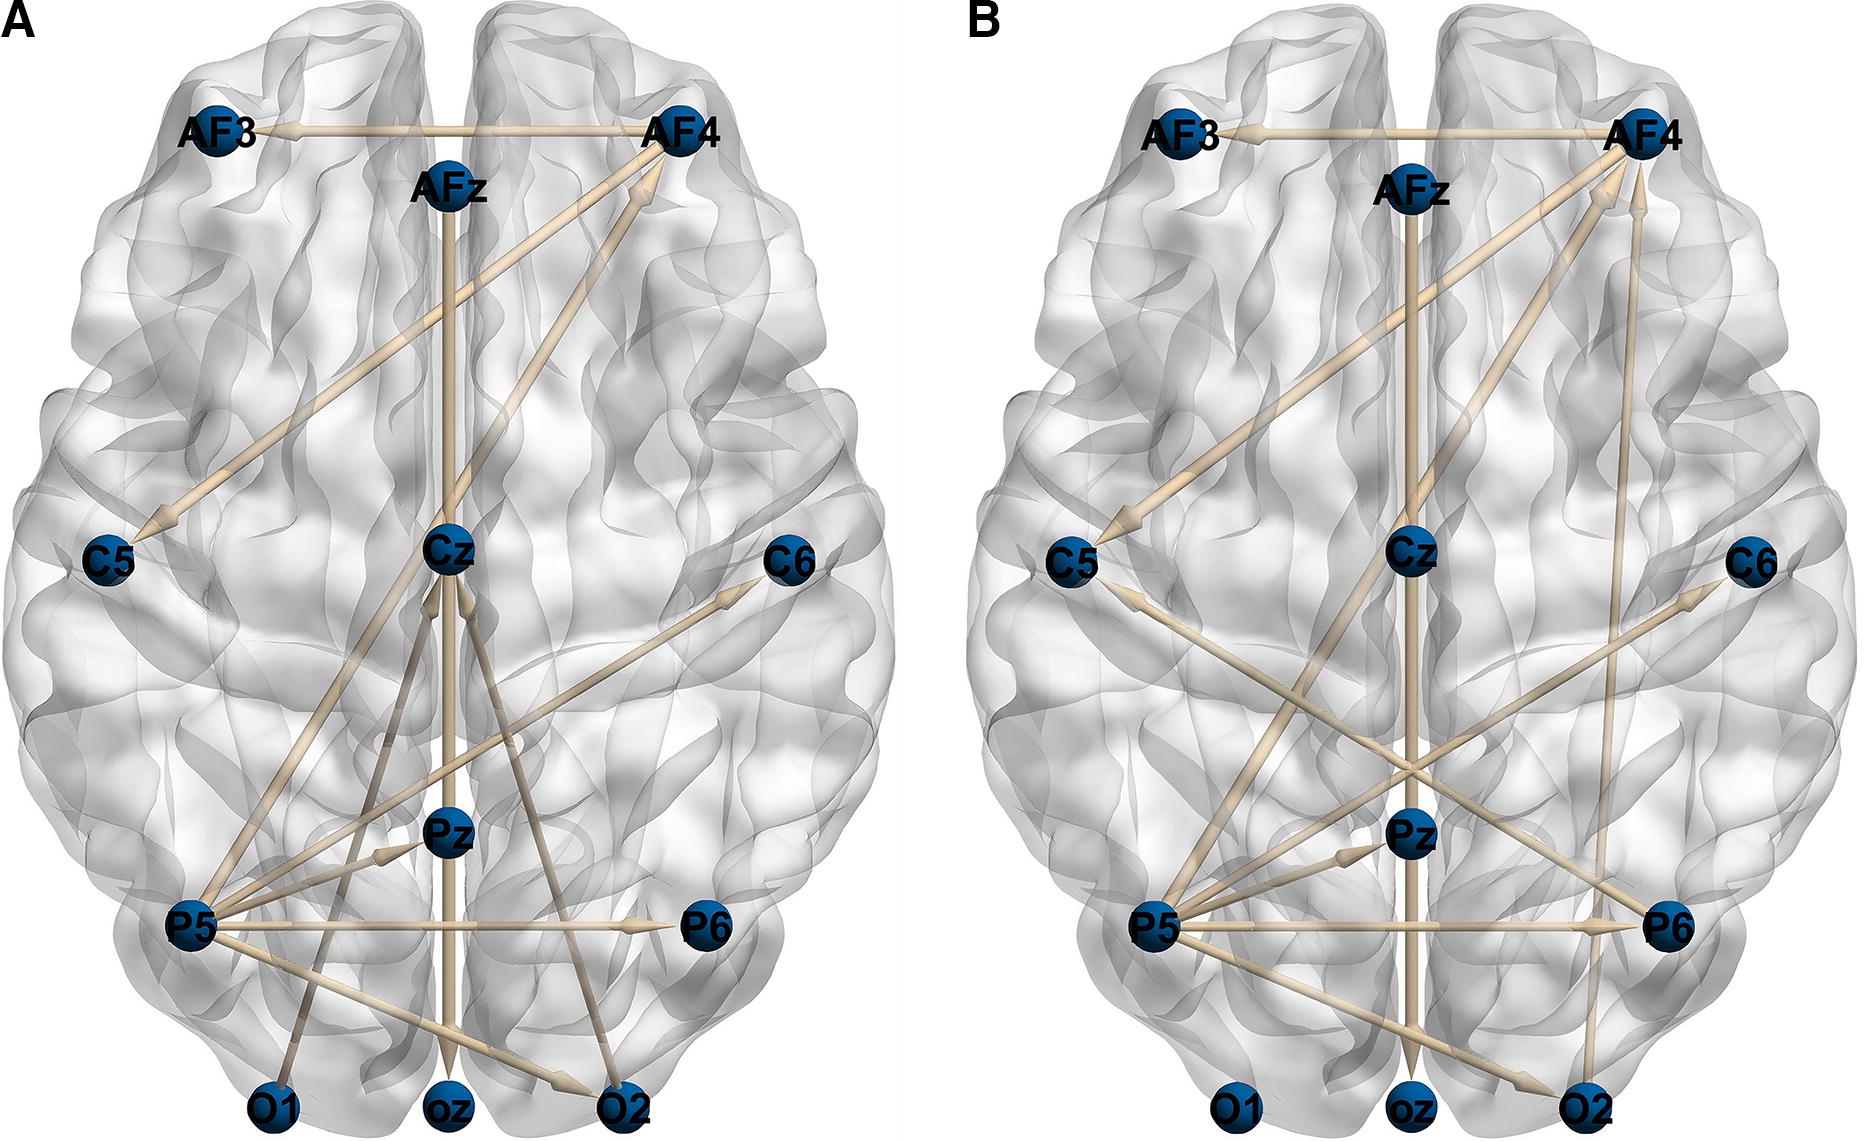
Ten strongest effective connectivities in delta band by GPDC method. Listening to music (left) and imagining music (right). GPDC, generalized partial directed coherence.
As depicted in Figure 5, when listening to music, the flow of information to the central part of the brain is greater, and the most active part in sending information is the left parietal region. During music imagination, the left parietal part is highly active, and information flows from the P6 area to the C5 area. Also, the highest rate of sending information in both modes is related to the connection of the AFZ area to the OZ.
In the following, the Wilcoxon statistical test is implemented in each frequency band and both connectivity matrices (GPDC, dDTF). As many statistical tests were performed, a false discovery rate was employed to ensure the results. Table 2 shows significant differences in the alpha frequency band using the GPDC method (there are two methods and each contains five different sub-bands, so there are nine more tables).
Wilcoxon Statistical Results (p-Values) in the Alpha Frequency Band and GPDC Method
The significant p-values (≤%5) are bold.
GPDC, generalized partial directed coherence.
According to Table 2, in 16 connections, statistically significant differences are observed. Channels P5 and AF3 demonstrate the most significant differences. Since there are five frequency bands in each method (10 Tables), to summarize and facilitate, the results are shown in the form of figures and just the edges in which statistically significant changes are drawn (Fig. 6).

The connections that show significant differences (the bold numbers in Table 2).
Wilcoxon statistical test in the dDTF method reveals no significant changes in the theta and beta frequency bands. Delta frequency band reveals that the AF3 and C6 have the most significant changes. Alpha and gamma, respectively, show significant changes in AF3 and C6. In imagining the music, the flow of communication from the left occipital region to the right temporal region in theta, delta, and beta bands increases as in the state of listening to music.
In the GPDC method, the Wilcoxon statistical test shows no significant changes in the theta and beta frequency bands. PZ and P5 demonstrate the most significant changes in the delta frequency band. In the alpha frequency band, AF3 and P5 demonstrate the most significant changes. No region shows more than two significant changes in the gamma frequency band. In the state of imagining music, the flow of communication from the left side of the brain to the right side increases compared with listening to music. The brain graph is generated using GPDC and dDTF methods for further analysis. Then the graph features are calculated, and the non-parametric permutation test is computed to compare the listening and imagination brain networks. Table 3 indicates the results. The features that expressed statistically significant differences are presented in the table.
Permutation Test Results (p-Values)
The significant p-values are demonstrated in the table.
dDTF, directed Directed Transfer Function; GPDC, generalized partial directed coherence.
According to Table 3 while the dDTF shows differences in four frequency bands, the performance of both dDTF and GPDC methods to discriminate the listening and imagining music is approximately the same. Alpha and theta frequency bands in both methods display differences. It can be considered that listening to music and imagining it shows the differences in these frequency bands. Modularity is the feature that exhibits differences. This feature reflects the degree to which brain networks are divided into sub-networks, therefore, the brain uses different modules when it listens to music compared with when it imagines the music.
The feature vectors are created and employed for classification by using the features that exhibit statistically significant differences. SVM classifier is used to classify the data into two groups (listening and imagination). Once the GPDC features and dDTF are employed individually, the combination is used. The results are depicted in Table 4. Also, the samples of Receiver Operating Characteristic (ROC) curves of different states are shown in Figure 6.
Classification Result
dDTF, directed Directed Transfer Function; GPDC, generalized partial directed coherence.
According to Table 4, although the results of the two methods are approximately the same, the performance of dDTF is a bit higher compared with the GPDC method. Results show that the combination of the methods boosts the classification outcome (Fig. 7).
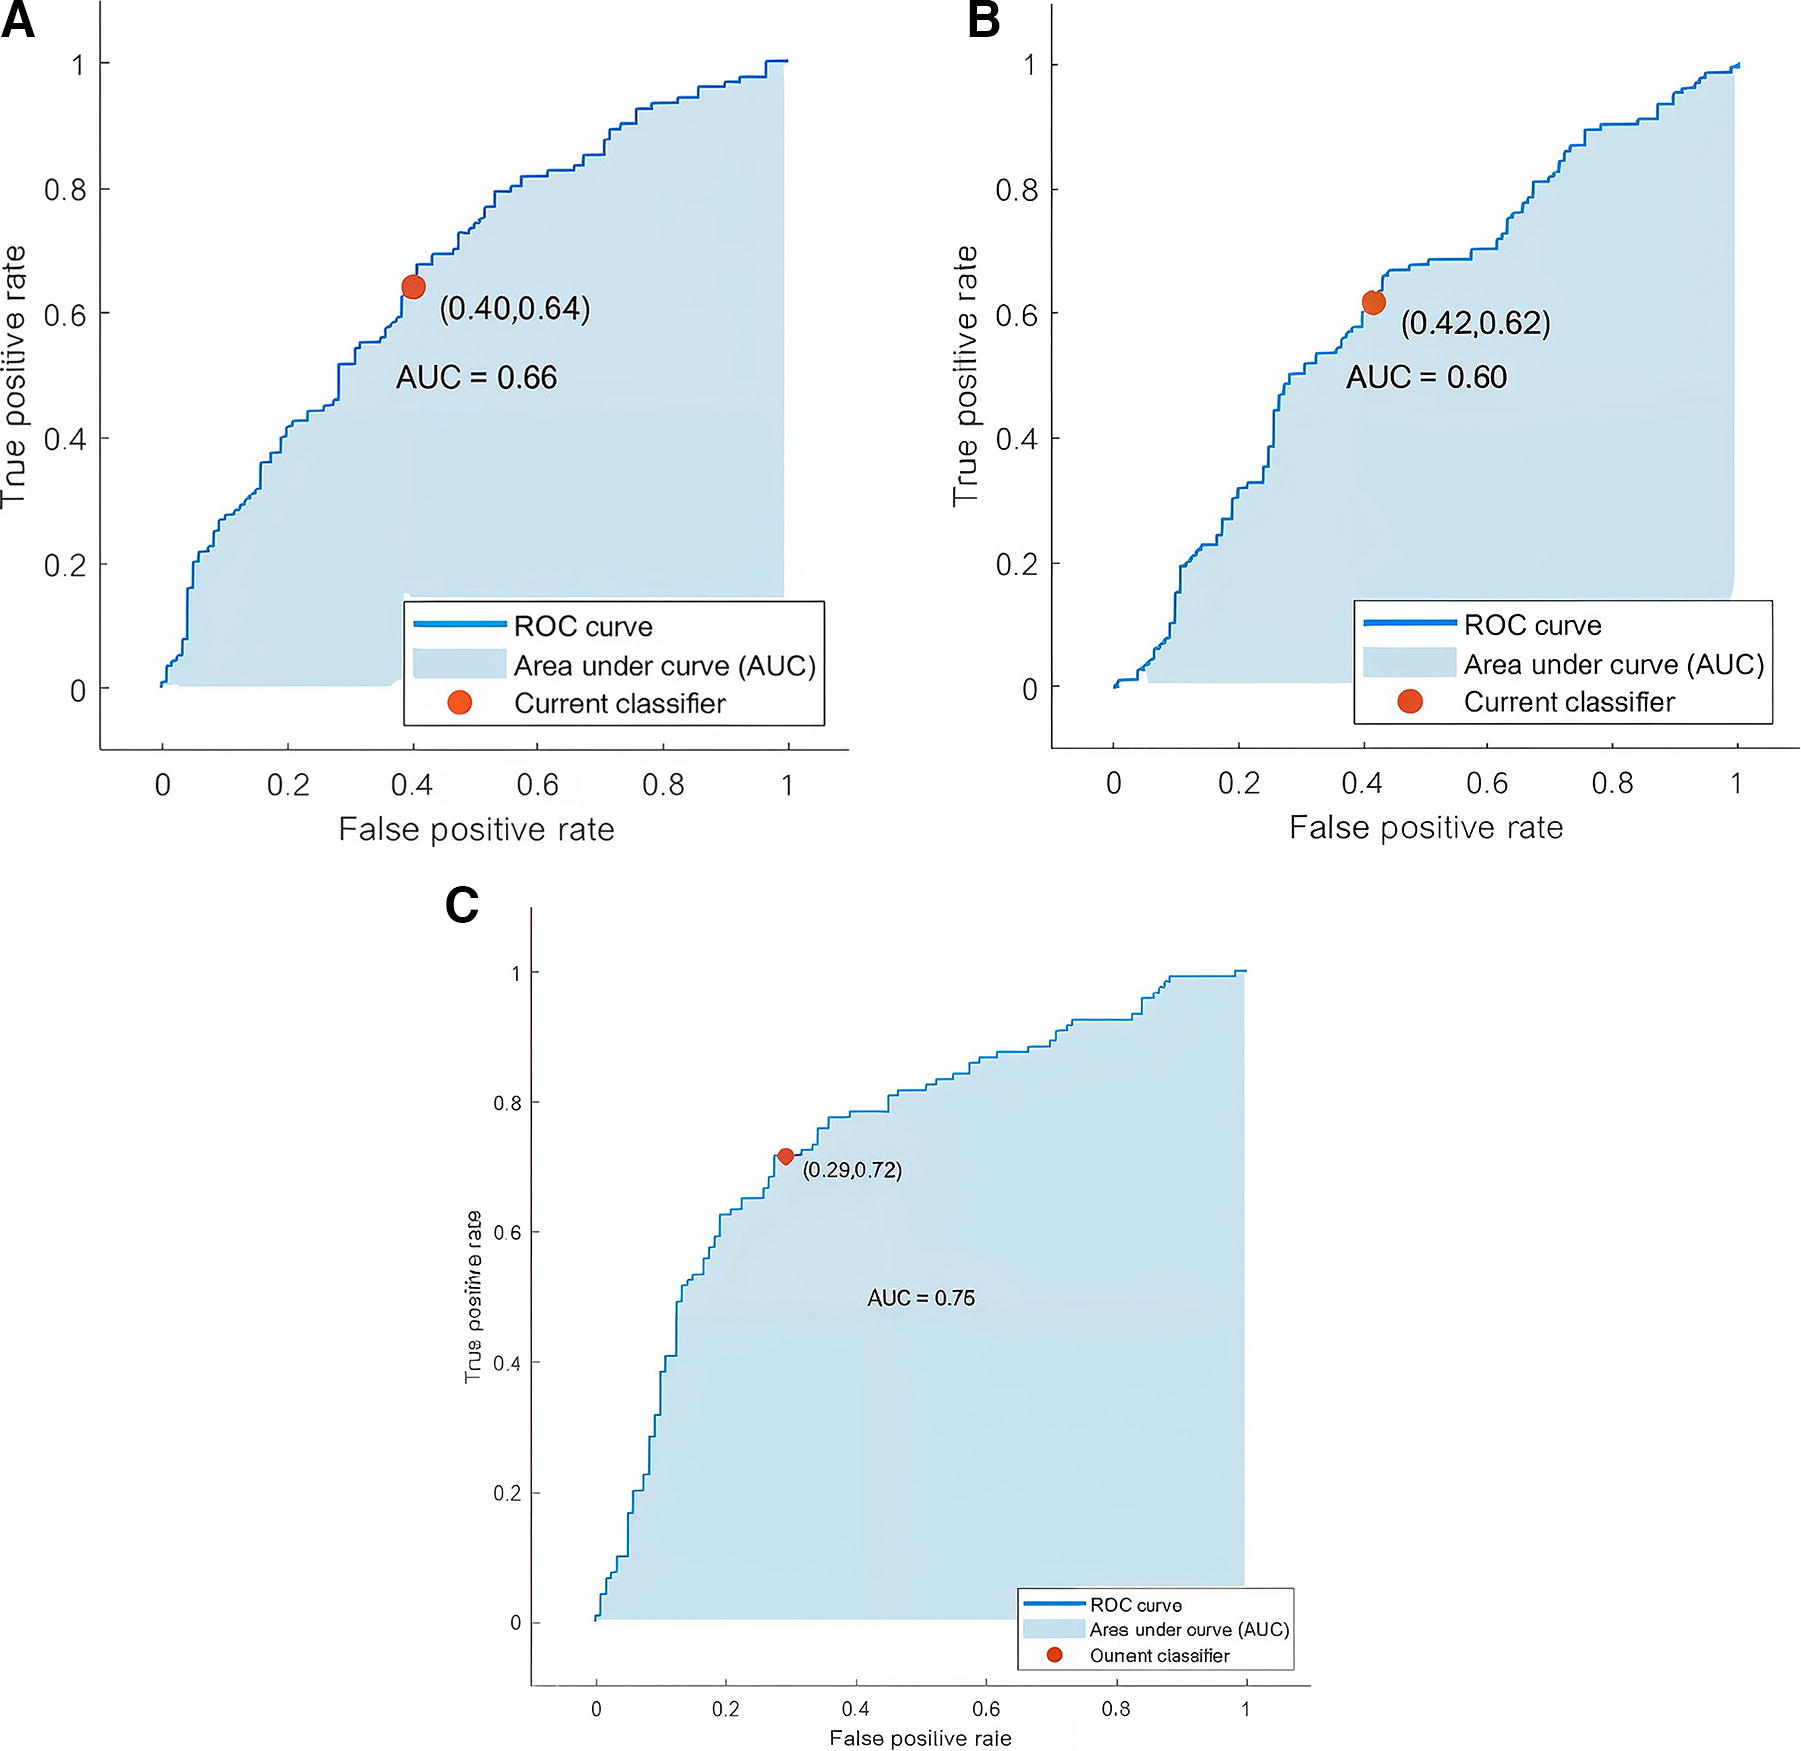
The sampled ROC curves.
Discussion
In addition to the main tasks of the brain, such as movement control of the arms and legs, the brain is capable of controlling thoughts, cognitive tasks, memory, etc. Many studies have focused on brain function when listening to music or seeing pictures and landscapes. A critical yet underexplored question is how brain function changes during imagination. Does the brain have a different mechanism and function in listening to and imagining music? In the present study, this question was investigated. Using EEG data of the subjects who listened to music and imagined it, the effective connectivity networks of the brain are explored. It is worth mentioning that since the connectivities between regions are investigated, the whole EEG data are employed; otherwise, the study could be conducted on specific regions corresponding to listening in the brain. Two different approaches, including dDTF and GPDC, are applied and the Wilcoxon statistical test is implemented to identify whether listening to music and imagination presented a statistically significant difference in different frequency bands.
Moreover, brain graphs were generated, and global features were calculated. The non-parametric permutation test is employed to discriminate features that exhibit significant statistical differences. Then feature vectors are generated by these features from both approaches, and classification is done between listening and imagining by the SVM classifier in three cases. Classification results indicate that combining features extracted from GPDC and dDTF achieved an accuracy of 71.3%. When used individually, GPDC features yielded an accuracy of 60%, while dDTF features achieved 62.1%. It confirms that the brain’s effective connectivity networks vary in listening to and imagining music. Modularity and small-worldness indicate statistically significant differences in dDTF and GPDC among all the graph’s global features. Besides, modularity shows more significant changes in different frequency bands. Also, the theta frequency band demonstrates the most significant changes compared with other frequency bands. In the GPDC method, the Wilcoxon statistical test reveals no significant changes in theta and beta frequency bands, while other frequency bands display significant changes. This finding is consistent with the results obtained using the dDTF method.
Consequently, theta and beta frequency bands have no statistical differences in music listening and imagining. dDTF shows the most significant statistical differences in AF3, AF4, and AFZ, all of which belong to the frontal area, while GPDC presents no specific pattern. Overall, the results obtained from dDTF and GPDC methods showed that brain connections in theta and beta bands did not have any significant differences in the two modes of listening and imagining music in any brain region. In the GPDC method, the most significant changes are in the delta and alpha bands, and dDTF methods correspond to the delta and gamma bands. On the other hand, information flow in music imagination is increased from the left occipital to the right temporal compared with music listening. In general, information flow from the left hemisphere to the right hemisphere increases when imagining music.
The results of this study offer significant contributions to the understanding of brain connectivity during auditory imagination and music listening, expanding upon the existing body of knowledge in several key areas.
First, by comparing the effective connectivity between these two cognitive states, this study provides new insights into how the brain orchestrates information flow during imaginative processes. These findings suggest that imagination engages different and more extensive neural networks, particularly in terms of inter-hemispheric connectivity, which has been demonstrated to be more pronounced during imagination than listening.
In addition, the use of both GPDC and dDTF methods to capture directional connectivity is a key strength of this research. These methods allow for a detailed examination of the directionality of neural interactions, revealing that the flow of information from the left hemisphere to the right hemisphere increases during imagination. This finding aligns with studies on brain lateralization, particularly those focused on creative and imaginative tasks, and extends the understanding of hemispheric specialization in auditory imagination.
Moreover, the inclusion of graph metrics such as modularity and small-worldness enhances the understanding of the brain’s global connectivity patterns during these tasks. While the directional features of effective connectivity highlight specific pathways of information flow, the graph metrics provide a broader view of how the brain’s network structure supports these processes. This combined approach allows for a more comprehensive analysis of brain connectivity, offering both detailed and generalized perspectives on neural interactions.
The originality of this research lies in its dual-focus approach, which not only examines the directional aspects of connectivity but also considers the overall network properties, providing a holistic view of brain function. The findings contribute to the literature on cognitive neuroscience by offering a deeper understanding of the neural mechanisms that differentiate imagination from perception, and they open new avenues for exploring how these processes can be harnessed in practical applications, such as neurorehabilitation and brain–computer interfaces.
Conclusion
The presented study investigated brain-effective connectivity networks while subjects listen to music or imagine it. EEG data and two approaches for effective connectivity analysis, including dDTF and GPDC, were employed. According to Wilcoxon and non-parametric permutation statistical tests and SVM classifier, brain mechanisms, and functions are not completely identical in listening and imagination. Information flow in imagination is increased from the left hemisphere to the right, especially from the left occipital to the right temporal. Although information flow and statistically significant connections in different frequency bands are not exactly the same, AF3, PO6, C6, AFZ, P5, AF4, and OZ contain the most significant connections. The main advantage of dDTF and GPDC methods is their robustness to the brain’s volume conduction effects. This characteristic eliminates the need to solve the reverse problem to retrieve active brain resources. In this study, graph features have been employed for further studies extracting features from signals in addition to the graph features proposed. Also, investigating the differences in each subject and different music genres is recommended. It is worthwhile mentioning that debates exist regarding the accuracy of connectivity analysis in sensor space due to volume conduction. However, sensor space remains widely used in EEG studies for effective connectivity, particularly because of its computational efficiency and ability to capture general brain interaction patterns. The sensor space is consistent across individuals, whereas moving to source space could introduce variability in sources between subjects, leading to additional complexities and potential problems. Future research may benefit from applying source space analysis to refine the understanding of cortical interactions and provide more localized insights, but such analyses may come with challenges related to source localization and the inverse problem.
Footnotes
Authors’ Contributions
A.M.-N. supervised the study and conceptualized the idea. He is also responsible for the validation, review, and editing of the article. K.F. performed the formal analysis, implemented the methodology, and conducted the investigation. H.A. contributed to the software development and analysis, as well as validation. He also wrote the original draft.
Disclaimer
The authors, K.F. and H.A. from the Department of Biomedical Engineering, Science and Research Branch, Islamic Azad University, Tehran, Iran, and A.M.-N. from the Biomedical Engineering Department, Shahed University, Tehran, Iran, hereby confirm that their research is supported by institutions that are primarily involved in education and research. They understand and agree that, in the event of acceptance, all figures included in this article will be printed in black and white, as no color figures will be permitted.
Author Disclosure Statement
All authors have seen and approved the submitted article and declare that they have no conflicts of interest.
Funding Information
This research did not receive any specific grant from funding agencies in the public, commercial, or not-for-profit sectors.