
Abstract
Background:
Brain development during the preschool period is complex and extensive and underlies ongoing behavioral and cognitive maturation. Increasing understanding of typical brain maturation during this time is critical to early identification of atypical development and could inform treatments and interventions. Previous studies have suggested mismatches between brain structural and functional development in later childhood and adolescence. The current study aimed to delineate the developmental matches and mismatches between brain measures from multiple magnetic resonance imaging modalities in young children.
Methods:
Brain volume, cortical thickness, fractional anisotropy, cerebral blood flow (CBF), amplitude of low-frequency fluctuations (ALFF), regional homogeneity (ReHo), and eigenvector centrality mapping (ECM) were included. Multi-modal neuroimages for 159 datasets from 67 typically developing preschoolers (2.0–7.6 years old) were collected and analyzed.
Results:
Functional measures (CBF, ECM, ReHo, ALFF) had similar developmental trajectories across regions, whereas development trajectories for brain volumes and cortical thickness were more heterogeneous. Furthermore, within individuals, brain volumes and cortical thickness were very good at predicting individual scans from prior longitudinal scans.
Conclusions:
These findings provide a more detailed characterization of the complex interplay of different types of brain development in the early years, laying the foundation for future studies on the impact of environmental factors and neurodevelopmental disorders on the development matches/mismatches patterns between brain areas and modalities.
Impact Statement
Our study characterized similarities and differences across regions and modalities for developmental trajectories of brain structures and functions in typical developing children. These results lay the foundation for future investigations of different ages and populations to see if aspects such as environmental factors and neurodevelopmental disorders alter developmental patterns across brain areas and modalities, and how these patterns relate to behavioral outcomes. Feature stability was also noted, suggesting that compromised stability may indicate atypical development patterns.
Introduction
The brain develops extremely rapidly in the first few years of life, with total brain volume more than doubling in the first 2 years (Knickmeyer et al., 2008), and white matter myelination reaching near-adult levels by age 2 years (Gilmore et al., 2018). After 2 years, brain development remains complex and extensive (for a more complete review, see Stiles and Jernigan, 2010) and has been widely characterized using a variety of magnetic resonance imaging (MRI) techniques. Studies have shown that mean cortical thickness peaks around 2 years, while gray matter volume peaks around 6 years, before declining throughout the rest of childhood and adolescence; white matter volume continues to increase until adulthood (Bethlehem et al., 2022; Brain Development Cooperative Group, 2012; Giedd et al., 1999; Long et al., 2024; Remer et al., 2017; Sowell et al., 2004; Zhang et al., 2022). These changes tend to happen earlier and faster in the primary sensory and motor regions, then in temporal and parietal regions, with the latest maturation in the frontal cortex. This mirrors the development of behavioral and cognitive functions, in that more basic functions (e.g., motor and primary sensory) develop earlier than higher-order functions (e.g., language and attention) (Casey et al., 2005; Gogtay et al., 2004; Marsh et al., 2008; Thompson and Nelson, 2001).
Looking beyond macrostructure, studies have shown that white matter myelination shows sigmoidal-shaped trajectories from 3 months to 5 years (Deoni et al., 2012), and increase of fractional anisotropy (FA) into late childhood and adolescence (Lebel and Deoni, 2018; Reynolds et al., 2019a). Functionally, cerebral blood flow (CBF) increases from 2 to 7 years (Paniukov et al., 2020), and eventually decreases through adolescence (Chiron et al., 1992; Moses et al., 2014; Satterthwaite et al., 2014). Resting-state functional MRI (fMRI) studies found that the primary sensory networks form adult-like topology at the age of 2 years, while higher-order networks undergo prolonged development during childhood (Gao et al., 2015, 2011; Uddin et al., 2010). Other previous studies detected an increase of local and global connectivity in the precuneus, the frontal, and the parietal regions during the early years (Long et al., 2017; Song et al., 2023).
Across metrics, structural and functional brain development is associated with emerging cognitive skills and behaviors (Blakemore, 2008; Gilmore et al., 2018; Ilyka et al., 2021). For example, amygdala volume matures earlier than other subcortical regions and is related to gross motor scores (Alex et al., 2024). Gray matter thickness increases in language regions and decreases in occipital regions, related to vocabulary levels between 5 and 11 years old (Sowell et al., 2004). The left arcuate fasciculus FA is positively correlated with phonological processing in children across the ages where they are learning to read (Reynolds et al., 2019b). Understanding typical brain maturation during this time is critical to early identification of atypical development and could inform future treatments and interventions (Brown and Jernigan, 2012).
Most previous studies have used individual MRI modalities. However, multi-modal analysis with combinations of these brain modalities can further elucidate the complexity of brain development during early childhood and help provide a more comprehensive picture of the human brain as a whole neurological system (Brown and Jernigan, 2012; Cao et al., 2017). A few studies have successfully investigated brain development with more than one modality in young populations (Chan et al., 2022; Fjell et al., 2012; Raschle et al., 2012; Thieba et al., 2019; Vanderwal et al., 2019). Reynolds and colleagues found leftward asymmetry in the inferior frontal gyrus for both white matter microstructure and functional connectivity from 2 to 7.5 years (Reynolds et al., 2019b). In the same participants, Wang and colleagues found that the variability of resting-state fMRI signals and white matter microstructure metrics at earlier ages predicted the variability of resting-state fMRI signals at later ages using artificial neural networks (Wang et al., 2021). Manning and colleagues used linked independent component analysis and found that both diffusion MRI (dMRI) and resting-state fMRI signatures in children aged 3.5 years were related to pre-reading measures 1 year later at 4.5 years old (Manning et al., 2022). Chan and colleagues found that structural connectivity was not associated with functional connectivity between the nucleus accumbens and the orbitofrontal cortex in children with an average age of 4.6 years (Chan et al., 2022). Previous studies have also shown different developmental patterns among brain modalities. One study found significant age-related increases in structure-function coupling in the frontoparietal and default mode networks, and decreased coupling in the sensorimotor and visual network from 8 to 23 years (Baum et al., 2020). A recent study using a large multi-site MRI dataset found that cortical thickness reached its peak earlier than brain volume and surface area (Bethlehem et al., 2022). These studies provide evidence of the complex relationships between brain structure and function during early childhood, helping to provide a new baseline from which we can further study atypical development.
Numerous studies have characterized regionally varying development trajectories using single MRI modalities, showing more protracted development of gray matter volume in frontal and temporal regions compared with occipital and parietal regions (Brain Development Cooperative Group, 2012; Giedd et al., 1999), more cortical thinning in bilateral occipital and right lateral frontal regions and more cortical thickening in perisylvian regions (Ducharme et al., 2016; Sowell et al., 2004), varied developmental trajectories of the regional functional measures (Hong, 2023; Long et al., 2017) and white matter microstructure (Lebel and Deoni, 2018). These regional differences are highly relevant for behavioral development. For example, the dual systems model hypothesizes that mismatched development between subcortical and prefrontal regions leads to characteristic adolescent behavior, such as risk-taking and emotional changes (Casey et al., 2008; Somerville et al., 2010). In support of this, Thompson and colleagues found that subcortical regions continue to grow when other regional volumes are less variable between 7- and 13-year-old children (Thompson et al., 2020). Mills and colleagues characterized developmental mismatches in volumes between the subcortical regions and prefrontal regions in youth and young adult participants, showing that most participants had mismatched development rates; however, they did not find the relationships between those mismatches and risk-taking behaviors (Mills et al., 2014). Liu and colleagues found significant co-developmental patterns between the amygdala and the orbitofrontal cortex in healthy controls but not in adolescents with social anxiety disorder (Liu et al., 2021). Better characterization of the differences among modalities and across regions in brain development could unravel the disrupted neurobiological systems associated with neurodevelopmental disorders (Dennis and Thompson, 2013; Di Martino et al., 2014), bringing opportunities for early diagnosis and more effective interventions.
The current study aimed to characterize developmental mismatches across MRI modalities and brain regions in young children using T1-weighted structural imaging, resting-state fMRI measures, arterial spin labeling (ASL), and diffusion MRI. This study was primarily exploratory in that we sought to describe trajectories among regions and across modalities. However, based on prior work describing trajectories for single metrics, we hypothesized that brain volume and cortical thickness would show opposing developmental trajectories between each other (i.e., volume increasing while thickness is decreasing) and between brain areas (i.e., more volumetric changes in the parietal area than the occipital area), and that we would observe increasing CBF and FA with relatively similar trajectories.
Materials and Methods
Participants
Data were obtained from the Calgary Preschool MRI Dataset, which recruited children aged 2–5 years in the Calgary area. Children/families were invited to return for subsequent scans approximately every 6 months, and after 2 years they were invited to return annually. Participants’ parents or legal guardians provided written informed consent before the scan and children provided verbal assent. The Conjoint Health Research Ethics Board at the University of Calgary approved this study.
The inclusion criteria were: (1) typically developing children (i.e., no neurodevelopmental, neurological, or psychiatric disorders); (2) complete and good quality T1-weighted, fMRI, and dMRI scans (see details in the Section “Data pre-processing”); and (3) participants were awake during MRI scans. In total, 159 datasets from 67 participants (31 females, age range: 2.0–7.6 years old) were included in the present study. Forty-two of 67 participants (63%) had two or more visits.
MRI parameters
MRI data were acquired on a research-dedicated GE 3T MR750w (General Electric, Waukesha, WI) scanner equipped with a 32-channel head-coil at the Alberta Children’s Hospital in Calgary, Canada. Children watched a movie of their choice for the entire duration of the scan. Headphones were worn to reduce noise, receive movie audio, and communicate with scanning staff. Full MRI details can be found in our previous publications (Reynolds et al., 2020). Here, we provide brief descriptions of the MRI parameters for each MRI modality:
T1-weighted data acquisition used an FSPGR BRAVO sequence with flip angle = 12°, 210 slices, TR = 8.23 ms, TE = 3.76 ms, voxel size = 0.9 × 0.9 × 0.9 mm, matrix size = 512 × 512, inversion time = 540 ms.
Whole-brain diffusion data were acquired using single-shot spin echo echo-planar imaging (EPI) sequence with 1.6 × 1.6 × 2.2 mm resolution, FOV: 200 × 200 mm, TR = 6750 ms, TE = 79 ms, 30 images with gradient encoding at b = 750 s/mm2 and 5 images at b = 0 s/mm2.
Whole-brain fMRI data were acquired with a gradient-echo EPI sequence with TR = 2 s, TE = 30 ms, flip angle = 60°, 36 slices, voxel size = 3.59 × 3.59 × 3.6 mm, matrix size = 64 × 64, 250 volumes. The first 10 volumes were removed to allow for acclimatization to the scanning environment. During fMRI, participants were watching a movie of their choice.
Whole-brain ASL images were acquired with the GE-supplied pseudo continuous 3D ASL sequence. TR = 4.56 s, TE = 10.7 ms, voxel size = 1.7 × 1.7 × 4 mm, labeling duration = 1.5 s.
Data pre-processing
Full details of the data pre-processing of each MRI modality can be found in our previous studies: T1 (Donnici et al., 2023, 2021), dMRI (Hay et al., 2020; Reynolds et al., 2019a), CBF (Paniukov et al., 2020), and resting-state fMRI (Long et al., 2019, 2017). T1-weighted scans were segmented using Multi-atlas Cortical Reconstruction Using Implicit Surface Evolution (MaCRUISE) software (Huo et al., 2018). dMRI scans were pre-processed including motion and eddy-current corrections in Explore DTI v4.8.6 (Leemans et al., 2009). FA maps were generated from each dMRI scan. ASL data were pre-processed and quantified to the CBF measures (unit: mL/100 g/min) with the general kinetic model (Buxton et al., 1998). Resting-state fMRI scans were pre-processed including head motion correction, band-pass filtering (0.009–0.08 Hz), and nuisance signals removal with FSL v6.0 and AFNI v21.2.01 (Cox, 1996; Jenkinson et al., 2012).
Extracting metrics of each MRI modality
Seven metrics were calculated across MRI modalities. The gray matter volumes of 116 brain regions (excluding the brain stem, ventricles, and cerebellum) and cortical thickness of 98 brain regions (excluding subcortical areas) were calculated for each participant using the MaCRUISE atlas parcellation (Huo et al., 2018; Klein and Tourville, 2012) (Fig. 1). FA was calculated from dMRI data, and CBF from the ASL scans. Each template brain region was assigned to one of eight brain networks (see Supplementary Table S1): the somatomotor network, the visual network, the dorsal attention network, the ventral attention network, the limbic network, the frontoparietal network, the default mode network, or a subcortical network (Yeo et al., 2011). The individual MaCRUISE atlases were registered to the individual dMRI, fMRI, and CBF space for further analysis.
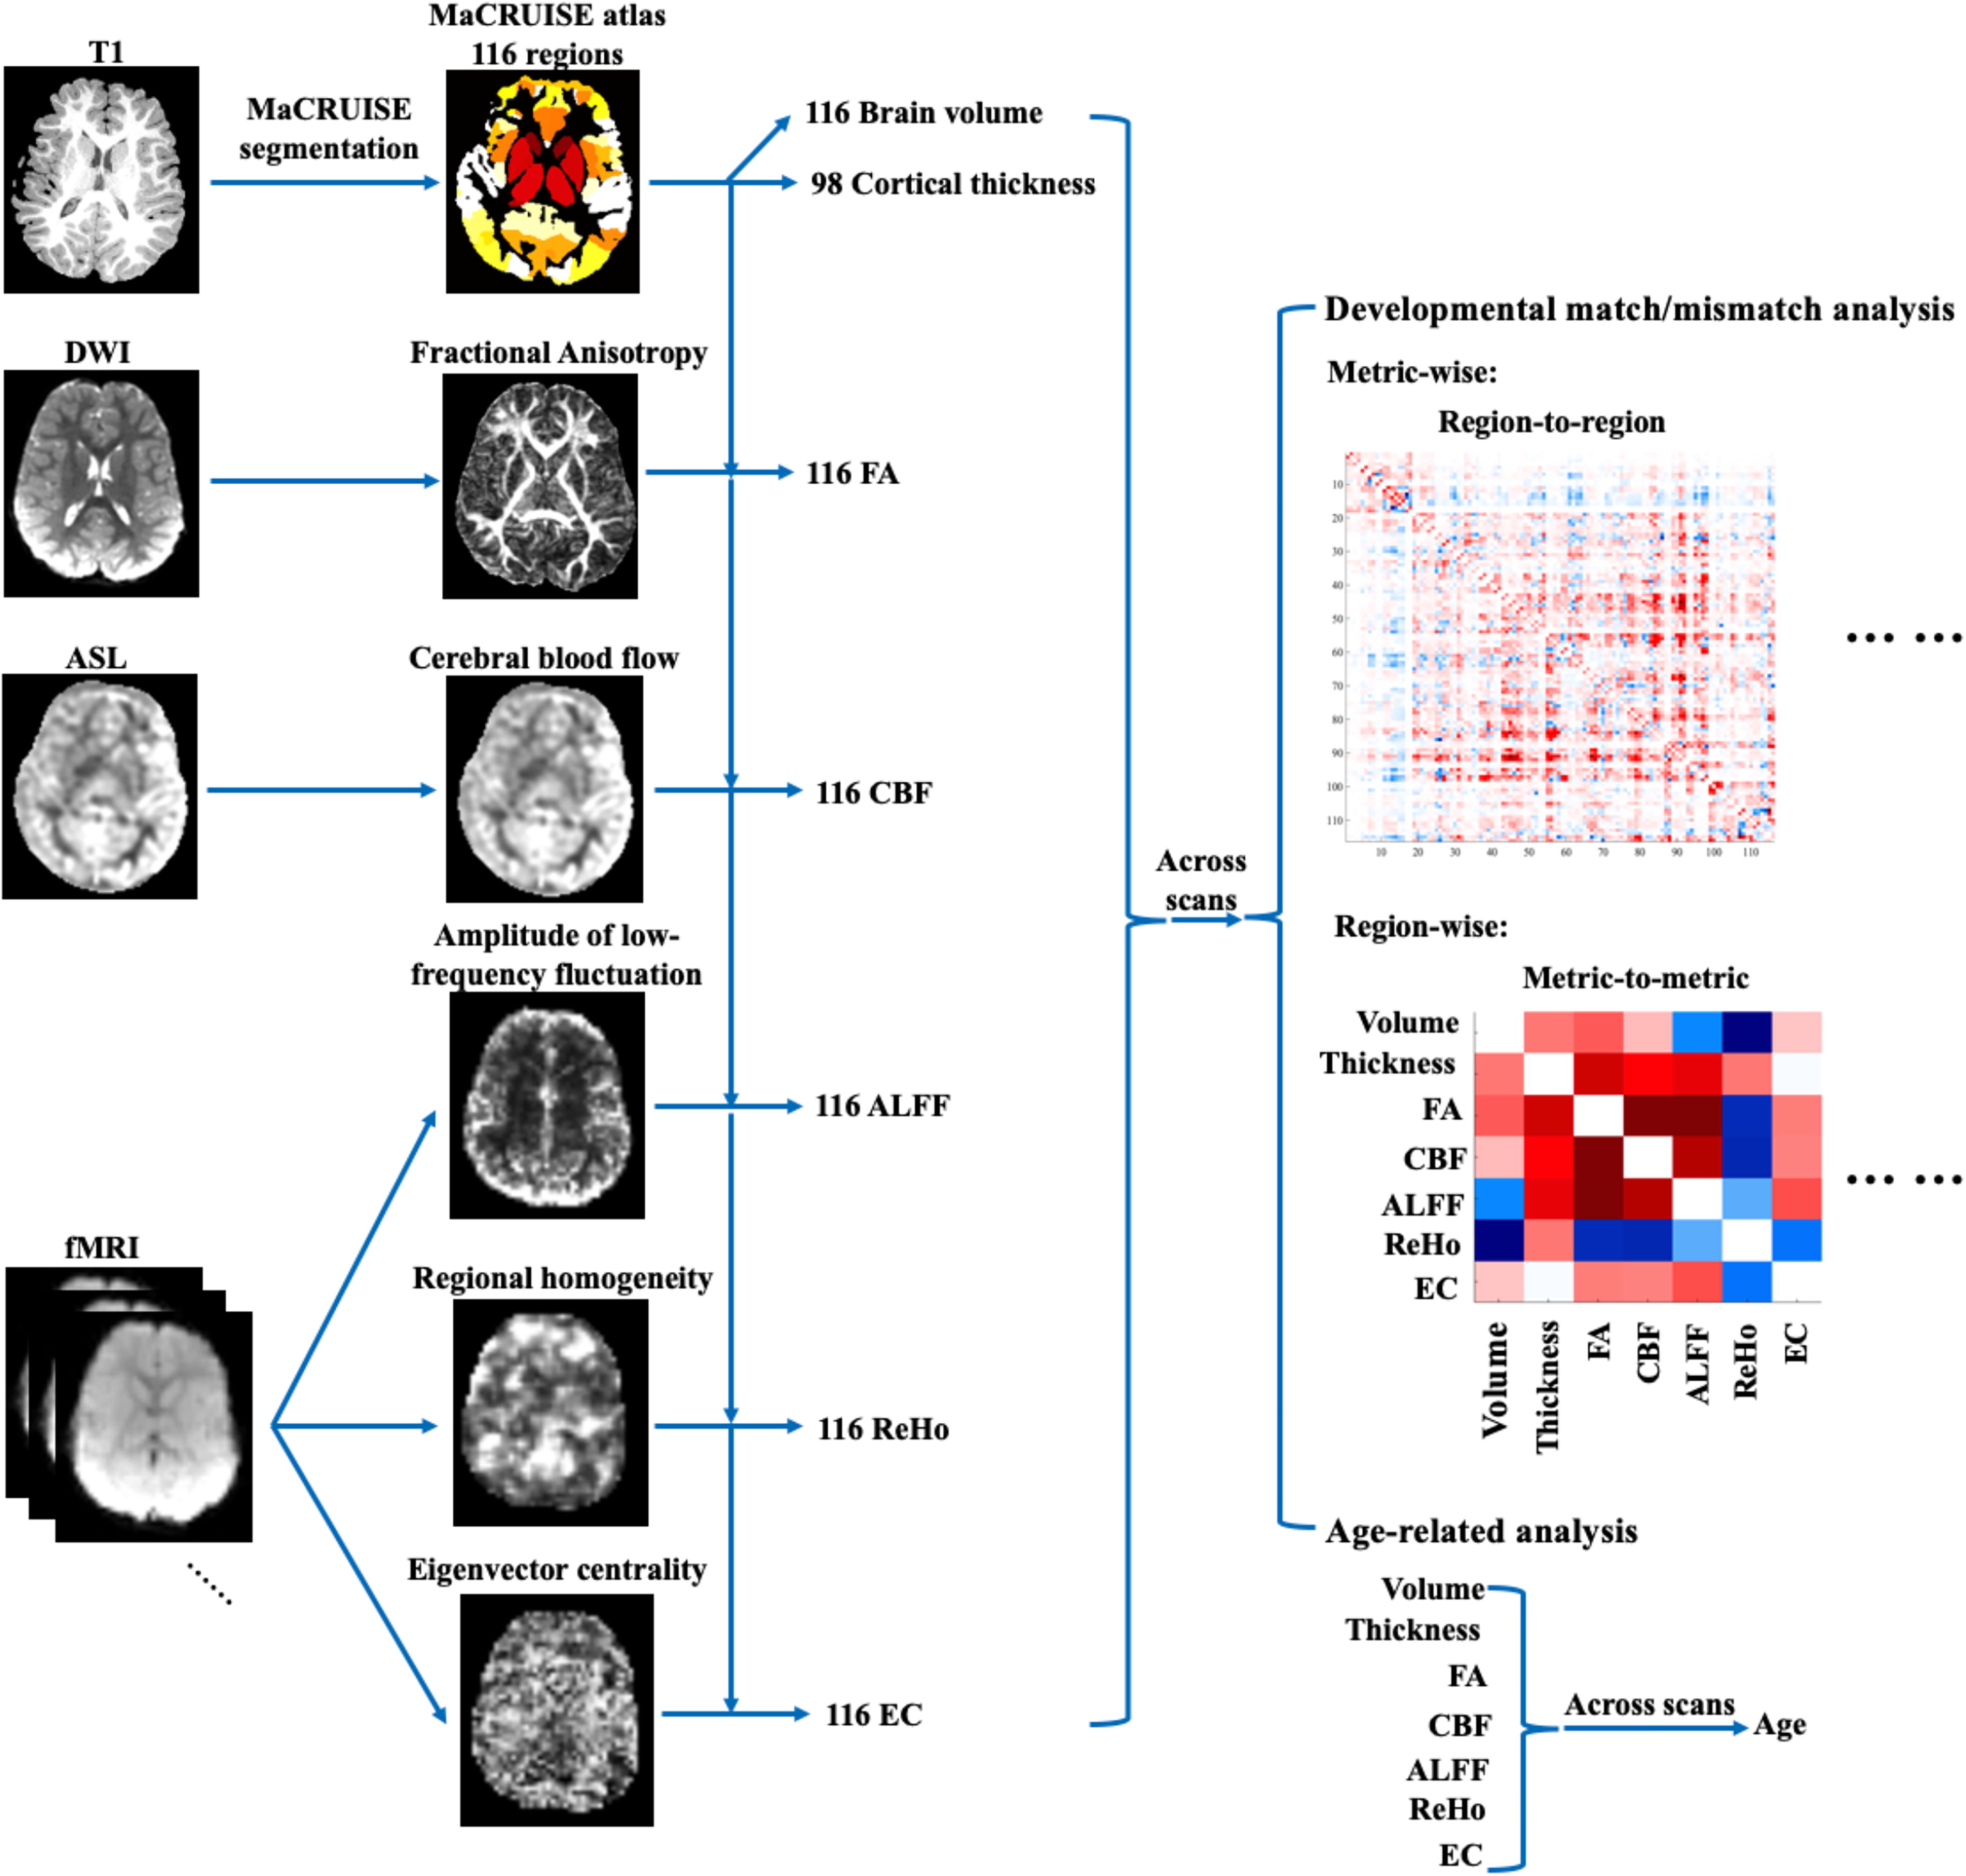
The schematic flow of the developmental analyses in the current study. The developmental match/mismatch analysis and the typical age-related analysis were performed separately. ALFF, amplitude of low-frequency fluctuations; ASL, arterial spin labeling; CBF, cerebral blood flow; ECM, eigenvector centrality mapping; FA, fractional anisotropy; fMRI, functional magnetic resonance imaging; MaCRUISE, Multi-atlas Cortical Reconstruction Using Implicit Surface Evolution; ReHo, regional homogeneity.
Voxel-wise regional homogeneity (ReHo), amplitude of low-frequency fluctuations (ALFF), and eigenvector centrality mapping (ECM) maps were calculated from the resting-state fMRI data as in our previous study (Long et al., 2017). ReHo measures the consistency of the targeted voxel’s signal with its nearest neighbors (Zang et al., 2004); ALFF measures the voxel’s signal intensity (Zang et al., 2007); ECM measures the voxel’s network centrality based on functional connectivity across the whole brain (Lohmann et al., 2010).
All voxel-wise maps were spatially smoothed with 6 mm full-width at half-maximum Gaussian kernel. The averaged ReHo, ALFF, ECM, FA, and CBF values within each MaCRUISE region were extracted for each scan in each region.
Analysis of developmental matches/mismatches across MRI metrics and brain regions
For each MRI metric separately, linear mixed-effects models were applied to estimate the relationships between development trajectories for each pair of brain regions, controlling for sex, total brain volume, and participant as a random intercept:
Significant β1 values (p < 0.05, corrected by the false discovery rate [FDR]) indicated a developmental match (if positive) or mismatch (if negative) between two brain regions. This model was performed across all pairs of regions for each MRI metric, separately.
Additionally, a percentage was calculated by the number of match/mismatch regions within and between brain networks for each MRI measure to summarize the matches and mismatches in the whole brain. Linear mixed effects models were applied to estimate the relationships between each pair of MRI metrics (e.g., ReHo as metric A and ALFF as metric B in the model) within a given region, controlling for sex, total brain volume, and the random effect of participant:
Positive significant β1 values (p < 0.05, corrected by FDR) indicated a developmental match (or mismatch if negative) between two MRI metrics for a given region. This model was performed separately across all pairs of MRI metrics for each brain region. The number of brain regions that showed significant positive or negative correlations (p < 0.05, FDR corrected) between any pairs of MRI metrics were counted. The percentage of the regions within each network that showed matches/mismatches between modalities was calculated.
Robustness analysis of developmental mismatches
A sliding window analysis was performed to test whether the relationships between the developmental trajectories of brain regions were robust throughout the age range. Eleven age bins were created from the whole sample from age 2 to 7.6 years (Fig. 2). Each bin included ∼60 scans spanning approximately 2 years, with 10 scans overlapping between any pair of two continuous bins (i.e., one bin has 60 scans, and the next bin has the same last 10 scans plus the next 50 older ones). The same developmental match/mismatch analysis described above was then performed between pairs of brain regions for each metric within each age bin.
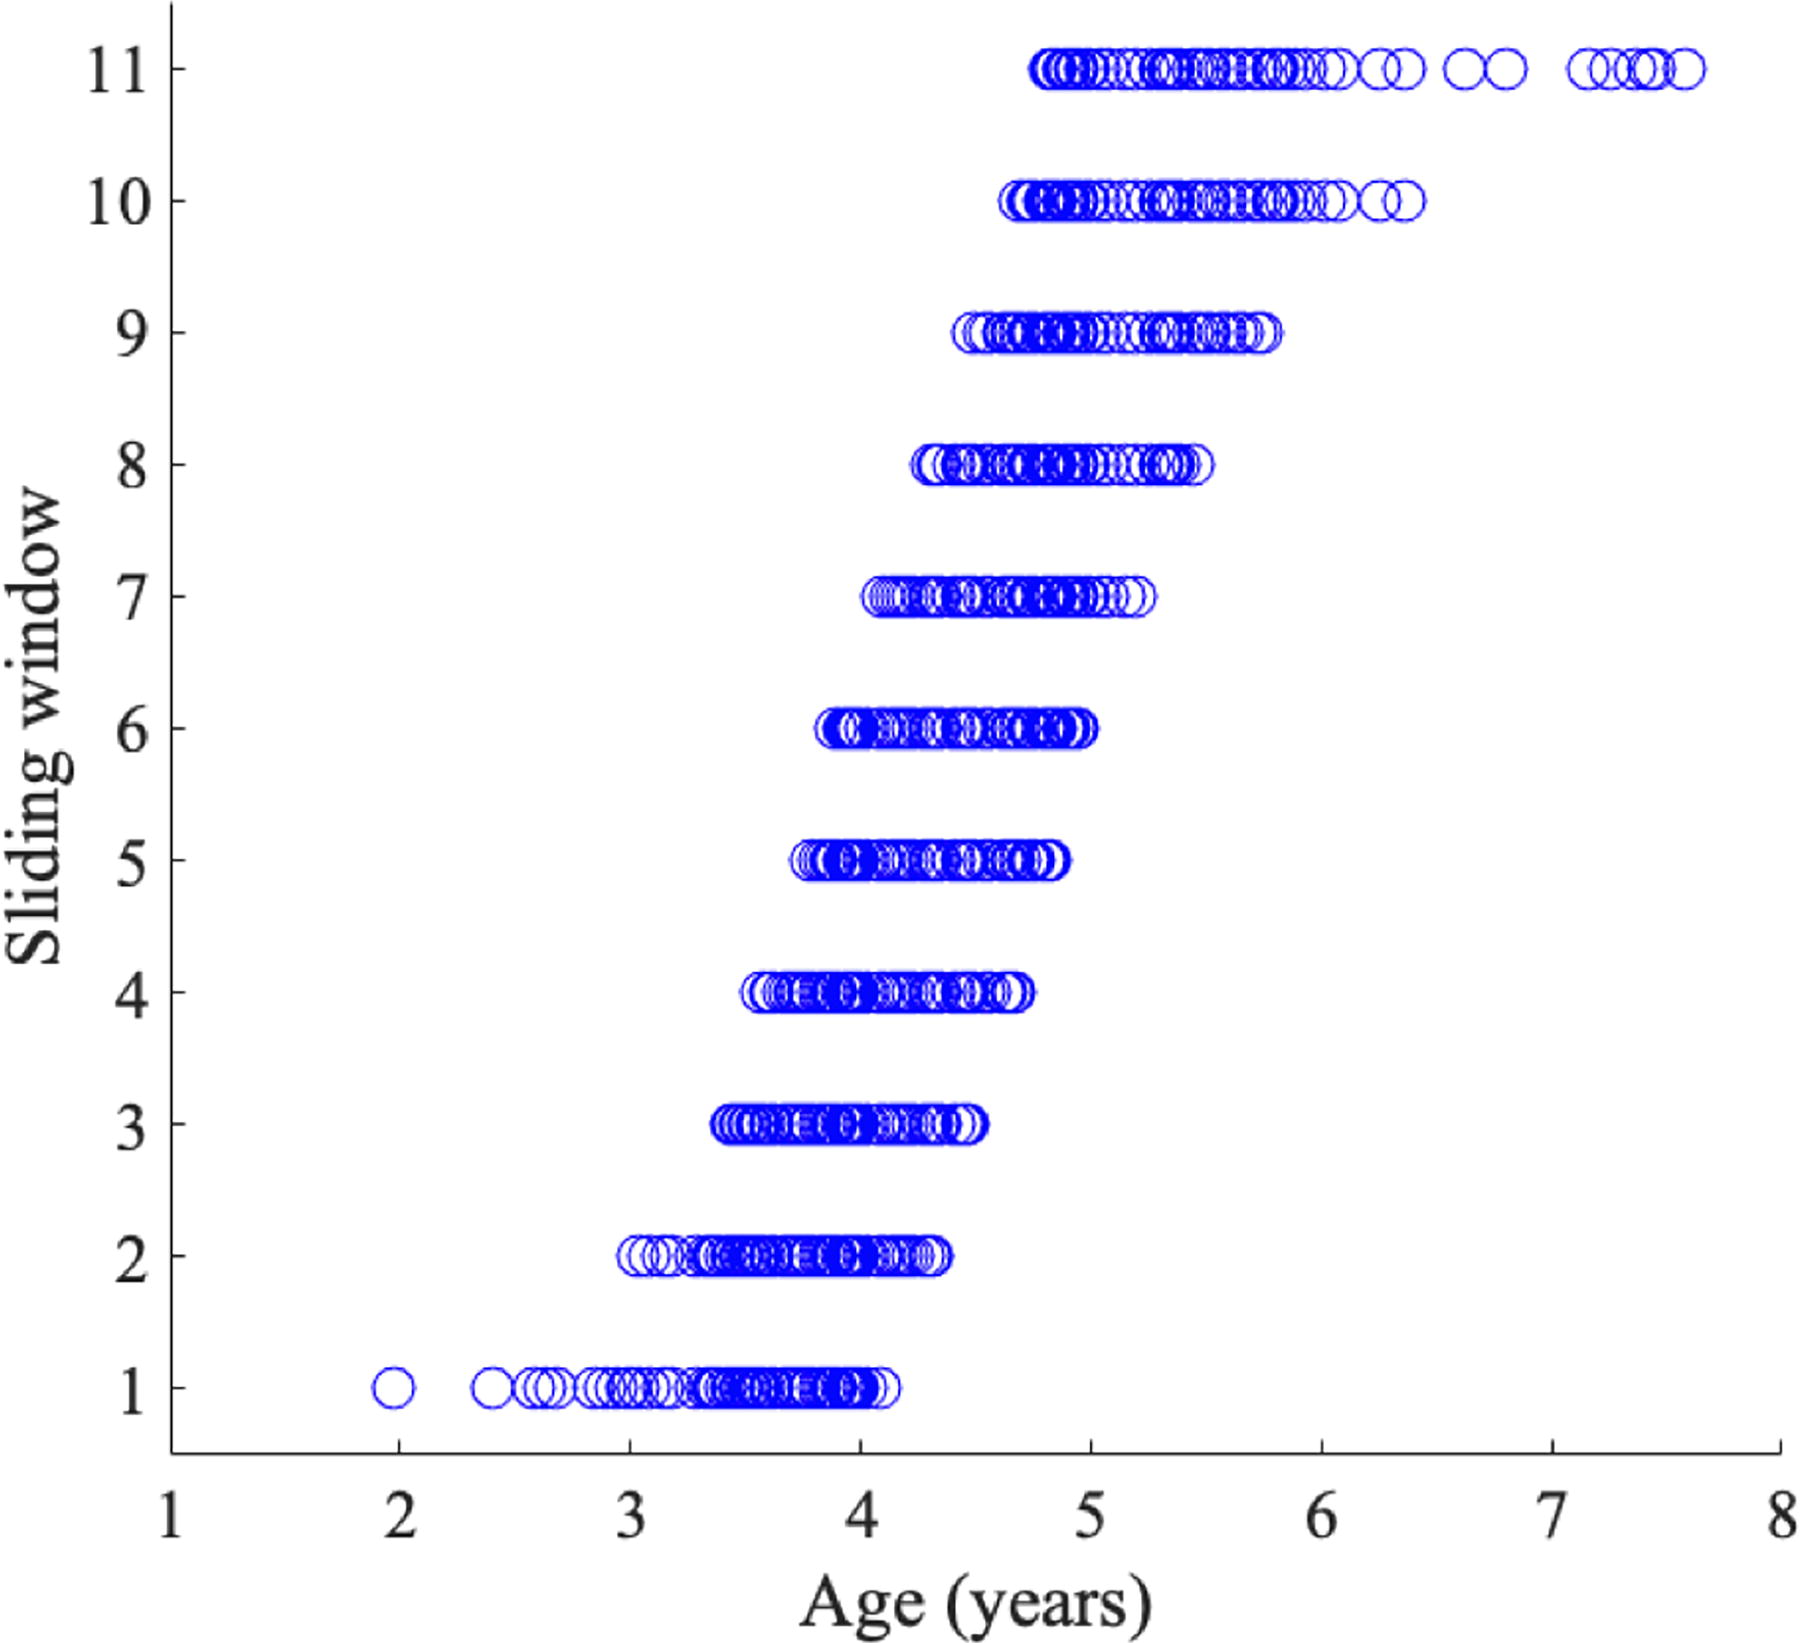
The sliding windows across the whole sample size. Each sliding window includes 60 scans across approximately 2 years.
Additionally, the linear relationship between MRI metrics and age was examined for each brain area within each age bin:
The standard deviation of β1 across age bins was calculated for both the developmental match/mismatch analysis and the linear developmental trajectory analysis. Higher standard deviation means the relationships (i.e., region-to-region or region-to-age) were more variable across age bins, reflecting a less robust relationship. For each metric, we then summed the number of brain regions that showed differences in standard deviations between the region-to-region and region-to-age analysis across age bins.
Applications of developmental mismatches on the longitudinal scans
A secondary analysis was performed on participants with longitudinal scans. There were 13 participants in our sample with at least three scans with high-quality data in each modality (59 scans in total). We first calculated the developmental match/mismatch matrix across the participant’s first N − 1 scans (i.e., all but the last scan). The matrix was calculated using the temporal correlation coefficient between each pair of brain regions’ metric. Then, the last scan of each participant from the whole sample (i.e., 159 scans) was combined with each longitudinal participant’s N − 1 matrix, and the developmental match/mismatch matrix was generated again. The correlation coefficient between the matrix with N – 1 scans and the matrix with N scans was calculated (Fig. 3). The highest correlation coefficient was selected as the best match. This prediction was considered a “success” when the Nth scan (i.e., the last time point of the longitudinal scans) was from the same participant as the longitudinal data.

The identification analysis of the longitudinal scans. A correlation analysis was performed between the region-to-region correlation matrix of the longitudinal scans (N − 1 scans from one participant) and the similar matrix with the last scan from each participant in the whole sample added one at a time. When the highest correlation was between scans from the same participant, this was considered “success.”
Results
Developmental matches and mismatches across MRI modalities
In total, 6670 pairs of brain regions were included in the analysis (4753 pairs for cortical thickness). Pairs of brain regions, which showed significantly matched developmental trajectories, were found most commonly for the ALFF metric (5183 matches [78%], 0 mismatches) as well as the CBF metric (5190 matches [78%], 0 mismatches). These metrics had a significantly higher match rate across regions compared with the other metrics (Fig. 4; Table 1). Relatively high matched developmental patterns were found in ReHo (2627 matches [39%], 0 mismatches), ECM (2967 matches [44%], 4 mismatches [0.06%]), and FA (3900 matches [58%], 0 mismatches). Brain volume (177 matches [2%], 16 mismatches [0.24%]) and cortical thickness (164 matches [2%], 2 mismatches [0.03%]) had few pairs of regions with matches. There were very few mismatches within metrics overall (no region had >0.5% mismatch).

The results of analysis of variance (ANOVA) between pairs of regional metrics of the averaged developmental matches/mismatches. More statistical details are listed in Table 1. ALFF, amplitude of low-frequency fluctuations; CBF, cerebral blood flow; ECM, eigenvector centrality mapping; FA, fractional anisotropy; ReHo, regional homogeneity.
The Statistical Values of the ANOVA Between Pairs of Metrics of the Summed Developmental Matches/Mismatches (i.e., Fig. 4)
Results are only shown if they passed the multiple comparisons correction.
ALFF, amplitude of low-frequency fluctuations; ANOVA, analysis of variance; CBF, cerebral blood flow; ECM, eigenvector centrality mapping; FA, fractional anisotropy; ReHo, regional homogeneity.
For correlations between pairs of MRI metrics (within brain regions), ReHo and ECM, FA and ECM, and brain volume and cortical thickness presented highly matched developmental patterns in most regions (Fig. 5). ALFF and ReHo, and brain volume and FA presented highly mismatched developmental patterns in most of the regions.

The percentage of brain areas that showed significant developmental relationships between a pair of metrics in the whole brain. Red colors represent matched developmental patterns between metrics and blue colors represent mismatched developmental patterns between metrics. ALFF, amplitude of low-frequency fluctuations; CBF, cerebral blood flow; ECM, eigenvector centrality mapping; FA, fractional anisotropy; ReHo, regional homogeneity.
Developmental matches and mismatches across brain areas
Figure 6 shows the ratio of regions within each network that showed significant matches/mismatches to itself and other networks. Percentage means the percentage of regions from one network that presented significantly matched or mismatched developmental patterns with other regions of the certain network. The ALFF, ReHo, FA, and CBF measures presented similar percentage distributions across networks. Brain areas in the visual network presented mismatched developmental patterns with the ventral attention, frontal parietal, and default mode network in the ECM analysis. For the brain volumetric measure, subcortical regions presented more spread mismatched developmental patterns than other networks. The cortical thickness of the limbic network presented more mismatched developmental patterns with the somatomotor network.
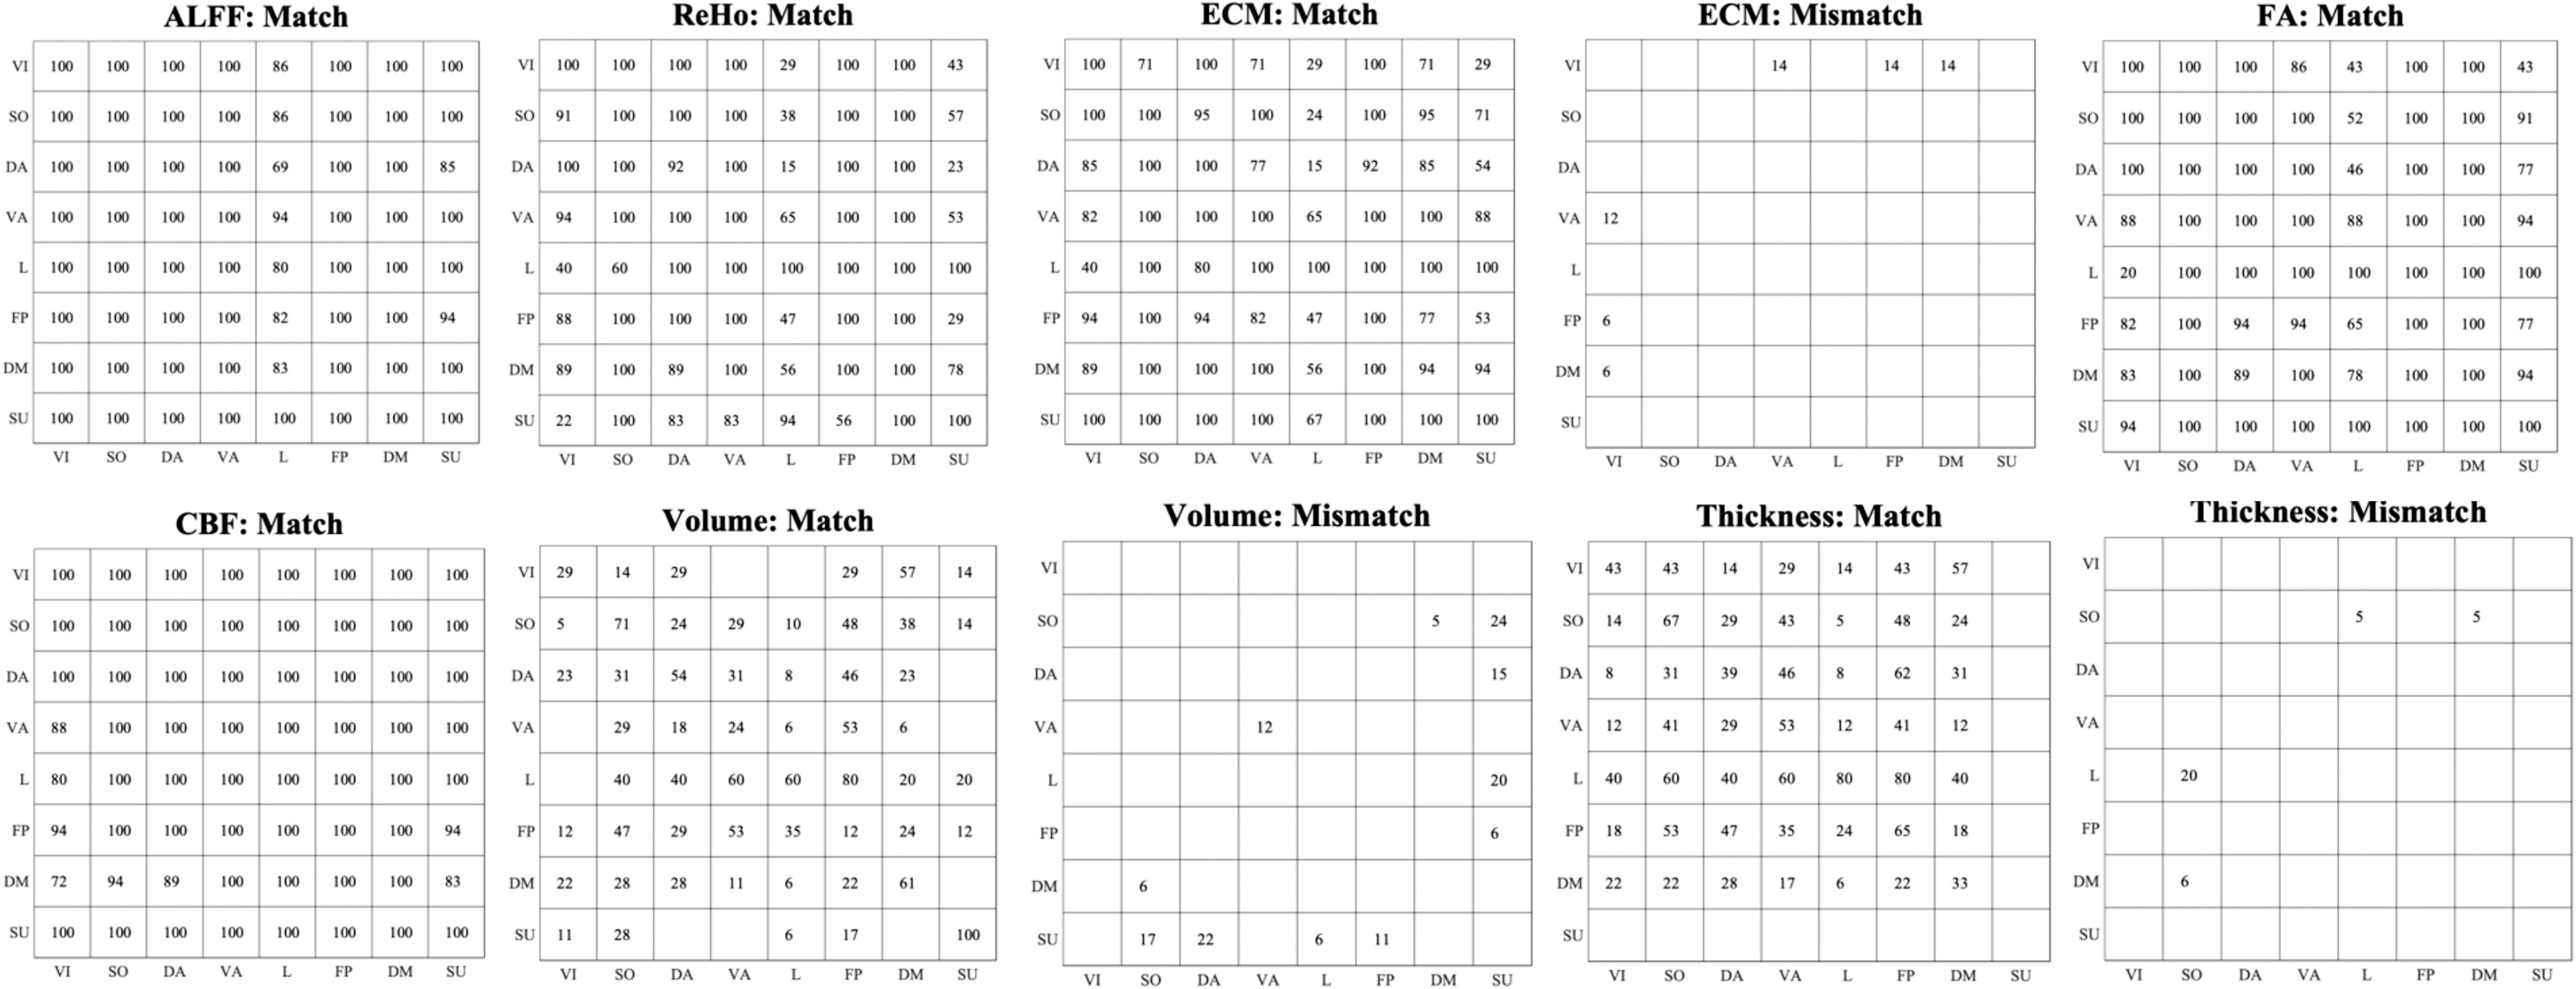
The percentage of the significant match/mismatch regions within each brain network to itself and other networks. For instance, in the “ALFF: Match” section, there was 86% of the regions from the visual network presented developmental matches with 100% of the regions from the limbic network. The empty element means no significant match/mismatch between networks. No significant mismatch was detected in ALFF, ReHo, FA, and CBF metrics. ALFF, amplitude of low-frequency fluctuations; CBF, cerebral blood flow; DA, dorsal attention network; DM, default mode network; ECM, eigenvector centrality mapping; FA, fractional anisotropy; FP, frontal parietal network; L, limbic network; ReHo, regional homogeneity; VI, visual network; SO, somatomotor network; SU, subcortical regions; VA, ventral attention network.
The robustness of match/mismatch compared with age-related developmental analysis
The numbers of brain regions that showed higher or lower standard deviations in the match/mismatch analysis compared with age-related analysis across sliding windows were counted across MRI measures (Fig. 7). The match/mismatch values presented higher standard deviations (i.e., less robust across age bins) in ALFF, ReHo, ECM, and FA in most of the regions, and lower standard deviations (i.e., more robust across age bins) in CBF, brain volume and cortical thickness in most of the regions compared with the typical age-related analysis (see an example in the Supplementary Figure S1). These results indicate that the between-region correlations were more stable than the age-region correlations across sliding windows samples on the brain structural measures.
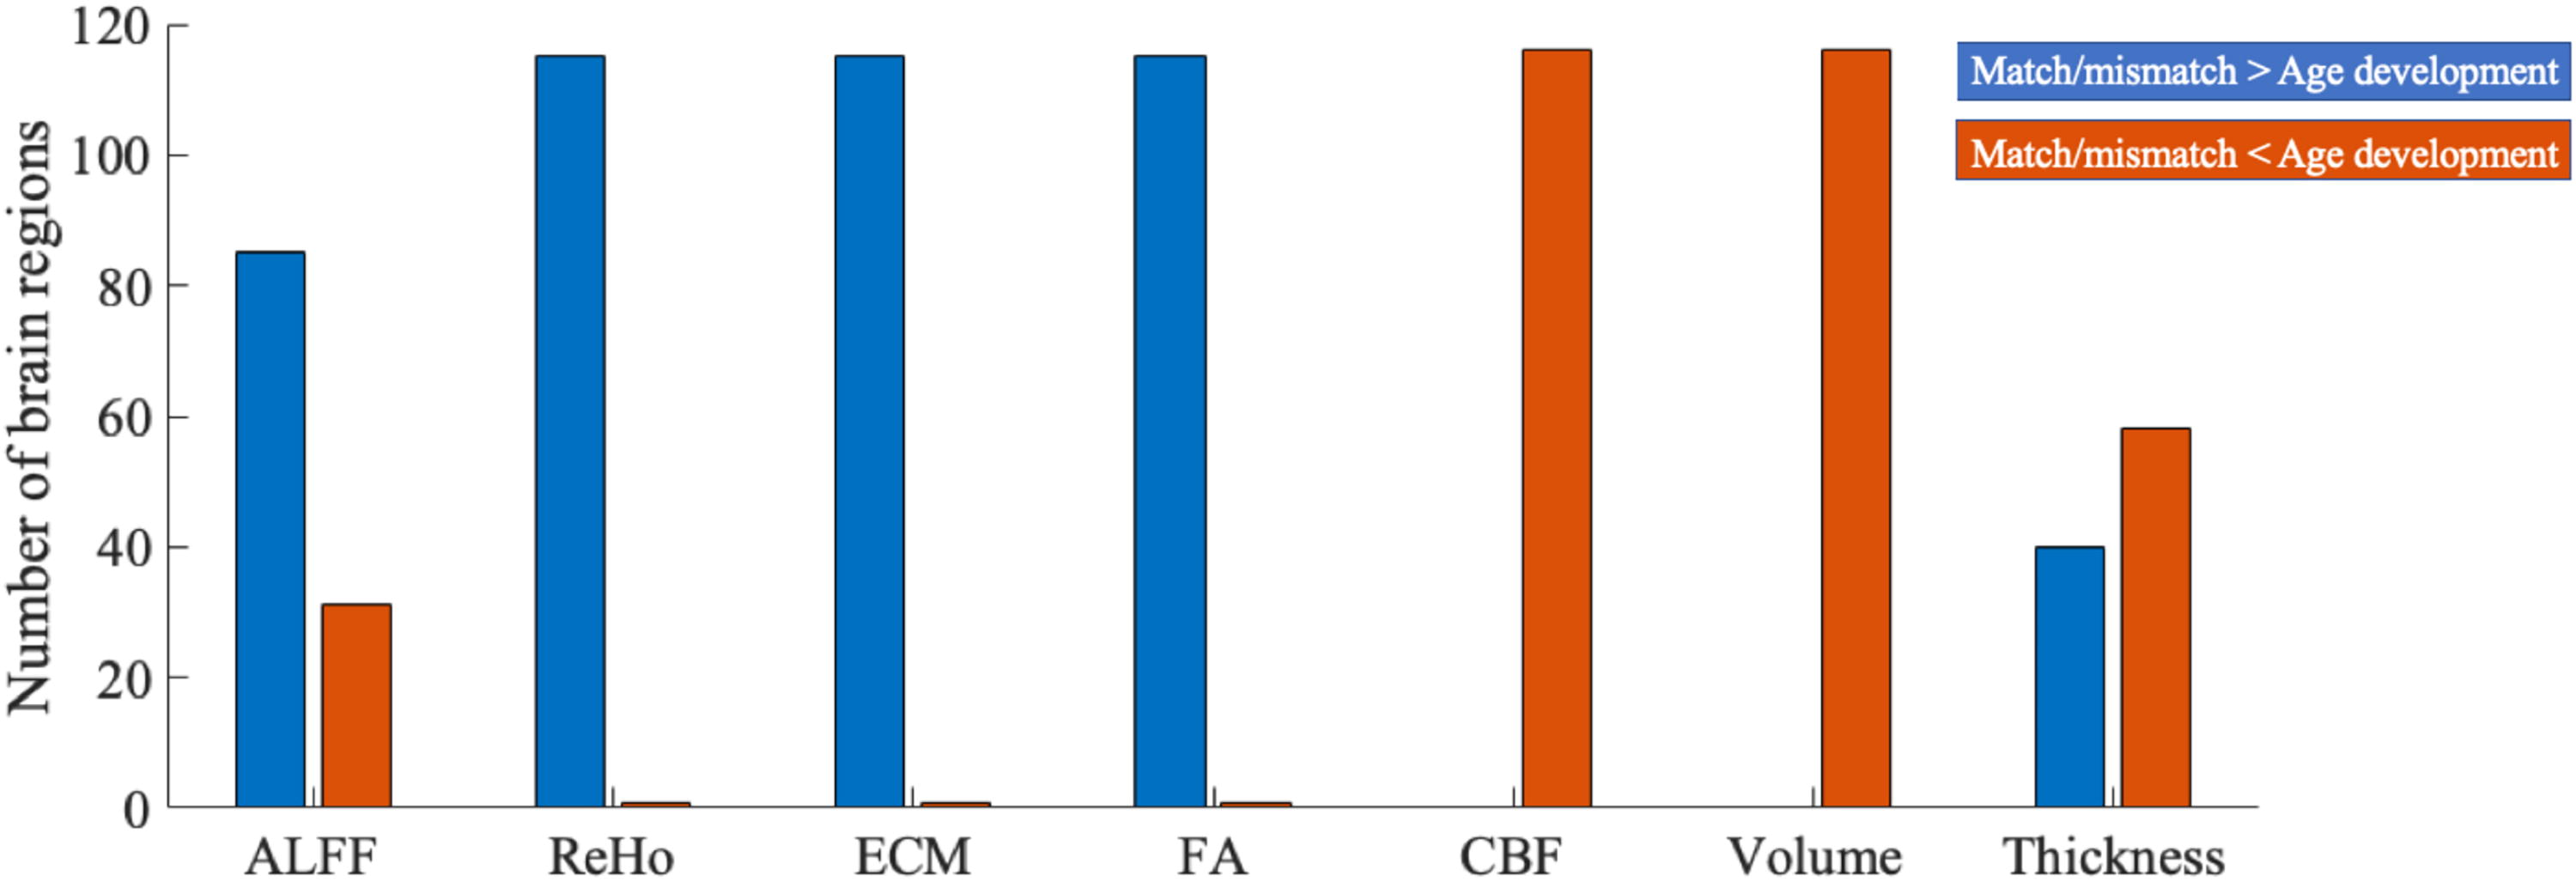
The number of brain regions that showed higher or lower standard deviations in the match/mismatch analysis than age-related developmental analysis across sliding windows. Blue color bars represent higher standard deviations in the match/mismatch analysis, and orange color bars represent higher standard deviations in the age-related developmental analysis. ALFF, amplitude of low-frequency fluctuations; CBF, cerebral blood flow; ECM, eigenvector centrality mapping; FA, fractional anisotropy; ReHo, regional homogeneity.
Developmental match/mismatch analysis in the longitudinal scans
The success rates of detecting the last scan within participants are shown in Figure 8. The developmental matrices of both brain volume and cortical thickness successfully identified the last scan of all longitudinal participants. FA predicted 69% and ECM predicted 46% of the last scans from longitudinal participants, and ALFF, ReHo, and CBF could not reliably identify the last scans of participants, indicating high variability across longitudinal scans.
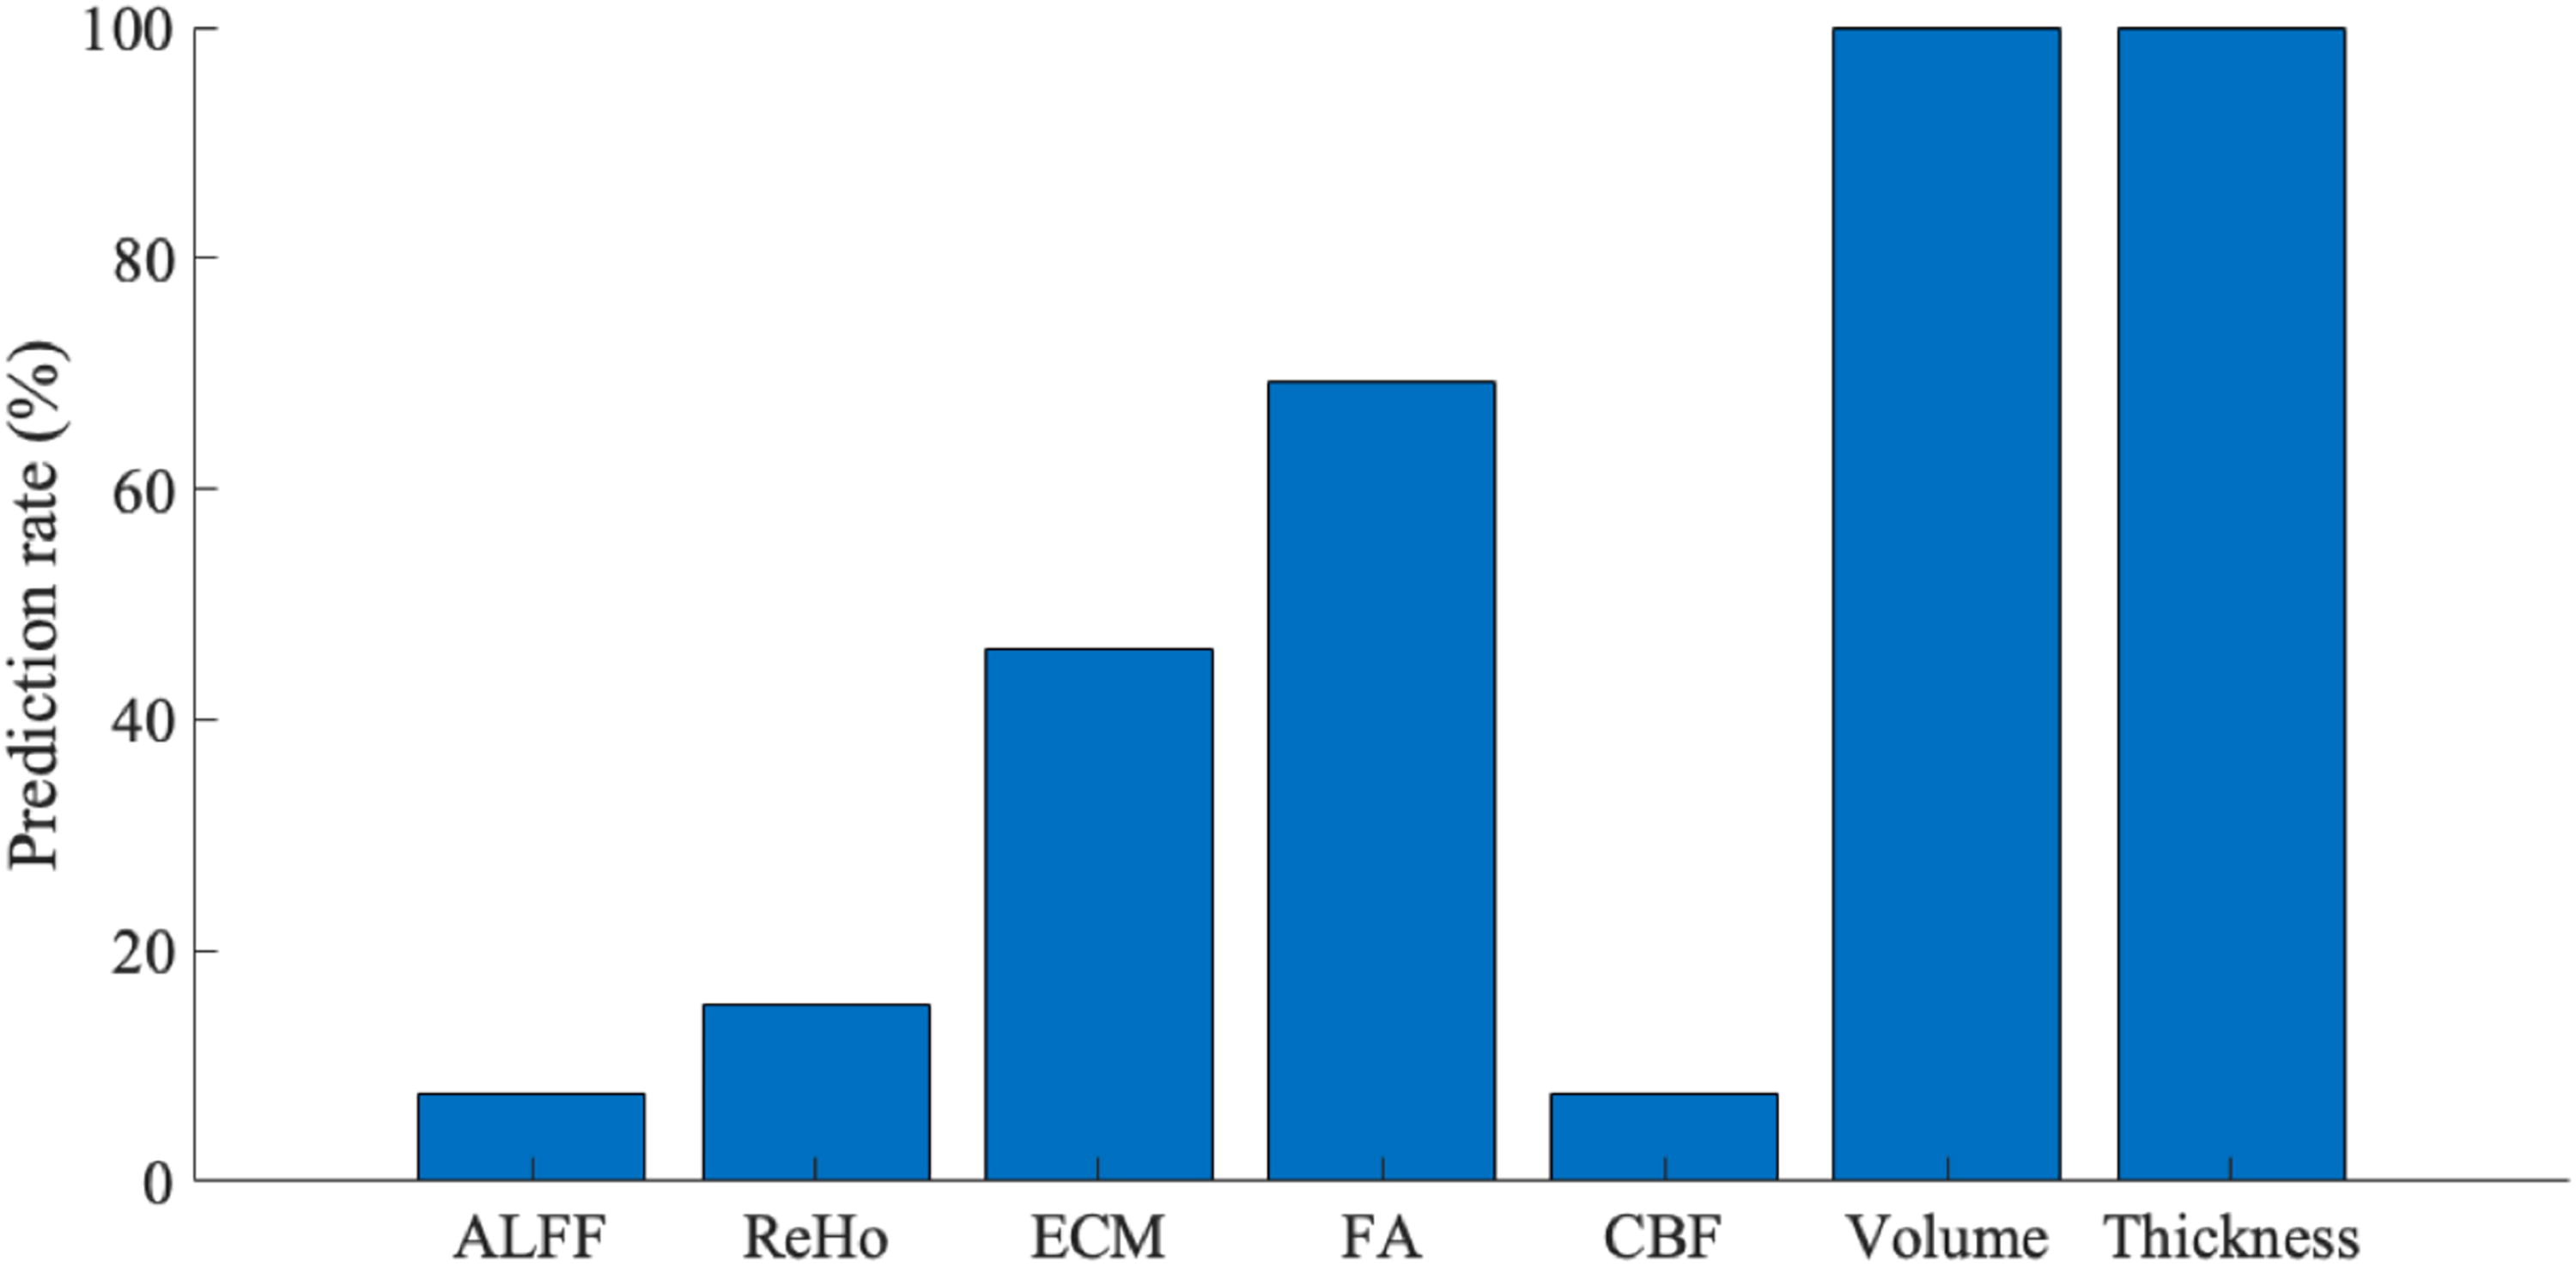
The success rates of detecting the last scan of the longitudinal scans of the participants for each MRI metric. ALFF, amplitude of low-frequency fluctuations; CBF, cerebral blood flow; ECM, eigenvector centrality mapping; FA, fractional anisotropy; MRI, magnetic resonance imaging; ReHo, regional homogeneity.
Discussion
Here, we investigated similarities and differences in developmental patterns across brain volumes, cortical thickness, FA, CBF, ReHo, ALFF, and ECM in young children. Overall, we detected high rates of developmental matches across regions, indicating most regions were showing similar development patterns. We also found very stable match and mismatch patterns across modalities, suggesting that relationships between modalities are maintained over childhood. Structural metrics were good individual predictors, indicating the stability of each individual’s brain, relative to others. This could potentially be implemented to identify future longitudinal scans of individual participants in typically developing populations. Feature stability also suggests that compromised stability may indicate atypical development.
Developmental match and mismatch among brain areas
The current results provide a new perspective on previous age-related developmental studies. Previous studies have characterized age-related changes across multiple regions for metrics including ALFF (Long et al., 2017), ReHo (Long et al., 2017), and CBF (Paniukov et al., 2020) in young children. The present study used region-wise covariance analysis to capture the similarities of the developmental trajectories among regions (Alexander-Bloch et al., 2013). Our findings indicate that most brain areas show positively correlated (i.e., similar) developmental patterns in their regional functional, metabolic, and white matter microstructural metrics. Even subcortical areas presented matched developmental patterns with other brain areas. Previous studies found similar development patterns among regional functional metrics at other ages. For example, in a recent study of typically developing adolescents, 38% of the selected regions presented a negative correlation between ReHo and age and only 1.5% presented a positive correlation (Hong, 2023). A widespread decrease in ReHo with age was detected across the whole brain from 11 to 35 years old (Lopez-Larson et al., 2011). In our study, ALFF and CBF presented higher matched development among brain areas than other metrics, which might suggest that the metrics related to regional fMRI signal intensity and metabolism show less regional variation than other metrics in early childhood (Wu et al., 2016). Developmental mismatches were detected among brain areas on their regional eigenvector centrality. Eigenvector centrality measures the prime global connectivity patterns of brain areas (Lohmann et al., 2010), or each region’s functional connectivity strength to all other brain regions, and is the only measure related to region-wise functional connectivity in the current study. Brain regions within the visual network, frontal parietal network, default mode, and ventral attention network had mismatches of eigenvector centrality, indicating that the functional connectivity patterns within the primary sensory networks (i.e., visual network) had different developmental trajectories than networks associated with high-order functions (i.e., frontal parietal, default mode, ventral attention). This fits with prior literature showing that sensory networks tend to develop prior to higher-order networks (Cao et al., 2017) and highlights early childhood as an important time shift between the early development of sensorimotor areas and the later development of the higher-order networks, which was in line with that higher-order functions develops later than primary functions (Thompson and Nelson, 2001). Our results suggested that such developmental differences between the primary sensory networks and the high-order networks during preschool years still sustained during preschool years.
Developmental matches were less evident in brain volume and cortical thickness compared with functional and diffusion metrics, and more mismatches were detected in brain volume compared with other MRI measures. Subcortical brain regions especially showed mismatched development with other brain regions for volume. We found a trend level of mismatched development between the amygdala/accumbens area and the frontal cortex (before FDR correction). This trend aligns with previous findings of a developmental mismatch in trajectory timing between the amygdala and prefrontal cortex during early childhood and adolescence (Mills et al., 2014; Roeske et al., 2024). The thalamus also had many mismatches, including with the precentral gyrus and the cingulate gyrus, and these levels of mismatch were higher than mismatch levels between the amygdala and other regions. These results might reflect the early stages of the dual systems theory, which proposes that developmental mismatches exist between subcortical regions and prefrontal regions during adolescence (Casey et al., 2008; Somerville et al., 2010). Since similar mismatches were not observed for the other brain metrics, discrepancies may emerge first in volume, rather than functional metrics or white matter microstructure. Future work should investigate whether functional and white matter microstructural developmental mismatches emerge in later years.
Developmental match and mismatch among brain modalities
Across brain modalities, eigenvector centrality was well matched with ReHo and with gray matter FA in many brain areas. This suggests that both short- and long-range functional connectivity and microstructure of the gray matter share similar developmental patterns in early years, before functional connectivity patterns shift from local to more long-range functional connections in late childhood (Fair et al., 2009). In our previous study in a subset of these participants, the development of ReHo and ECM were mismatched in the left superior parietal lobule and the right fusiform gyrus using linear correlation analysis (Long et al., 2017). The slightly different results in these overlapping samples may reflect the availability of more data, including longitudinal scans, in the current analysis. The robustness of the current results might be increased with better brain parcellation, more scans, and controlled with sex, total brain volume, and participants. CBF and ALFF were mismatched in most brain areas in our study (2–7 years). A previous study found that CBF and ALFF become less coupled with age from 8 to 22 years old (Baller et al., 2022). Together with our findings, this implies that the reduction in coupling between CBF and ALFF might start in early life. Brain volume and cortical thickness were well matched in over half of brain regions, which may reflect the ongoing development of these metrics across most of the brain during the early years (Brown and Jernigan, 2012; Sowell et al., 2004; Zhang et al., 2022); this development may become less linked in later childhood (Bethlehem et al., 2022).
The features of developmental match/mismatch patterns
We examined two specific features of the developmental match and mismatch patterns. The first feature was the dynamics of the developmental match/mismatch patterns between brain areas across ages. Developmental match/mismatch patterns had more variation across age bins in the fMRI measures and FA than in CBF and brain volume; cortical thickness was in between. This indicates that the region-to-region developmental relationships of brain structures were more stable across age bins (i.e., short period) in the early years compared with the correlations between brain structures and age and suggests that the relationships between regional development patterns are robust across this small age range. Less varied region-to-region developmental relationships in brain structural measures may be a useful tool for evaluating individual brain development.
Then, we tested the match/mismatch patterns between brain areas using longitudinal scans, similar to prior work using functional connectomes as “fingerprints” to identify individual brains (Finn et al., 2015; Graff et al., 2022). We tested the traditional functional connectome “fingerprints” approach using the same atlas with the functional connectivity analysis (Finn et al., 2015), yielding a low longitudinal scan success rate (around 14%). Other fMRI metrics (e.g., ALFF, ReHo) performed poorly in predictions as well. One reason might be that this passive-viewing fMRI data was collected while children watched self-selected movies, so movies were not necessarily the same across scans. The success rates identifying the last scans for an individual were high when using brain volume or cortical thickness. Such results confirm that the region-to-region developmental relationships across structural measures could help predict and evaluate brain development in children. Previous studies have used longitudinal scans to monitor brain maturation (Cao et al., 2015) and the progression and impact of disease (Aamodt et al., 2023; Peña-Nogales et al., 2018). This type of analysis using longitudinal scans would be a useful technique to check if new scans follow similar region-to-region developmental relationships as previous scans, and pairs of brain regions that deviate from previous patterns could potentially serve as markers of atypical patterns for follow-up. Atypical patterns could also serve as the basis for investigating adverse factors, revealing opportunities for early interventions. Our results provide more evidence of the importance of scanning younger children longitudinally for both scientific and clinical purposes. Future studies could attempt to link cognitive/behavioral outcomes and matched/mismatched development among brain modalities and regions in longitudinal scans.
Limitations
Several limitations are worth mentioning. Most MRI measures were calculated in the volumetric space of gray matter. Some measures, such as ReHo, can be calculated in the surface space of cortical gray matter as done for cortical thickness, which might make ReHo and structural measures more comparable (Jiang and Zuo, 2016). FA measures in the current study were calculated from a gray matter atlas with a typical dMRI model. Another FA measure, microscopic FA, is more sensitive to the FA values in gray matter areas, which could be considered in certain studies (Arezza et al., 2021). Future studies may consider different paradigms for harmonizing the MRI measures across brain morphologies to further understand these relationships.
Conclusions
Here, we characterized correspondence between measures and across regions during brain development in early childhood. Functional brain measures showed mostly matched developmental patterns, while brain volume and cortical thickness had a mix of matched and mismatched developmental patterns across brain regions. The patterns in brain volume and cortical thickness were quite stable across the early years and successfully predicted individual scans from prior data. These findings provide more evidence on how complex brain systems develop during the early years, suggesting a paradigm to investigate brain development with a more comprehensive perspective. Our findings lay the foundation for future investigations of different ages and populations to see if aspects such as environmental factors and neurodevelopmental disorders alter developmental match and mismatch patterns among brain areas and modalities, and how these patterns relate to behavioral outcomes.
Footnotes
Acknowledgments
C.L. received funding from the Canada Research Chair Program and the Jacobs Foundation Research Fellowship. J.R. was supported by the Natural Sciences and Engineering Research Council (NSERC) Canada Graduate Scholarship—Masters scholarship and the Alberta Graduate Excellence Scholarship (AGES)—Masters scholarship. M.L. was supported by the medical science doctoral scholarship from the Cummings School of Medicine at the University of Calgary.
Authors’ Contributions
X.L.: Writing original draft (lead), data analysis (lead), methodology (lead), review and editing (lead). M.L.: Data analysis (supporting), review and editing (supporting). J.R.: Data analysis (supporting), review and editing (supporting). J.E.R.: Data analysis (supporting), review and editing (supporting). C.L.: Conceptualization (lead), review and editing (equal).
Author Disclosure Statement
C.L.’s spouse is an employee of General Electric Healthcare; other authors report no conflicts of interest.
Funding Information
This work was supported by the Canadian Institutes of Health Research (CIHR) (funding reference numbers: IHD-134090 and MOP-136797, New Investigator Award to CL), Canada Research Chair Program, the Jacobs Foundation Research Fellowship, the Natural Sciences and Engineering Research Council (NSERC) Canada Graduate Scholarship—Masters scholarship, the Alberta Graduate Excellence Scholarship (AGES)—Masters scholarship and the medical science doctoral scholarship from the Cummings School of Medicine at the University of Calgary.
Supplementary Material
Supplementary Figure S1
Supplementary Table S1
References
Supplementary Material
Please find the following supplemental material available below.
For Open Access articles published under a Creative Commons License, all supplemental material carries the same license as the article it is associated with.
For non-Open Access articles published, all supplemental material carries a non-exclusive license, and permission requests for re-use of supplemental material or any part of supplemental material shall be sent directly to the copyright owner as specified in the copyright notice associated with the article.