
Abstract
Background:
The study of task-driven dynamic adaptive graph sparsity patterns in Alzheimer’s disease (AD) analysis is of great importance, as it allows for better focus on regions and connections of interest and enhances task sensitivity.
Methods:
In this study, we introduced a task-driven dynamic adaptive graph sparsity model (called task-driven radiomics-based morphological brain network [Task-radMBNet]) for AD diagnosis based on radiomics-based morphological brain network (radMBN). Specifically, the Task-radMBNet was established by devising a connectivity feature-based graph convolutional network (GCN) channel (called a connectivity-GCN channel) and a radiomics feature-based GCN channel (called a radiomics-GCN channel), where the two GCN channels shared a same dynamic sparse brain network in graph convolution but worked for different aims separately. The connectivity-GCN channel dynamically learned the graph’s sparse topology that best suits the target task, while the radiomics-GCN channel combined radiomics node features and dynamic topology to improve AD diagnostic accuracy.
Results:
The Task-radMBNet achieved superior classification accuracy of 87.8% and 86.0% in early AD diagnosis across a total of 1273 subjects within the AD Neuroimaging Initiative and European Diffusion Tensor Imaging (DTI) Study on Dementia databases. We also visualized the topology heat map and important connectivity under different network sparse settings.
Conclusions:
The results demonstrated significant promise in the diagnosis of neurological disorders by integrating Task-radMBNet with radMBN.
Impact Statement
This study introduced the task-driven radiomics-based morphological brain network model, significantly enhancing early Alzheimer’s disease diagnosis accuracy (87.8% and 86.0%). By integrating dynamic adaptive graph sparsity and radiomics features, this model showed great potential in diagnosing neurological disorders, advancing the field of medical imaging analysis using graph convolutional networks.
Introduction
Brain networks are widely studied for early diagnosis of Alzheimer’s disease (AD) due to their ability to capture complex inter-regional relationships in the brain (Gaiteri et al., 2016; Leng et al., 2023; Song et al., 2023). Despite significant progress, one critical challenge lies in determining an optimal sparsity pattern for brain networks that aligns with disease-specific characterization tasks (Ginestet et al., 2011; Zhu et al., 2021). A common practice in brain network studies is to apply a fixed threshold to the connectivity matrix—typically constructed using the Pearson correlation coefficient (PCC)—to enforce sparsity, an approach known as the individual-level sparse setting (Yin et al., 2021). However, this fixed threshold approach assumes a static network structure, ignoring the potential for dynamic adjustments to vertices or edges as the graph evolves during analysis. This static nature can be particularly limiting in the context of complex brain network dynamics, such as those observed in functional magnetic resonance imaging (fMRI) studies, where network connectivity often fluctuates over time (Chen and Zhong, 2022; Zhu et al., 2022). In contrast, group-level sparse settings aim to jointly estimate connectivity across multiple participants, offering improved stability and reliability in some scenarios (Wee et al., 2014; Zhang et al., 2019b). However, both individual-level and group-level settings are inherently sample-driven—they prioritize the characteristics of the study population but overlook task-specific requirements, such as those for disease classification or prognosis (Qiao et al., 2018). This limitation highlights the need for a task-driven dynamic sparsity pattern, which allows the network structure to adapt dynamically based on the requirements of a specific analytical task, such as AD classification.
Graph deep learning has emerged as a promising approach to address the limitations of static sparsity patterns. For instance, Zhu et al. introduced a graph deep learning framework incorporating dynamic graph learning for AD diagnosis, which adapts neighborhood relationships to produce robust node embeddings and improve classification (Zhu et al., 2022). Leng et al. propose Brain-SubGNN, which constructs task-oriented brain networks from T1-MRI, adaptively identifies and enhances critical subgraphs to capture local and global brain attributes, and demonstrates effectiveness in understanding and diagnosing early-stage dementia (Leng et al., 2024). These methods have demonstrated the potential of dynamic graph learning to improve AD diagnostic performance while offering insights into disease-relevant connectivity patterns.
This study focuses on a task-specific dynamic graph sparsity model for radiomics-based morphological brain networks (radMBNs) derived from T1-weighted imaging (T1WI). Compared to brain networks constructed using fMRI-BN or diffusion MRI-BN (dMRI-BN), radMBNs offer a significant advantage in clinical translation due to the widespread availability and routine acquisition of T1WI in clinical practice (Hua et al., 2023; Zhao et al., 2021). Radiomics, which extracts quantitative features from medical images, enables radMBNs to capture subtle and biologically meaningful patterns often undetectable by human observation (Lambin et al., 2017; Tomaszewski and Gillies, 2021; Zhang et al., 2023). Previous studies have shown that radMBNs can identify distinct subtypes and abnormalities in mild cognitive impairment (MCI) (Zhao et al., 2022). However, the application of dynamic sparsity patterns to radMBNs for AD classification has not been well explored.
To address this gap, we propose task-driven radMBN (Task-radMBNet), a dynamic graph sparsity model specifically designed for AD classification. The model is structured around two graph convolutional network (GCN) channels: (1) Connectivity feature-based GCN channel (connectivity-GCN channel): This channel dynamically refines the sparse topology of the brain network by aggregating connectivity features, enabling adaptive adjustments to the connectivity matrix during graph evolution. (2) Radiomics feature-based GCN channel (radiomics-GCN channel): This channel aggregates radiomics features extracted from T1WI, focusing on optimizing feature representation for AD classification based on the sparse topology generated by the connectivity-GCN channel.
The two channels share a common dynamic sparse topology but operate with distinct objectives, ensuring that the model captures both structural connectivity and radiomics feature representation. Validated on 1273 subjects from two publicly available datasets, Task-radMBNet demonstrates exceptional diagnostic accuracy and interpretability by visualizing disease-relevant topological patterns. The primary contributions of this study include: Task-driven dynamic sparsity adjustment: Task-radMBNet introduces a novel framework for dynamically adjusting the sparse topology of radMBNs, aligning graph structures with AD-specific classification tasks. Dual-channel architecture: By integrating connectivity-based and radiomics-based GCN channels, the model effectively balances topology refinement and feature aggregation for disease diagnosis. Radiomics feature integration: Leveraging T1WI-derived radiomics features enhances the robustness and clinical translational potential of the proposed method. Enhanced interpretability: Visualization of dynamically generated sparse graphs provides insights into disease-specific alterations in brain connectivity, enabling personalized and reliable diagnostic outcomes.
Materials and Methods
Participants
In this study, a total of 1273 subjects were identified from two publicly available databases the AD Neuroimaging Initiative database (ADNI) (http://adni.loni.usc.edu) and the European DTI Study on Dementia database (EDSD) (http://neugrid4you.eu). The demographic information is summarized in Table 1.
Demographic Information of the Subjects from Publicly Available Databases of ADNI and EDSD
ADNI, Alzheimer’s disease neuroimaging initiative database; EDSD, European DTI Study on Dementia database; MMSE, Minimum Mental State Examination.
Data processing and radMBN construction
For each individual’s T1WI scan, the gray matter volume (GMV) map of the whole brain was segmented out via the CAT12 toolkit (http://dbm.neuro.uni-jena.de/cat/) with the standardized procedures as study (Zhang et al., 2023). The gray matter image was then aligned to the Montreal Neurological Institute space using a combined linear and nonlinear registration (including N4 bias field correction). The standard procedures regarding division are shown in Supplementary Data. These standard procedures regarding division help reduce the effects of different source data. Experimental results from various datasets show that after the same data preprocessing, the model performs similarly across different databases (see the Results section). On one hand, this demonstrates that data preprocessing effectively reduces the differences between source data from different origins. On the contrary, it shows that the model has good robustness to data from different databases.
The radMBN was established on the calculated GMV feature map. First, the same well-defined radiomics features (N = 25) as the study (Zhao et al., 2021), including intensity and texture features, were calculated for each automated anatomical labeling-derived region of interest (AAL-derived ROI) (N = 90) (https://github.com/YongLiulab). Specifically, We extracted the same 47 radiomics features for each brain region as in the work (Zhao et al., 2021), including 14 intensity features and 33 texture features. After removing some redundant features (highly correlated with other features) 25 radiomics features including seven intensity features and 18 texture features were retained. In our study, we used the same radMBN construction method proposed by (Zhao et al., 2021) The effectiveness of the radiomics brain network constructed based on these 25 features in the AD diagnostic task has been demonstrated (Song et al., 2024; Zhu et al., 2024). The study demonstrated the reliability of the radiomics brain network obtained from the AAL atlas-based construction by validating its reproducibility on different datasets (Zhao et al., 2021). Multiple studies (Song et al., 2024; Zhao et al., 2023; Zhao et al., 2022; Zhu et al., 2024) have demonstrated the significance of the radiomics brain network obtained from AAL atlas-based construction in the study of brain diseases. Therefore, in this study, the radMBN was constructed based on the AAL atlas from the T1WI scan imaging of each subject. Then, each radiomics feature was normalized across all ROIs capitalizing upon a common min–max method. At last, the radMBN with the size of 90 × 90 for each individual was established by the PCC between the radiomics features of each pair of ROIs.
The proposed Task-radMBNet for AD analysis
The overall architecture of the proposed Task-radMBNet is exhibited in Figure 1. The task-driven dynamic graph sparsity pattern under the Task-radMBNet was established by devising a connectivity-GCN channel and a radiomics-GCN channel, where the two GCN channels shared the same dynamic sparse brain network in graph convolution but worked for different aims separately. The connectivity-GCN channel was to dynamically update the topology sparsity of the brain network by feature aggregation, while the radiomics-GCN channel was to aggregate the features for AD analysis based on the sparse topology generated by the connectivity-GCN channel. In our study, the “task” means the AD classification task. In the backpropagation process, the connectivity-GCN channel was updated to establish a dynamic sparsity graph, while the radiomics-GCN channel was updated to aggregate the node features based on the dynamic sparsity graph obtained in the connectivity-GCN channel. Since the backpropagation process was driven by the AD classification task, the dynamic sparsity graph establishment and the node feature aggregation were called task-driven. All the codes of Task-radMBNet have been released via GitHub (https://github.com/FindBrain/Task-radMBNet).
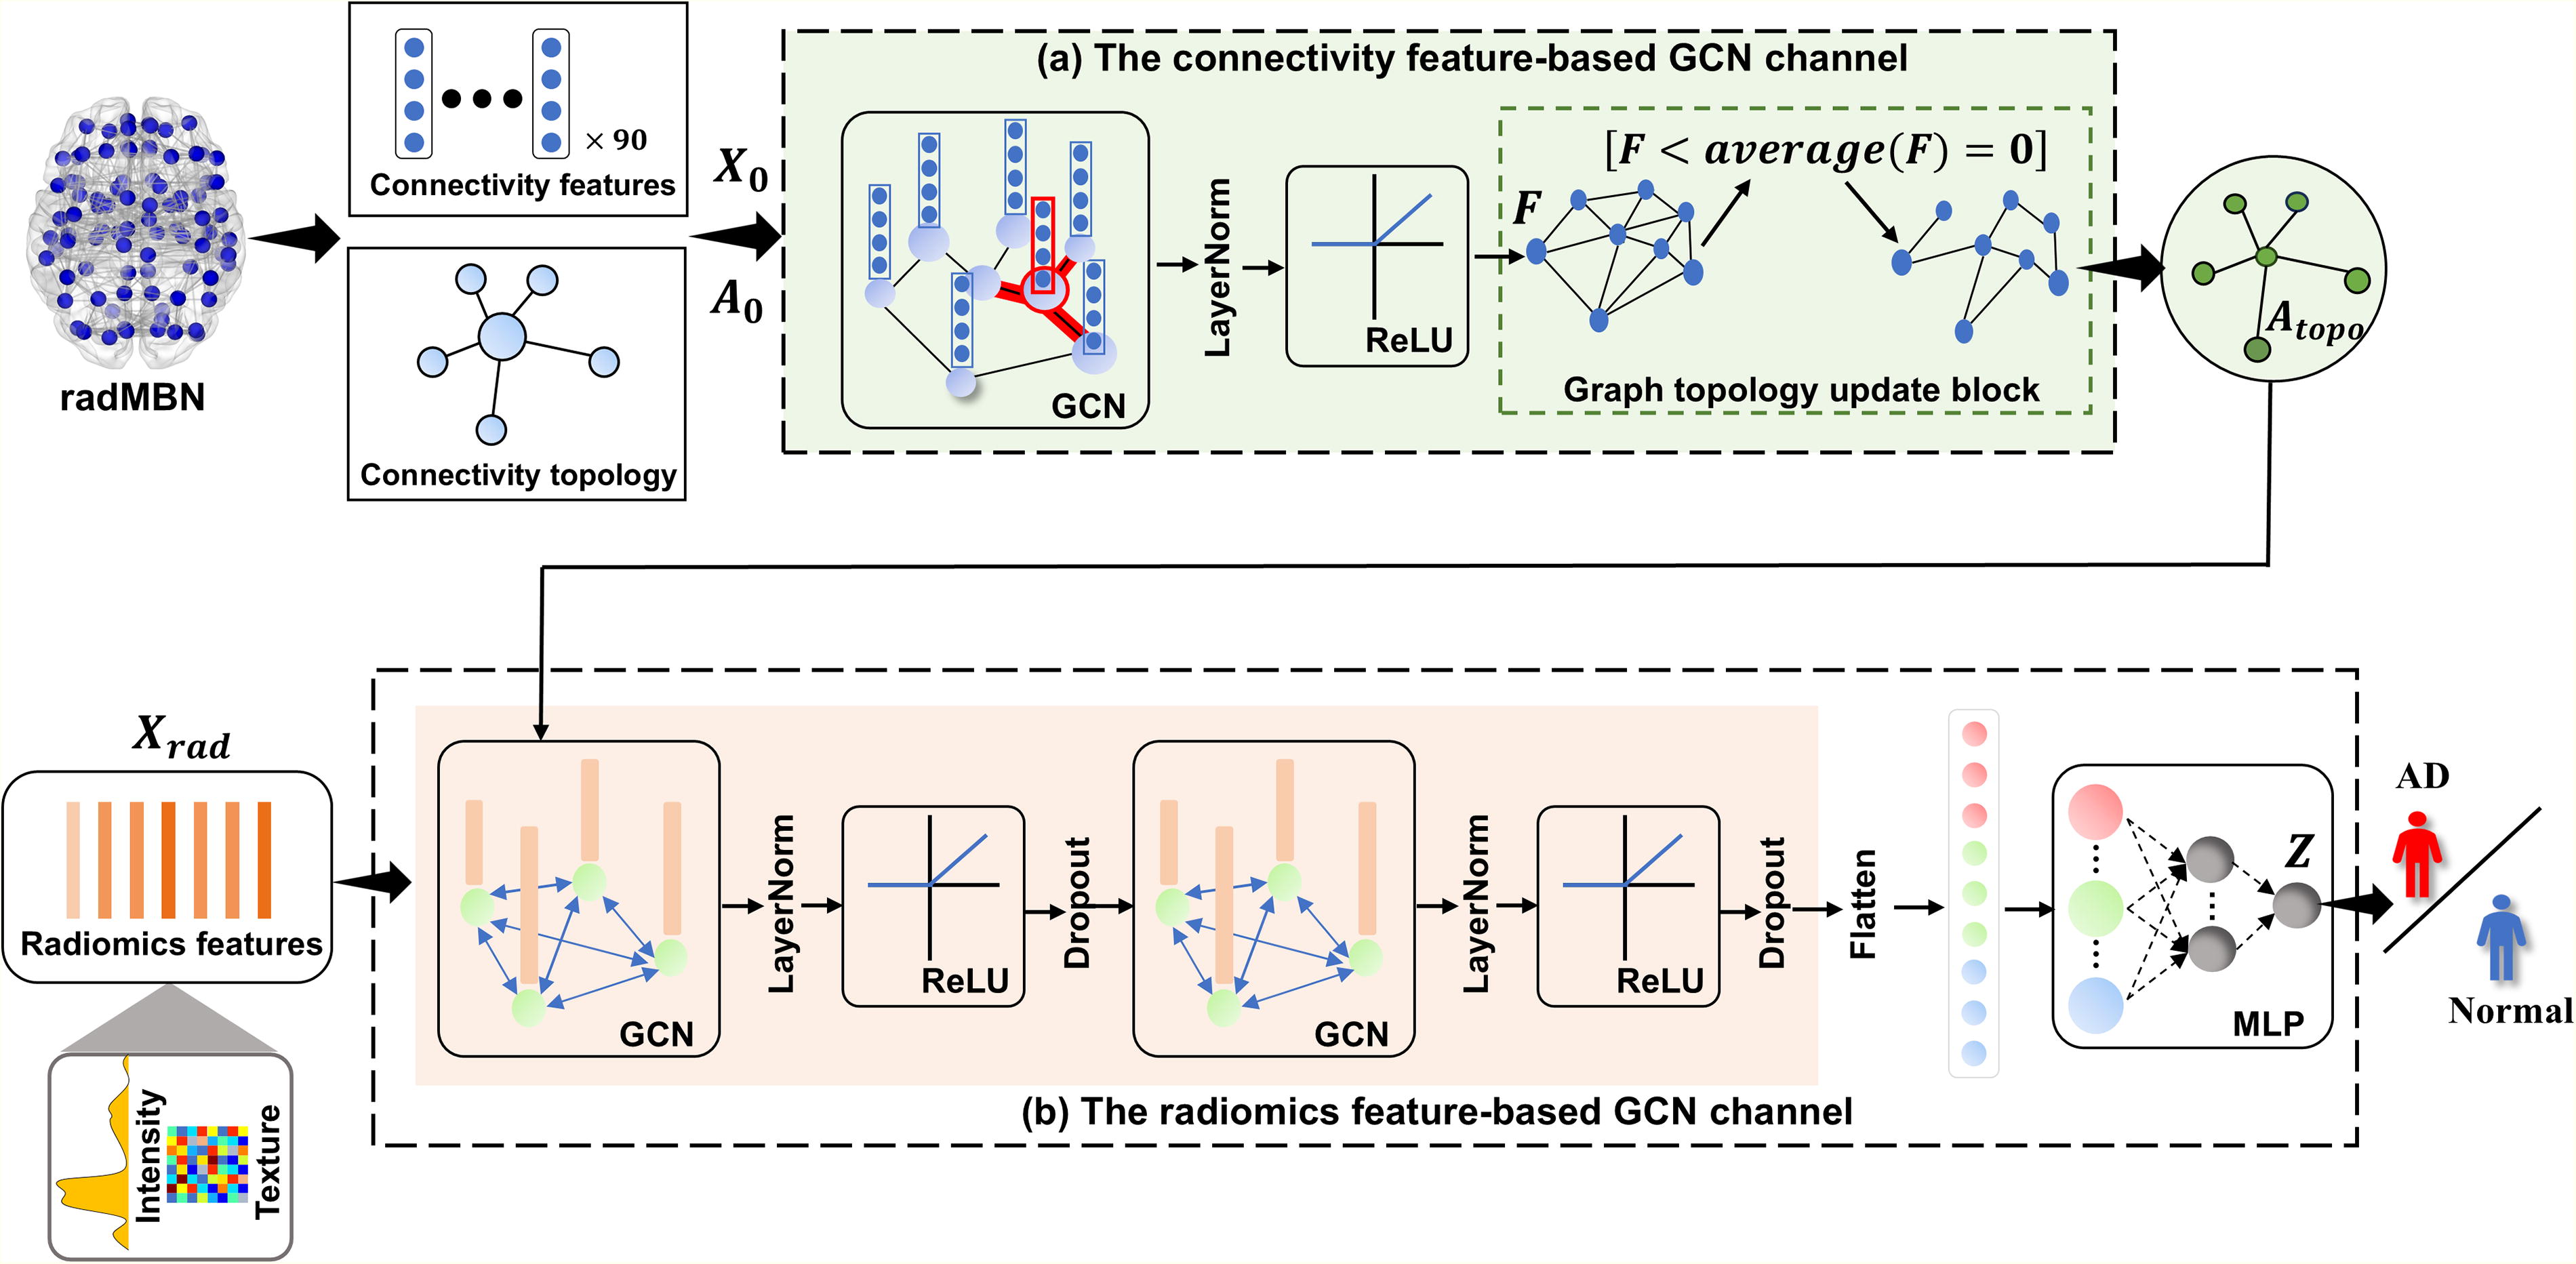
Architecture of the proposed Task-radMBNet.
The connectivity-GCN channel: Given the brain network radMBN established in the Data processing and radMBN construction section and represented by a graph
For clarity, the connectivity topology matrix The GCN block was constituted by a GCN layer, a LayerNorm layer, and a Rectified Linear Unit (ReLU) layer. The normalized matrix The graph topology update block calculated the average value of feature matrix
The radiomics-GCN channel: Given the above topology matrix
Experimental comparison setting
Experimental setting
We employed the Adam optimizer for training the Task-radMBNet using PyTorch 2.0.1 with an initial learning rate of 3 × 10⁻⁴, a weight decay rate of 1 × 10⁻⁴, and a batch size of 4. Furthermore, we employed the cross entropy loss function for the training process. The ADNI dataset was split into a training set, validation set, and testing set with a ratio of 8:1:1. The accuracy (ACC), sensitivity (SEN), specificity (SPE), and the area under the receiver operating characteristic (AUC) were employed using the 10-fold cross-validation to evaluate the Task-radMBNet in AD diagnostic performance. In addition, to address the data imbalance, we set the model prediction score threshold as
Experimental comparison
To validate the superiority of the task-driven dynamic graph sparsity pattern Task-radMBNet over other sparse patterns of the brain network, both individual-level sparse patterns and group-level sparse patterns were employed for comparison. Specifically, the individual-level sparse pattern was obtained by applying different thresholds on the PCC matrix of radMBN with the PCC threshold determined between 0 and 0.9 (step 0.1, generating 10 individual-level sparse graphs). The group-level sparse pattern was calculated by jointly estimating connections across all participants with the L2,1-norm penalization (Wee et al., 2014) with the value λ which was used to weight the penalization term determined between 0.01 and 0.1 (step 0.01, generating 10 group-level sparse graphs).
Finally, the proposed task-driven dynamic graph sparsity pattern Task-radMBNet was compared with the individual-level sparse patterns and the group-level sparse patterns above by adopting the linear model MLP (Jyotiyana and Kesswani, 2020), the graphical convolutional neural network (Kipf and Welling, 2016), and the CNN (Song et al., 2019) on the two publicly available databases of ADNI and EDSD.
Results
Comparison of NC versus AD classification performance
Tables 2 and 3 compared the task-driven dynamic graph sparsity pattern Task-radMBNet with the individual-level sparse patterns by adopting MLP (Jyotiyana and Kesswani, 2020), GCN (Kipf and Welling, 2016), and CNN (Song et al., 2019) on the ADNI and EDSD databases, respectively. A total of 10 individual-level sparse graphs were calculated for comparison by determining the PCC threshold between 0 and 0.9 with step 0.1. The experimental results demonstrated that the Task-radMBNet achieved superior AD versus NC classification performance with ACC = 0.878, SEN = 0.706, SPE = 0.958, AUC = 0.920 in the ADNI dataset, and ACC = 0.860, SEN = 0.785, SPE = 0.910, AUC = 0.928 in EDSD dataset.
Comparison of the Task-Driven Dynamic Graph Sparsity Pattern Task-radMBNet with the Individual-Level Sparse Patterns (PCC Threshold Determined Between 0 and 0.9 with Step 0.1, Generating 10 Individual-Level Sparse Graphs) by Adopting MLP (Jyotiyana and Kesswani, 2020), GCN (Kipf and Welling, 2016), and CNN (Song et al., 2019) on the ADNI Database
Best in bold.
ACC, accuracy; ADNI, Alzheimer’s disease neuroimaging initiative database; AUC, area under the receiver operating characteristic; CNN, convolutional neural network; GCN, graph convolutional network; MLP, multilayer perceptron; PCC, Pearson correlation coefficient; SEN, sensitivity; SPE, specificity; Task-radMBNet, task-driven radiomics-based morphological brain network.
Comparison of the Task-Driven Dynamic Graph Sparsity Pattern Task-radMBNet with the Individual-Level Sparse Patterns (PCC Threshold Determined Between 0 and 0.9 with Step 0.1, Generating 10 Individual-Level Sparse Graphs) by Adopting MLP (Jyotiyana and Kesswani, 2020), GCN (Kipf and Welling, 2016), and CNN (Song et al., 2019) on the EDSD Database
Best in bold.
ACC, accuracy; AUC, area under the receiver operating characteristic; CNN, convolutional neural network; EDSD, European DTI Study on Dementia; GCN, graph convolutional network; MLP, multilayer perceptron; PCC, Pearson correlation coefficient; Task-radMBNet, task-driven radiomics-based morphological brain network; SEN, sensitivity; SPE, specificity.
Likewise, Tables 4 and 5 summarized the experimental comparison between the task-driven dynamic graph sparsity pattern Task-radMBNet and the group-level sparse patterns by adopting MLP (Jyotiyana and Kesswani, 2020), GCN (Kipf and Welling, 2016), and CNN (Song et al., 2019) on the ADNI database. The value λ which was used to weight the penalization term was determined between 0.01 and 0.1 with step 0.01. The Task-radMBNet also outperformed alternatives under comparison with superior performance regarding AD versus NC classification.
Comparison of the Task-Driven Dynamic Graph Sparsity Pattern Task-radMBNet with the Group-Level Sparse Patterns (the Value λ Which Was Used to Weight the Penalization Term Determined Between 0.01 and 0.1 with Step 0.01, Generating 10 Group-Level Sparse Graphs) by Adopting MLP (Jyotiyana and Kesswani, 2020), GCN (Kipf and Welling, 2016), and CNN (Song et al., 2019) on the ADNI Database
Best in bold.
ACC, accuracy; ADNI, Alzheimer’s disease neuroimaging initiative database; AUC, area under the receiver operating characteristic; CNN, convolutional neural network; GCN, graph convolutional network; MLP, multilayer perceptron; PCC, Pearson correlation coefficient; SEN, sensitivity; SPE, specificity; Task-radMBNet, task-driven radiomics-based morphological brain network.
Comparison of the Task-Driven Dynamic Graph Sparsity Pattern Task-radMBNet with the Group-Level Sparse Patterns (the Value λ Which Was Used to Weight the Penalization Term Determined Between 0.01 and 0.1 with Step 0.01, Generating 10 Group-Level Sparse Graphs) by Adopting MLP (Jyotiyana and Kesswani, 2020), GCN (Kipf and Welling, 2016), and CNN (Song et al., 2019) on the EDSD Database
Best in bold.
ACC, accuracy; AUC, area under the receiver operating characteristic; CNN, convolutional neural network; EDSD, European DTI Study on Dementia; GCN, graph convolutional network; MLP, multilayer perceptron; PCC, Pearson correlation coefficient; SEN, sensitivity; SPE, specificity; Task-radMBNet, task-driven radiomics-based morphological brain network.
Visualization comparison of sparse topology graph between dynamic, individual-level, and group-level sparse settings
To reveal the underlying mechanism in facilitating the AD versus NC classification of the Task-radMBNet over others, we visualized an averaged heat map of dynamic, individual-level, and group-level brain networks across all participants for comparison. In order to unify the value range of the visualized heat maps, we normalize those heat maps to the range of 0–1. Figure 2 carried out a visualization comparison between sparse graphs between individual-level settings and proposed dynamic settings on ADNI and EDSD databases. Figure 3 carried out a visualization comparison between sparse graphs between the group-level setting and the proposed dynamic setting on ADNI and EDSD databases. The visualization comparison demonstrated that the dynamic graph pattern in the Task-radMBNet exhibited a relatively concentrated connection pattern to some specific brain regions, highlighting the potential contributions of brain regions when applying brain network in the AD versus NC classification task.
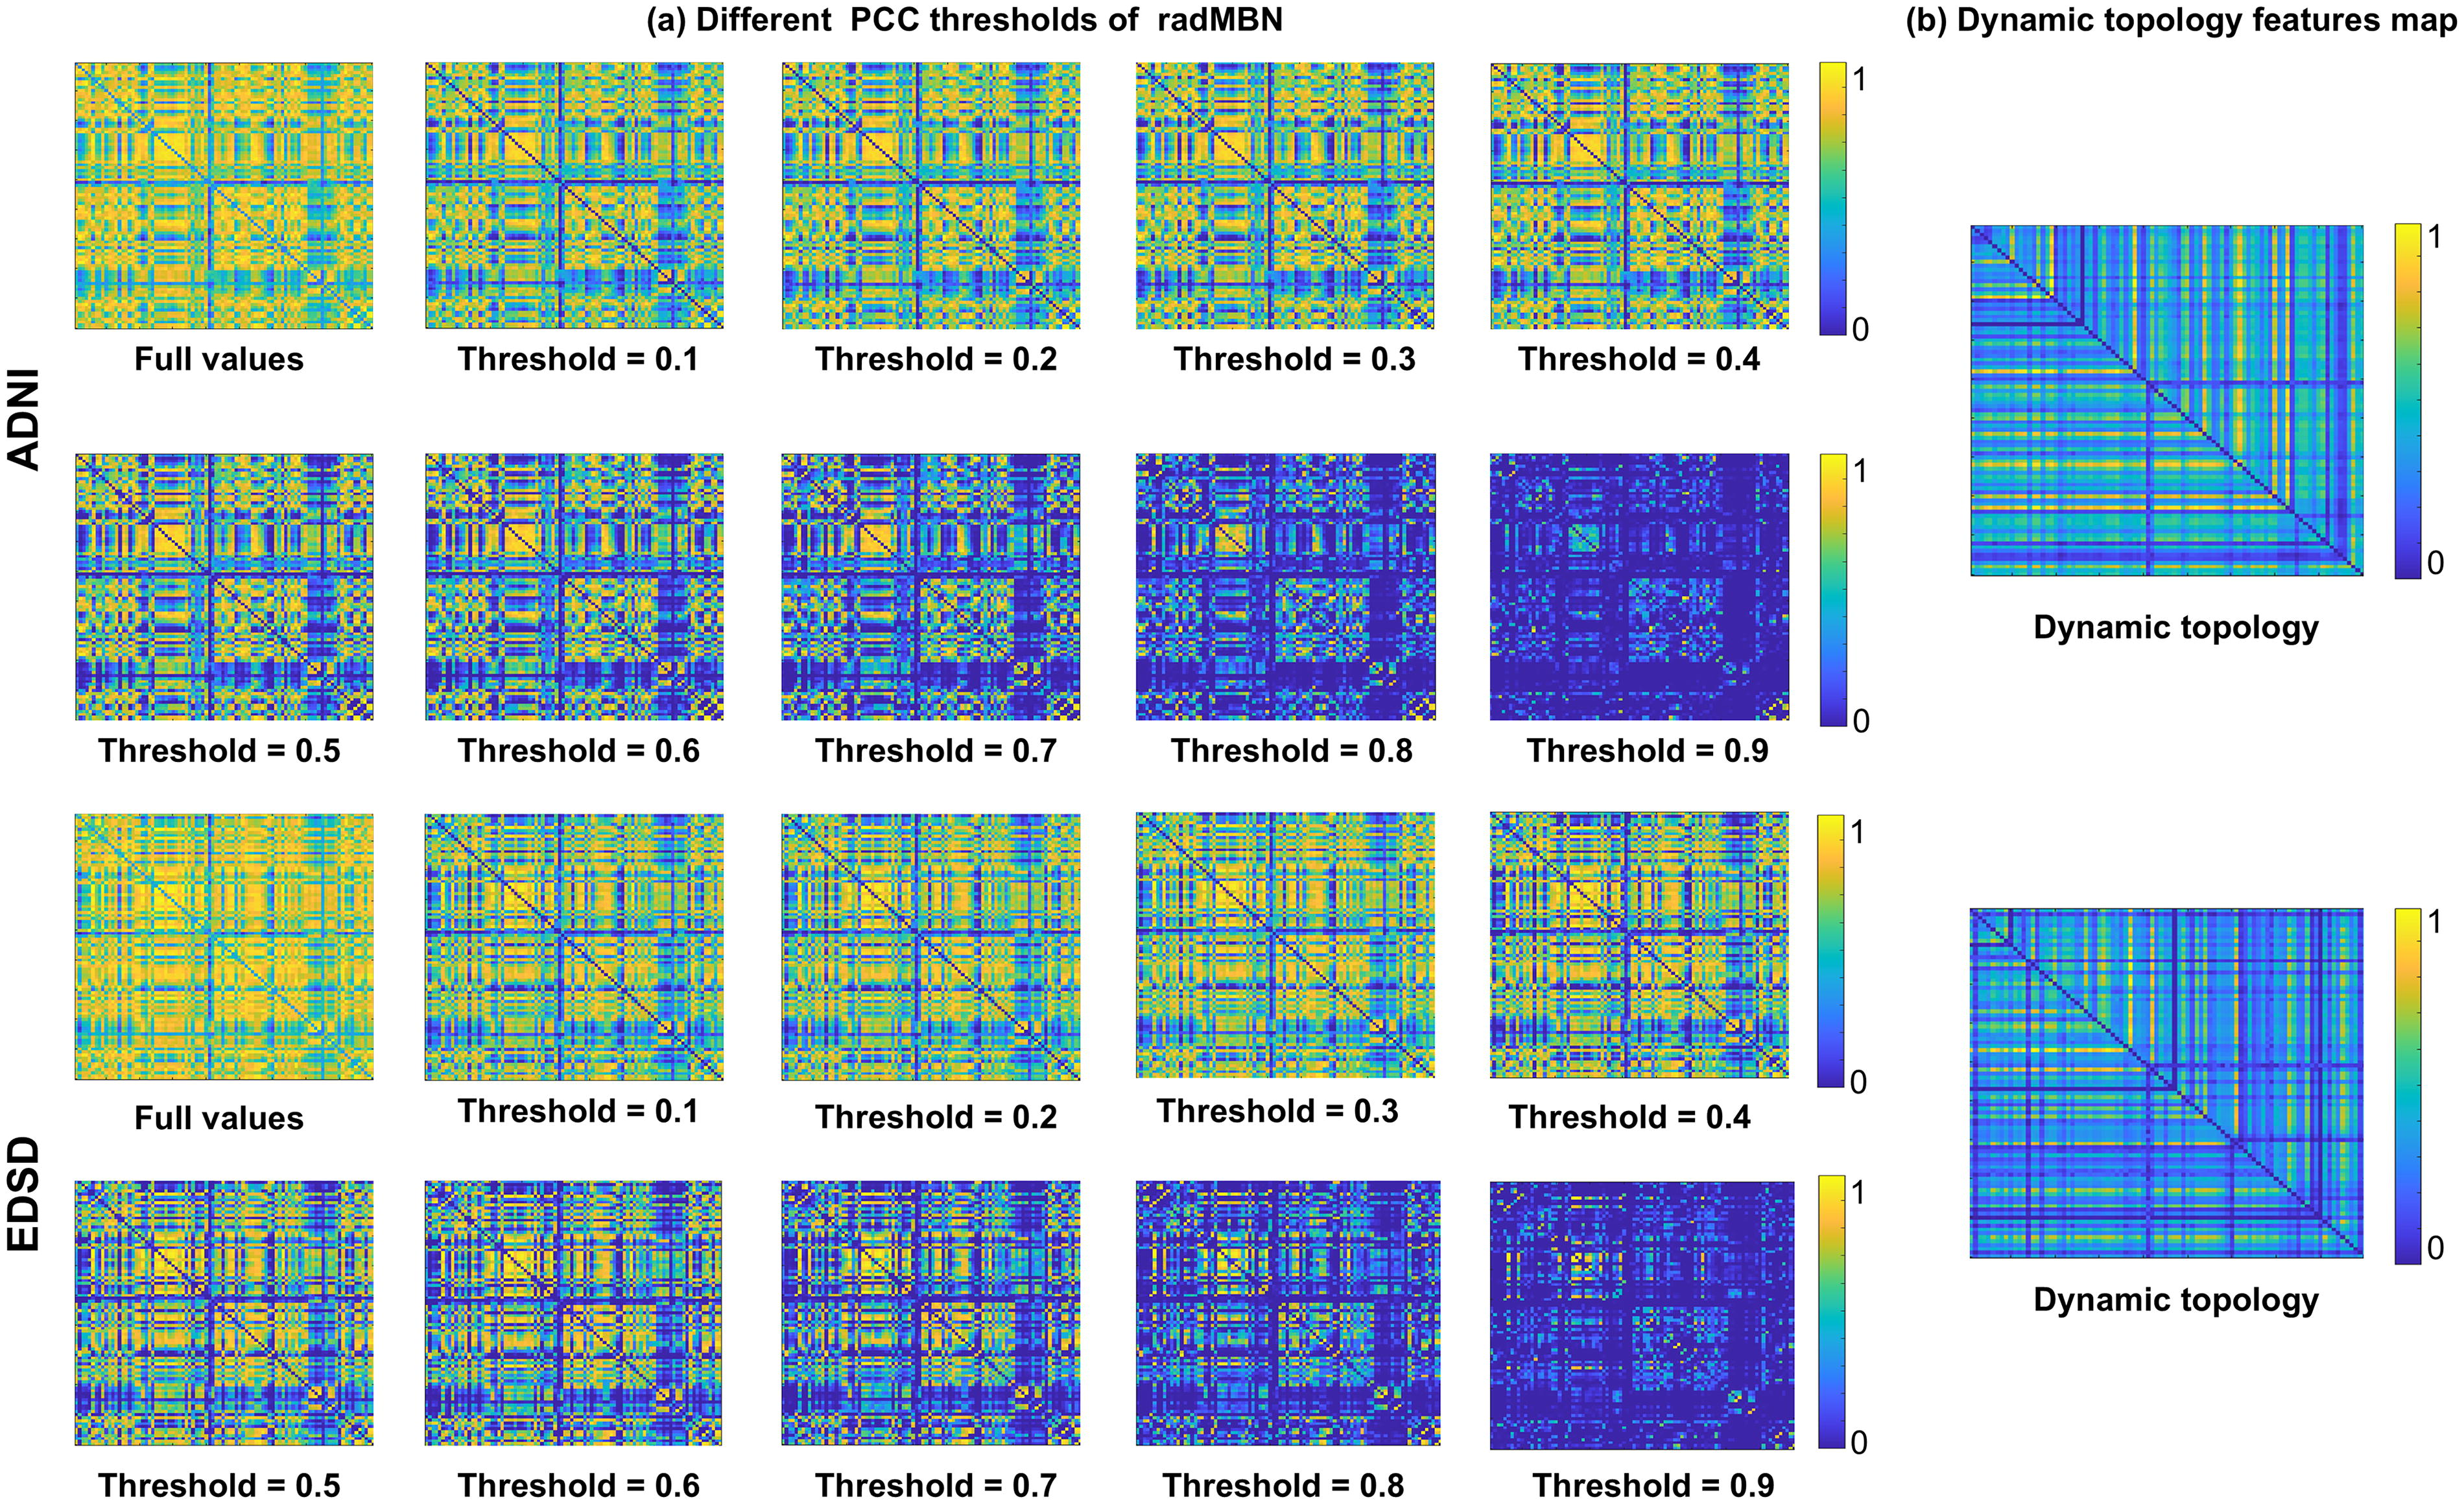
Visualization comparison between sparse graphs between
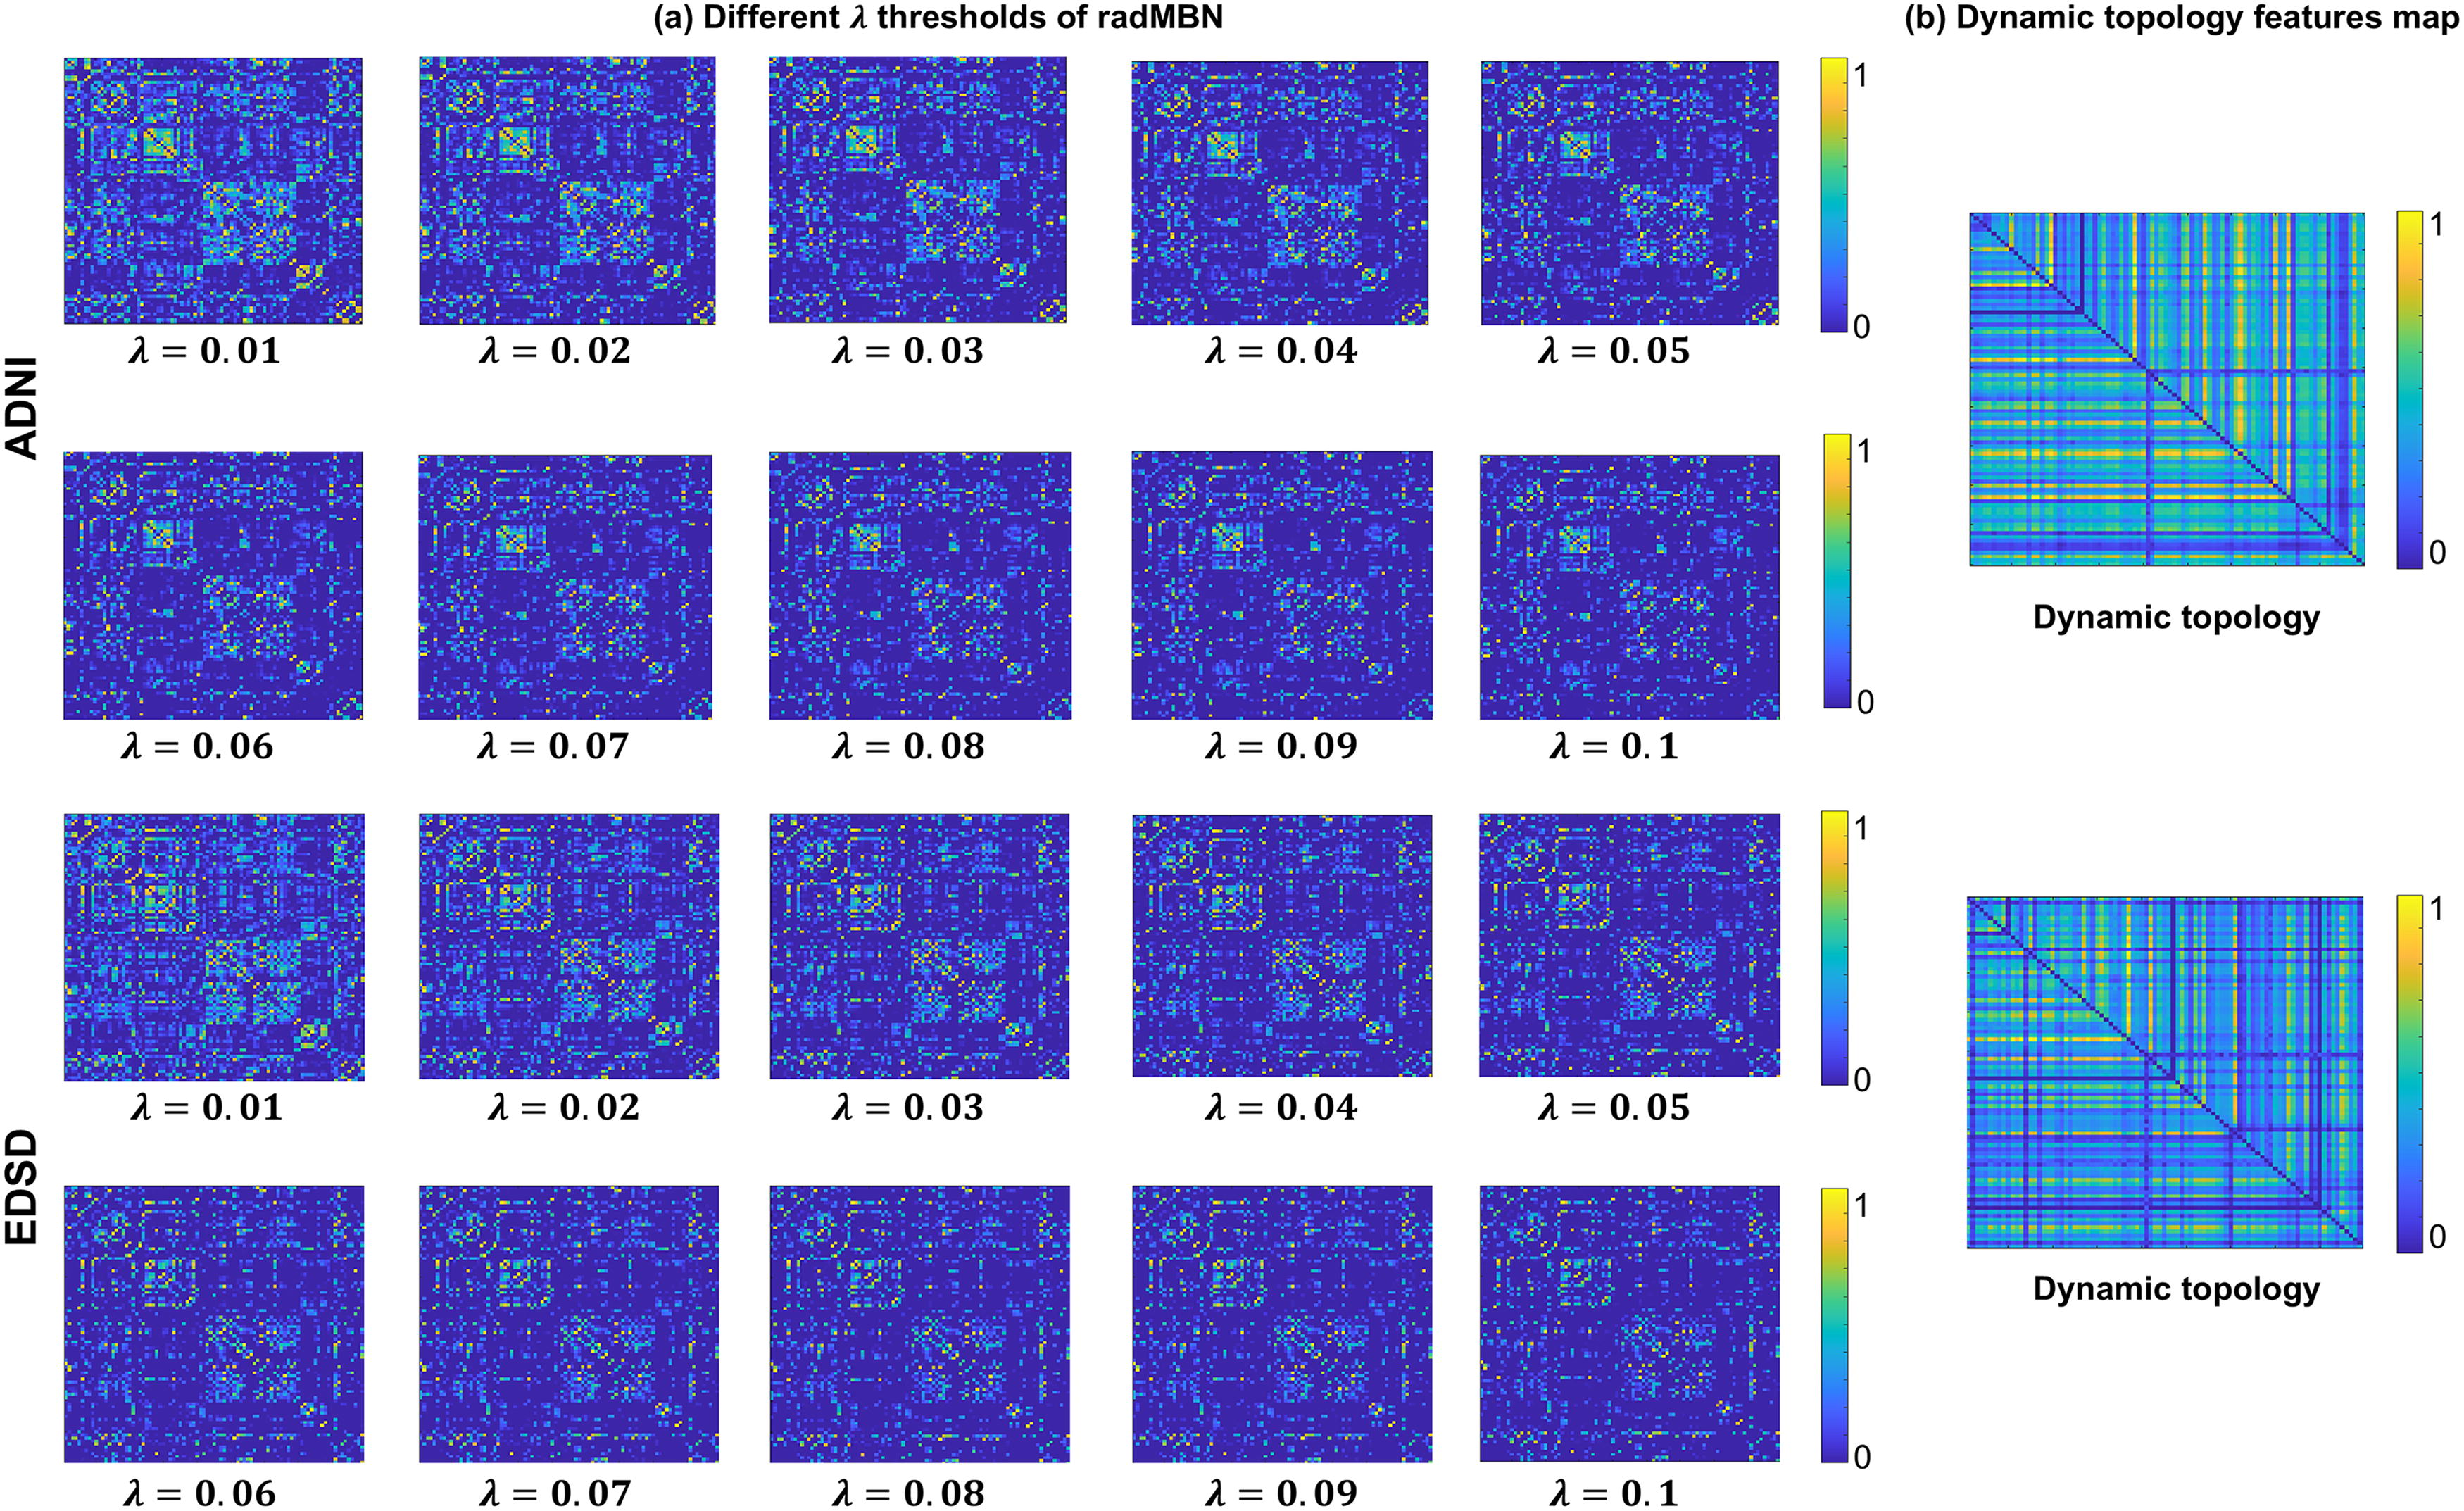
Visualization comparison between sparse graphs between
The top 50 connectivity visualization comparisons between dynamic, individual-level, and group-level sparse settings
According to Figures 2 and 3, the individual-level sparse setting and the group-level sparse settings were suitable to reveal the specific connections between brain regions, while the dynamic sparse setting was suitable to reveal the specific brain regions that were densely concentrated. Therefore, we visualized the top 50 brain network connections of the connectivity matrix on both ADNI and EDSD databases, and the dynamic sparse setting exhibited a more concentrated pattern to the putamen and temporal lobe (Chan et al., 2001; de Jong et al., 2008). These regions have been reported to be associated with the process of AD in several studies (Chan et al., 2001; de Jong et al., 2008), highlighting their contributions to AD versus NC classification task when applying the task-driven dynamic graph sparsity pattern of Task-radMBNet.
Discussion
The dynamic graph establishment has been widely studied in brain network analysis but rarely reported on the radMBN which is conducted on the routinely acquired T1WI protocol. In the present study, a task-driven dynamic graph sparsity model (called Task-radMBNet) was established for AD characterization. In contrast to the fixed topology of radMBN fed for disease classification, the most benefit of the Task-radMBNet was adopting a dynamic graph module to learn the sparse topology of radMBN that was most adaptive for the specific classification task. On the ADNI database, the Task-radMBNet reached ACC = 0.878, SEN = 0.706, SPE = 0.958, and AUC = 0.920 in early diagnosis of AD. On the EDSD database, the Task-radMBNet reached ACC = 0.860, SEN = 0.785, SPE = 0.910, and AUC = 0.928. Both outperformed alternative methods under comparison including the MLP model, GCN model, and CNN model under 10 individual-level sparse graphs (Tables 2 and 3) and 10 group-level sparse graphs (Tables 4 and 5). The sparse graphs between dynamic, individual-level, and group-level patterns were also visualized for comparison in Figures 2–4, exhibiting a more concentrated pattern in the proposed dynamic sparse graph pattern.

Visualizing the top 50 brain network connections on both ADNI and EDSD databases under the
Traditionally, brain networks have been pre-established and fixed before being fed into deep learning models (Wen et al., 2022; Yao et al., 2021). However, this static approach restricts adaptability to the data distribution within both training and unseen testing datasets. Consequently, this approach lacks the flexibility needed to fine-tune classifiers effectively for specific testing data. In this study, the superior performance of the Task-radMBNet in AD characterization is supported by the underlying and integrated task-driven and dynamic-update mechanisms. Regarding the task-driven mechanism, the Task-radMBNet dynamically adjusts the relationships between nodes and edges based on the specific target task. This enables dynamic graph learning to better capture changes in relationships between nodes, enhancing the classification performance of the Task-radMBNet (Li et al., 2018; Zou et al., 2023). As shown in Figures 2 and 3, the fixed sparse graph is constructed independently of the classification task and cannot dynamically consider the relationship between nodes and edges based on the target task (Akoglu et al., 2015). Regarding the dynamic-update mechanism, the connectivity-GCN channel enables the model to automatically adapt and adjust the graph’s topological structure during each training iteration. This method ensures the correct connections for each node and effectively mitigates the adverse impact of noise (Gan et al., 2022). The dynamic-update approach originates from the connectivity features of radMBN, followed by the connectivity-GCN channel module to update the graph’s topology. Experimental results in Tables 2–5 demonstrate that dynamic topology outperforms static topology in disease diagnosis. This is because a static topology-driven strategy overlooks the capability to aggregate connectivity features through GCN, while the update of the brain network topology can be derived and updated from node features, such as typical PCC values, according to the specific task. As shown in Figure 4, the expression of the dynamic-update mechanism of features is useful to better express the neuroscience explanation of brain regions.
The interpretability of deep learning is clinically important and helps to reveal the pathogenesis of brain diseases. The dynamic sparse approach in this article identifies important brain regions from brain networks, including the nucleus accumbens and temporal lobe, that are thought to be associated with AD. The study (Salgado and Kaplitt, 2015) has shown that the nucleus accumbens is involved in learning and motor control, including speech intelligibility, language function, and cognitive function, most of which are common clinical conditions in AD patients. The study (Koikkalainen et al., 2007) noted that brain disorders such as AD, Parkinson’s disease, and autism are accompanied by dysfunction of the nucleus accumbens. Human emotional memory is heavily dependent on subregions of the temporal lobe, the study (Berron et al., 2020) found that amyloid β-positive cognitively unimpaired individuals were mainly characterized by decreased functional connectivity between the medial temporal lobe and regions in the anterior–temporal system. The above findings also demonstrated the interpretability of the dynamic sparing approach proposed in this study, with the selection of important brain regions providing insights into the understanding of AD pathogenesis.
Overall, the integration of task-driven and dynamic-update mechanisms both improves classification performance and enhances the neuroscience interpretation of brain regions. Finally, the limitation of this study is that the Task-radMBNet needs to be further validated in more neurological disease analysis. In this study, we collected 1273 subjects for validation, of which, only these subjects were with AD. The various stages of AD progression (early and late) are critical for assessing its practical applicability. Therefore, in future work, we plan to perform subgroup analyses to evaluate the model’s performance across different AD stages.
Conclusion
In this study, the Task-radMBNet was proposed for early diagnosis of AD by the dynamic adaptive graph sparsity learning. The Task-radMBNet dynamically identifies the most suitable sparse topological structure for the target task, and compared to fixed graph sparse topological input models, it has demonstrated superior performance in early diagnosis of AD. Since radMBN continues to emerge as a potent tool for disease analysis, the integration of the Task-radMBNet with radMBN holds significant promise in the diagnosis of various neurological disorders.
Footnotes
Authors’ Contributions
L.S.: Conceptualization, data curation, and writing—original draft. Z.S.: Methodology, software, experiments, and writing—original draft. P.N.: Writing—review and editing. Q.Z.: Conceptualization, supervision, project administration, and funding acquisition.
Author Disclosure Statement
The authors declare that they have no known competing financial interests or personal relationships that could have appeared to influence the work reported in this article.
Funding Information
This work was supported by the Yantai City Science and Technology Innovation Development Plan (No. 2023XDRH006), the Natural Science Foundation of Shandong Province (No. ZR2020QH048), the Open Project of Key Laboratory of Medical Imaging and Artificial Intelligence of Hunan Province, Xiangnan University (No. YXZN2022002), and the Natural Science Foundation of Shandong Province (No. ZR2024MH072).
Supplementary Material
Supplementary Data
References
Supplementary Material
Please find the following supplemental material available below.
For Open Access articles published under a Creative Commons License, all supplemental material carries the same license as the article it is associated with.
For non-Open Access articles published, all supplemental material carries a non-exclusive license, and permission requests for re-use of supplemental material or any part of supplemental material shall be sent directly to the copyright owner as specified in the copyright notice associated with the article.