




Abstract
Background:
The brain’s complex functionality emerges from network interactions that go beyond dyadic connections, with higher-order interactions significantly contributing to this complexity. Homotopic functional connectivity (HoFC) is a key neurophysiological characteristic of the human brain, reflecting synchronized activity between corresponding regions in the brain’s hemispheres.
Materials and Methods:
Using resting-state functional magnetic resonance imaging data from the Human Connectome Project, we evaluate dyadic and higher-order interactions of three functional connectivity (FC) parameterizations—bivariate correlation, partial correlation, and tangent space embedding—in their effectiveness at capturing HoFC through the inter-hemispheric analogy test.
Results:
Higher-order feature vectors are generated through node2vec, a random walk-based node embedding technique applied to FC networks. Our results show that higher-order feature vectors derived from partial correlation most effectively represent HoFC, while tangent space embedding performs best for dyadic interactions.
Discussion:
These findings validate HoFC and underscore the importance of the FC construction method in capturing intrinsic characteristics of the human brain.
Impact Statement
The impact of this article on the literature is multifaceted. It offers insights into which method of functional connectivity construction best captures homotopic functional connectivity (HoFC), a significant characteristic of the human brain. In addition, it addresses an important gap in the literature by demonstrating that partial correlation is the most suitable connectivity construction method for random walk node embedding techniques. Furthermore, this work marks the first validation of HoFC through machine learning feature vectors. Finally, our study provides insights to validate machine learning methods using inherent characteristics of the human brain, rather than relying solely on traditional machine learning evaluation metrics.
Introduction
The brain’s intricate functionality emerges from the collective interactions among its various components, and a deeper understanding of this interplay enhances our understanding of this complexity (Sporns, 2012; Bassett and Sporns, 2017; Sporns, 2013, 2016b). Consequently, many studies have adopted a network approach to further investigate the brain’s underlying mechanisms (Van Den Heuvel and Hulshoff Pol, 2010; Bassett and Gazzaniga, 2011). A key element in analyzing the brain from a network perspective is the method of brain network construction. Typically, these networks are created and analyzed across three scales: micro, meso, and macro (Betzel and Bassett, 2017; Sporns, 2016a). At each scale, specific entities (nodes) and their interactions (edges) are defined based on the data modality, forming the respective brain network. It is critical that the definition of these nodes and edges accurately reflect the brain’s inherent neurophysiological characteristics (Bassett and Sporns, 2017; Dadi et al., 2019) to ensure the validity of subsequent analyses conducted using statistical or machine learning techniques.
Functional magnetic resonance imaging (fMRI) is a widely used modality to study the brain. It has revolutionized our understanding of human brain function, enabling researchers to visualize and investigate brain activity with high precision (Ogawa et al., 1990). Of particular interest in neuroimaging research is resting-state fMRI (rsfMRI), where spontaneous fluctuations in the brain’s activity are observed in the absence of any external stimuli (Buckner et al., 2013; Raichle et al., 2001; Biswal et al., 1995). Resting-state functional connectivity (FC) is derived from rsfMRI using statistical measures applied to the activity pattern of different brain regions. The resulting FC provides a comprehensive depiction of how different brain areas interact at a macro scale, leading to insights into the functional organization of the brain and its potential alterations in various neurological and psychiatric disorders (Van Den Heuvel and Hulshoff Pol, 2010; Fox and Greicius, 2010; Bassett et al., 2018; Mulders et al., 2015).
A pivotal element of rsfMRI analysis involves assessing FC. This evaluation is critical, as FC matrices form the basis for further analysis with machine learning and statistical techniques, with the expectation that these matrices accurately mirror the brain’s neurophysiological characteristics (Dadi et al., 2019; Sanchez-Romero and Cole, 2021). Among these characteristics, homotopic functional connectivity (HoFC) (Lowe et al., 1998; Salvador et al., 2005; Zuo et al., 2010)—the strong correlation between activities of corresponding brain regions across hemispheres—stands out as a fundamental and widespread characteristic, observed across humans and mammals (Salvador et al., 2005; Shen et al., 2015), and notably affected in various brain diseases and disorders (Tang et al., 2016; Hermesdorf et al., 2016). Despite its significance, the exploration of HoFC through machine learning methods remains limited, with most existing studies focusing on statistical analysis at the region of interest (ROI) or voxel level, highlighting a gap in the application of advanced analytical techniques to study this key neurophysiological characteristic (Jin et al., 2020).
Machine learning techniques are widely employed in FC analyses (Vergun et al., 2013; Khosla et al., 2019; Du et al., 2018). The key element of these techniques lies in extracting informative features from data. These features are then utilized in downstream tasks to draw conclusions. Feature vectors in FC can be extracted by treating each row as the feature vector for that specific region, capturing dyadic interactions. However, the potential to derive even more informative feature vectors exists by exploring higher-order interactions through unsupervised representation learning techniques. The fundamental concept of these techniques is to extract more informative feature vectors from the data. Since FC is a graph, graph representation learning techniques seem to be appropriate choices to be applied to FC to obtain more informative feature vectors. One of the main techniques in graph representation learning is the random walk (RW) node embedding, and node2vec (Grover and Leskovec, 2016) is one of the commonly used RW node embedding algorithms. Inspired by the word2vec model (Mikolov et al., 2013), this is an unsupervised representation learning algorithm on graphs (Goyal and Ferrara, 2018) and encodes higher-order interactions by performing random walks (RW) on network connectivity. The advantage of using node2vec for representation learning on FC compared to other methods, such as Graph Neural Networks (GNNs), is that node2vec utilizes information encoded in the structure of the graphs, which is particularly relevant in the case of FC. In contrast, GNNs require node features that are not straightforward to define in brain networks (Wu et al., 2021). In practice, this algorithm generates an embedding vector for each node, which serves as the learned higher-order feature vector for that node.
While dyadic interactions encompass a wealth of information, recent studies indicate that they might not fully capture interactions among brain regions (Rosenthal et al., 2018; Levakov et al., 2021). Consequently, a fundamental question arises: Do higher-order interactions, captured through RWs on FC, contain more information than dyadic interactions? If so, they should better represent the intrinsic organizational characteristics of the human brain, such as HoFC, compared to dyadic interactions. Some previous studies have shown the superiority of considering higher-order interactions in encoding brain structural connectivity (Levakov et al., 2021; Glasser et al., 2016). In addition, many studies have utilized node2vec for representation learning on FC (Chauhan and Choi, 2023; Rahimiasl et al., 2021; Gan et al., 2023; Lama et al., 2022). However, they have not investigated its superior performance compared to dyadic interactions.
In this study, we investigate the extent to which the FC (dyadic interactions), obtained from various parameterizations, and its embedding matrix higher-order functional interactions (FCE), obtained using a RW node embedding approach, reflect HoFC. Our investigation is guided by four primary objectives: (1) to examine whether machine learning is capable of validating HoFC by using FC and FCE, (2) to identify which FC parameterization better reflects HoFC and possesses greater neurobiological significance, (3) to assess whether considering higher-order interactions offers advantages over dyadic interactions in reflecting HoFC, and (4) to evaluate which FC parameterization, when subjected to RWs, is more meaningful and generates more informative feature vectors. Essentially, to pinpoint the FC parameterization that, through the lens of statistical dependencies between two regions, allows for a more meaningful traversal of the graph via RWs.
Method
Dataset
The analysis was conducted using resting-state fMRI time series of 100 independent subjects from human connectome project (HCP). Comprehensive information regarding the HCP dataset is already available in prior publications (Van Essen et al., 2012; Glasser et al., 2013; Smith, et al., 2013).The HCP functional pipeline was employed for data processing based on methods reported in previous publications (Glasser et al., 2013; Smith et al., 2013). The primary procedures included initial spatial processing in both volumetric and gray ordinate formats, which involves representing brain locations as surface vertices (Glasser et al., 2013). This was followed by applying a weak high-pass temporal filter with a full width at half maximum greater than 2000s to both data types for the elimination of slow drifts. For the volumetric data, MELODIC ICA (Routier et al., 2019) was utilized, and artifacts were identified via FIX (Salimi-Khorshidi et al., 2014). To eliminate artifacts and motion influences, regression was performed using several parameters: the six rigid-body parameter time series, their temporal derivatives looking backward, and the squared values of all 12 regressors, applied to both volumetric and gray ordinate data (Glasser et al., 2013).
Time courses for each voxel underwent Z-scoring and subsequent averaging across brain regions. This was done for the 68 regions defined in the Desikan-Killiany atlas (excluding the corpus callosum) (Desikan et al., 2006), as well as the 200 regions outlined in the recent Yan 2023 (Yan et al., 2023) atlas. Any outlier time points that fell beyond three standard deviations from the mean were excluded. These two parcellation atlases were specifically chosen for hypothesis testing because they both had a homotopic nature, having parallel parcels on each hemisphere. This processing was carried out using the Workbench software, specifically employing the “workbench command-cifti-parcellate” (Marcus et al., 2011). Time series for two sessions with two phase encoding directions (LR and RL) were merged for each subject using “workbench command-cifti-merge.”
Functional connectivity construction
The Ledoit-Wolf estimator was chosen for covariance matrix estimation due to its ability to reduce the influence of extreme eigenvalues, leading to more stable and well-conditioned covariance matrices (Brier et al., 2015; Ledoit and Wolf, 2004). To assess statistical associations between ROIs time series, three parameterizations were utilized: Pearson bivariate correlation, partial correlation, and tangent space embedding (TSE). Bivariate correlation computed using the formula
Network embedding
Node2vec (Grover and Leskovec, 2016), an unsupervised learning algorithm for graph representation learning (Goyal and Ferrara, 2018), extends the Word2Vec (Mikolov et al., 2013) model’s concept of word embeddings to graph nodes. By employing RWs to generate node sequences, node2vec captures both the local and global information within a graph, crucial for analyzing complex networks such as FC. The outcome of the node2vec algorithm is a feature vector for each node represented as a low-dimensional vector, reflecting its contextual relevance and neighborhood structure. For each parametrization, the node2vec is applied to the group-averaged FC to obtain node embeddings. Binarization of the networks is avoided to prevent information loss, and negative edges are ignored in RWs. Node2Vec learns node embeddings by maximizing the likelihood of preserving node neighborhoods sampled via biased RWs. The objective function is given by:
To make computation efficient, negative sampling is used to approximate
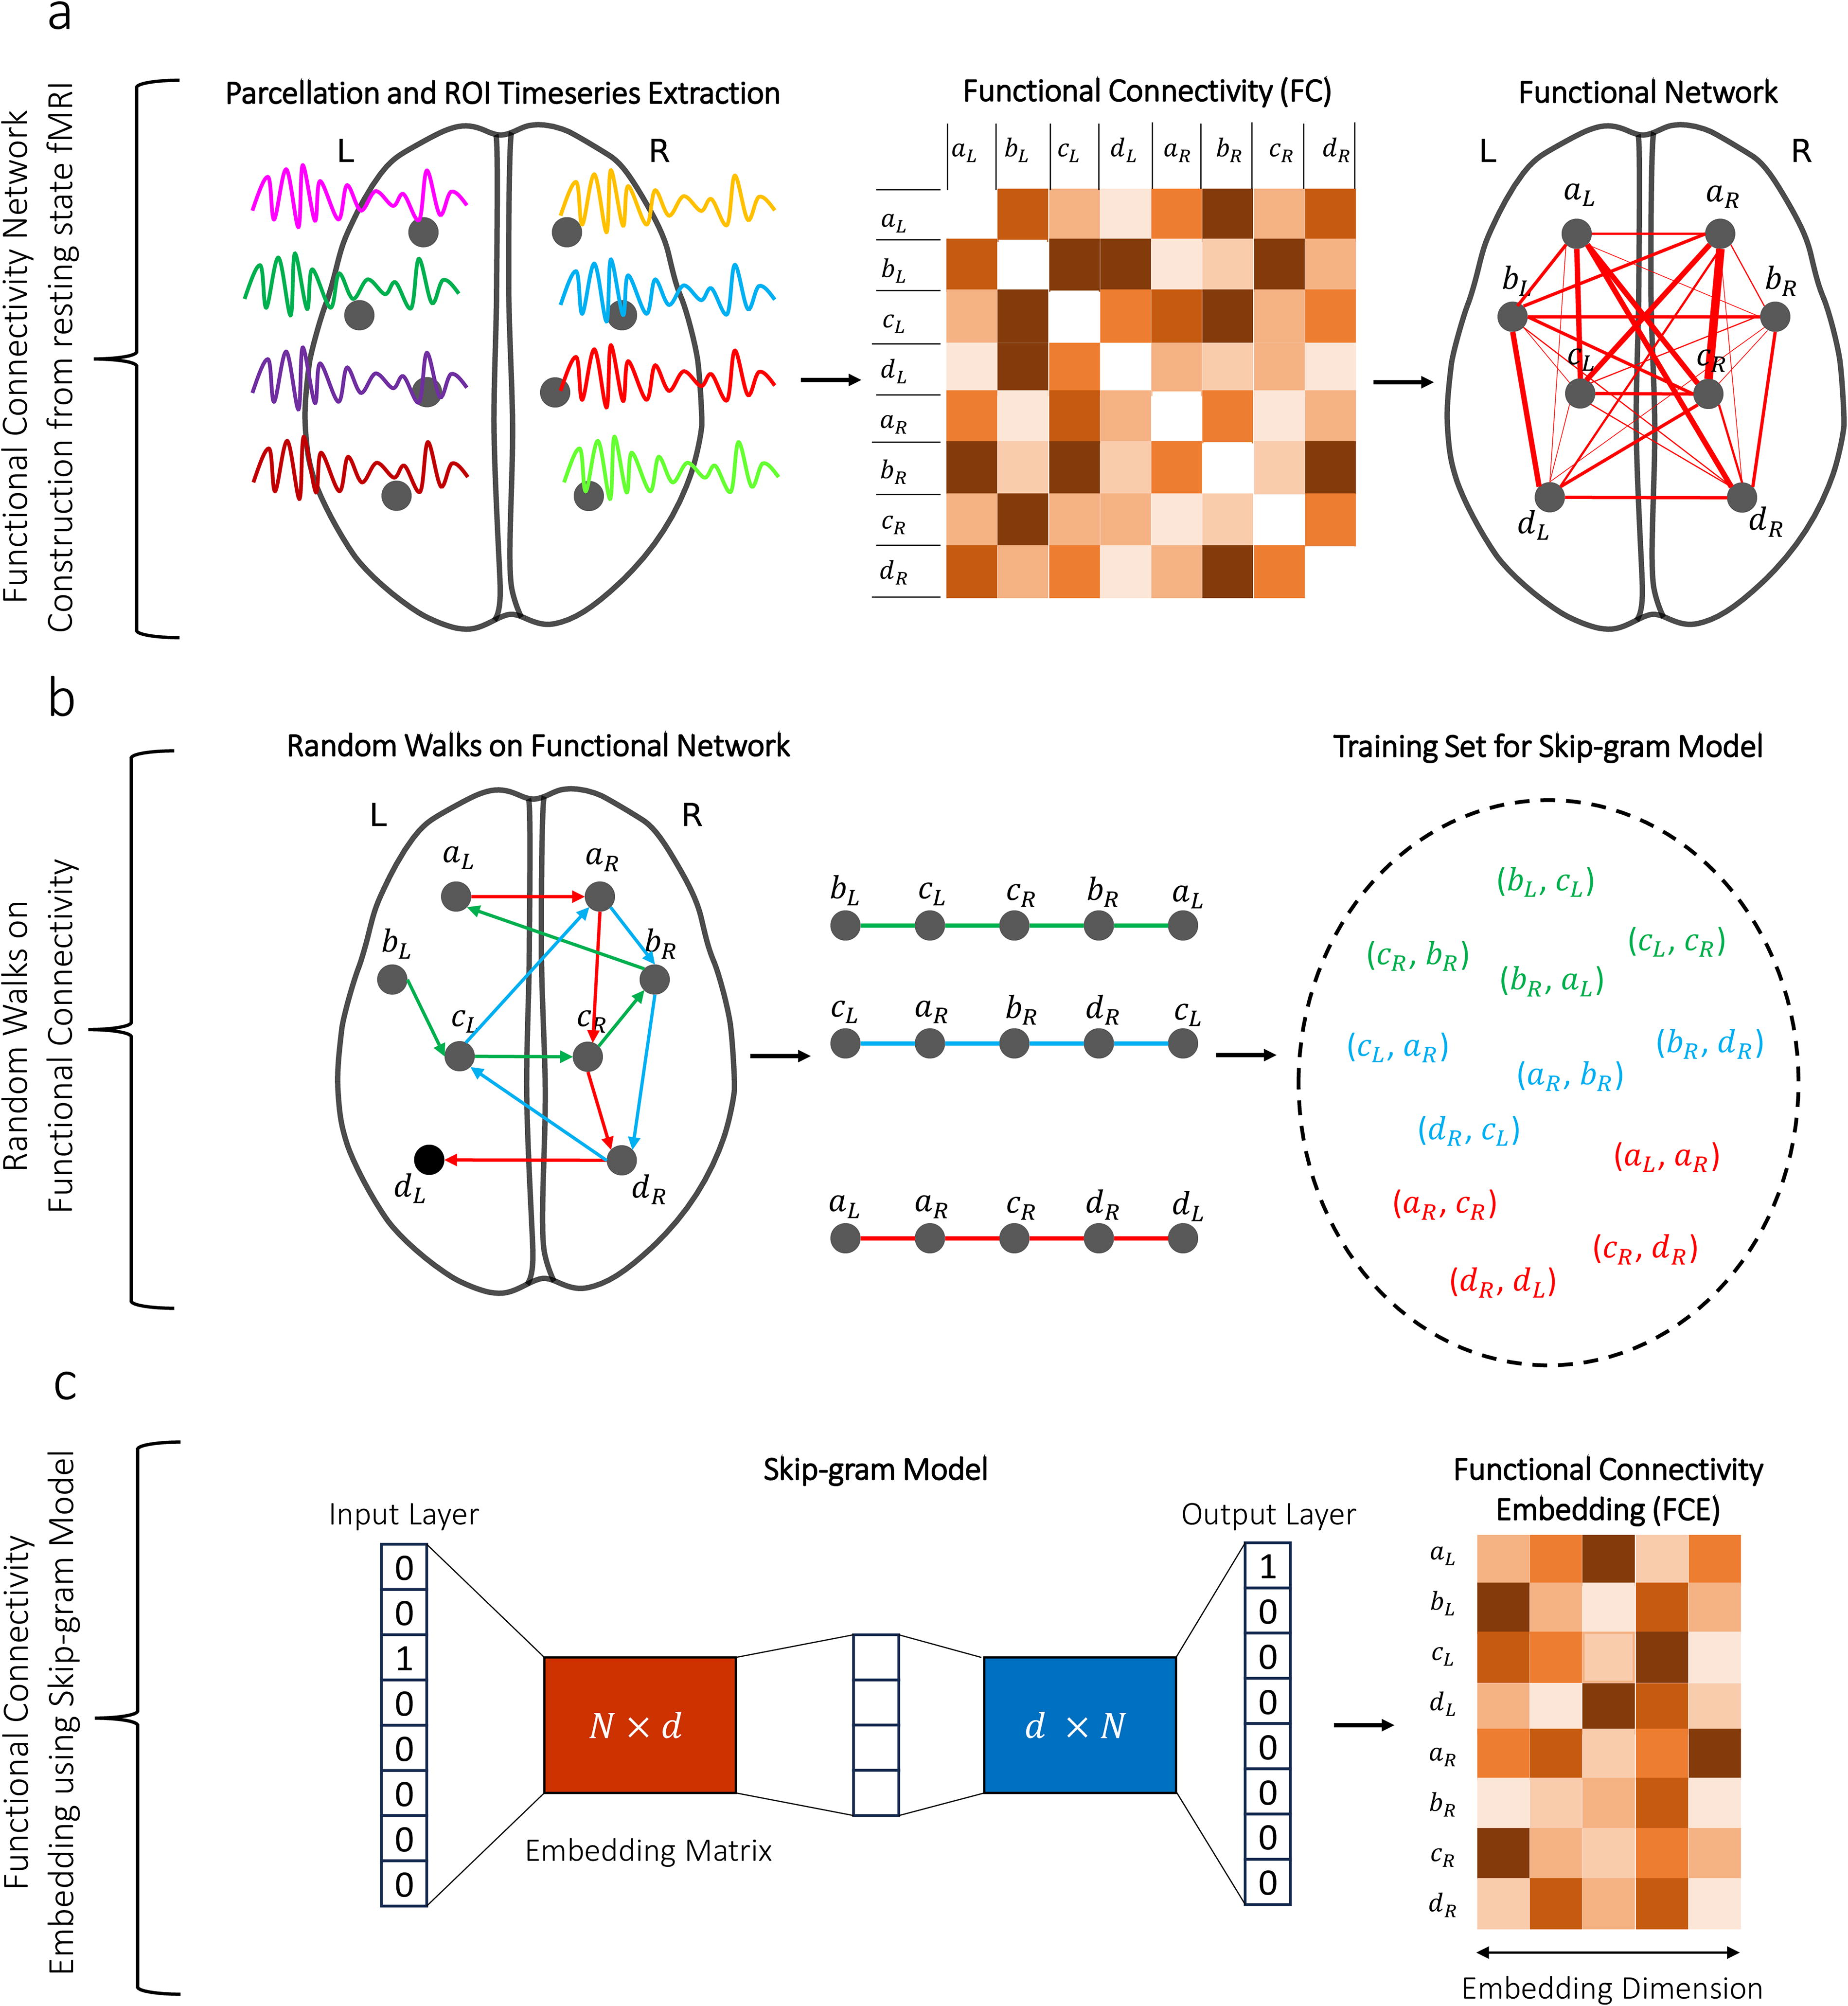
FC embedding workflow.
Inter-hemispheric analogy test
The inter-hemispheric analogy test (Rosenthal et al., 2018) was employed to evaluate the HoFC. In previous studies, this test has been used to demonstrate the superiority of higher-order structural connectivity over dyadic structural connectivity (Rosenthal et al., 2018) and to assess the quality of embedding alignment across individuals (Levakov et al., 2021). These analyses were conducted using structural connectivity data generated from diffusion tensor imaging. The core concept of this test is based on the idea that the relationship between each pair of regions in one hemisphere should reflect the corresponding pairwise relationship in the opposite hemisphere (Rosenthal et al., 2018). The examination of each pairwise relation is termed as an analogy. Consequently, the inter-hemispheric analogy test consists of
Analogies are conducted using the feature vectors of the regions. By the first-order feature vector of a region, we refer to the entire corresponding row in the functional connectivity matrix, which serves as the feature vector for that region. For instance, as shown in part (a) of Figure 1, the feature vector for bL is the second row of the matrix depicted. In contrast, the higher-order feature vector of a region refers to its corresponding embedding vector. As illustrated in part (c) of Figure 1, the higher-order feature vector for bL is derived from the second row of the functional connectivity embedding matrix. These feature vectors are the ones compared in analogy tests.
Word2vec produces different outputs in different iterations (Smith et al., 2017b; Smith et al., 2017a; Wang et al., 2022), and thus Node2vec also yields varying results in independent runs, attributable both to the uncertainty of RWs and the skip-gram model (Levakov et al., 2021). Consequently, we ran this algorithm 100 times on the group-averaged FC and conducted the inter-hemispheric analogy test in each run. The final desired rank for each analogy is determined as the median of these 100 ranks. A more detailed description of the interhemispheric analogy test and the procedure can be found in (Rosenthal et al., 2018).
Results
HoFC validation using dyadic and higher-order feature vectors
HoFC was analyzed using dyadic and higher-order feature vectors extracted from group-averaged functional connectivity matrices, constructed through three methods (Fig. 2). Inter-hemispheric analogy tests were performed using these feature vectors to generate expected node rank histograms. A bin size of 5 was chosen (Rosenthal et al., 2018), and the results are shown in Figure 3.
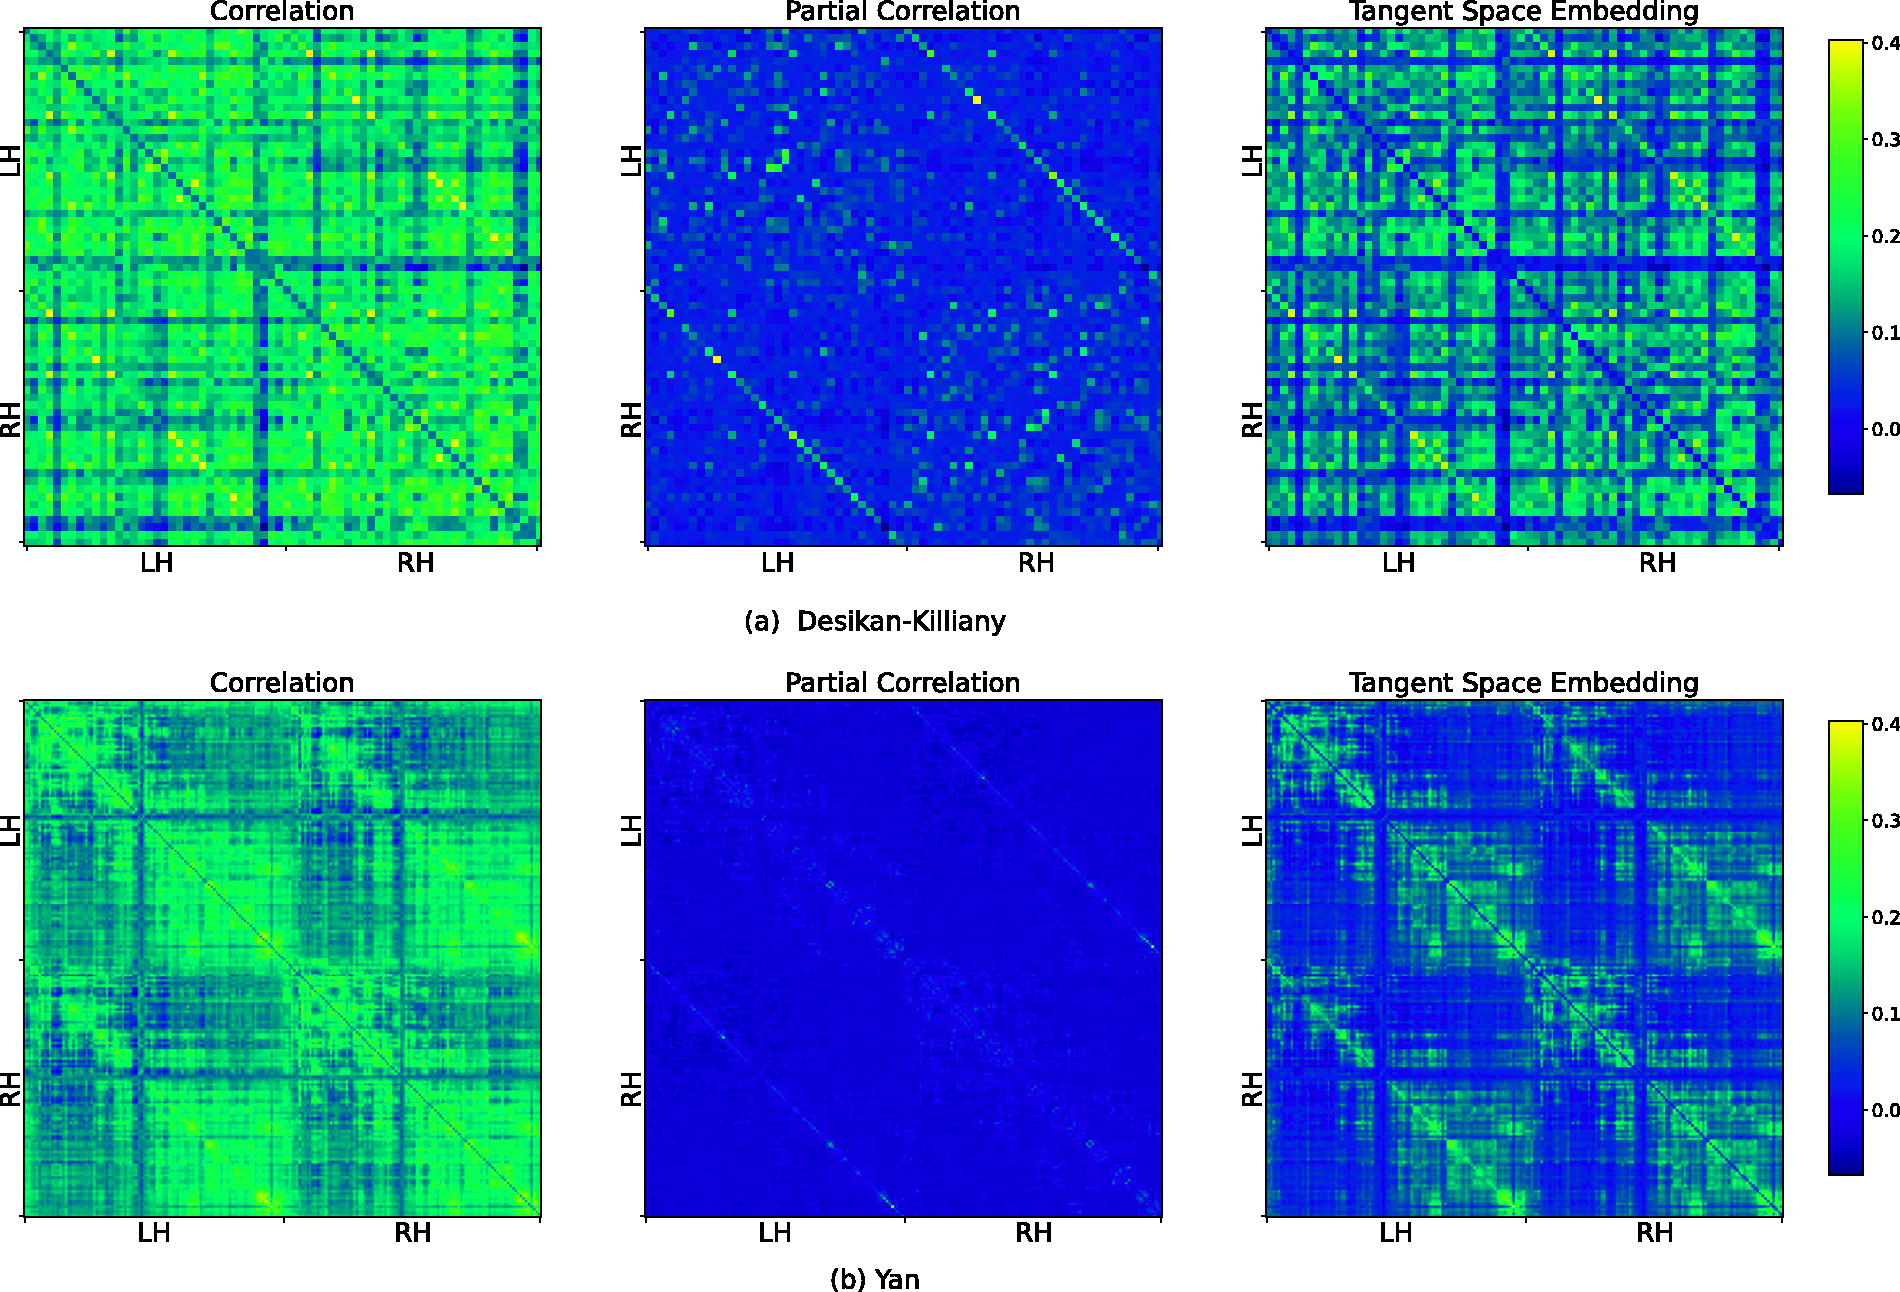
The group-averaged functional connectivities obtained using three connectivity construction methods: bivariate correlation, partial correlation, and tangent space embedding.
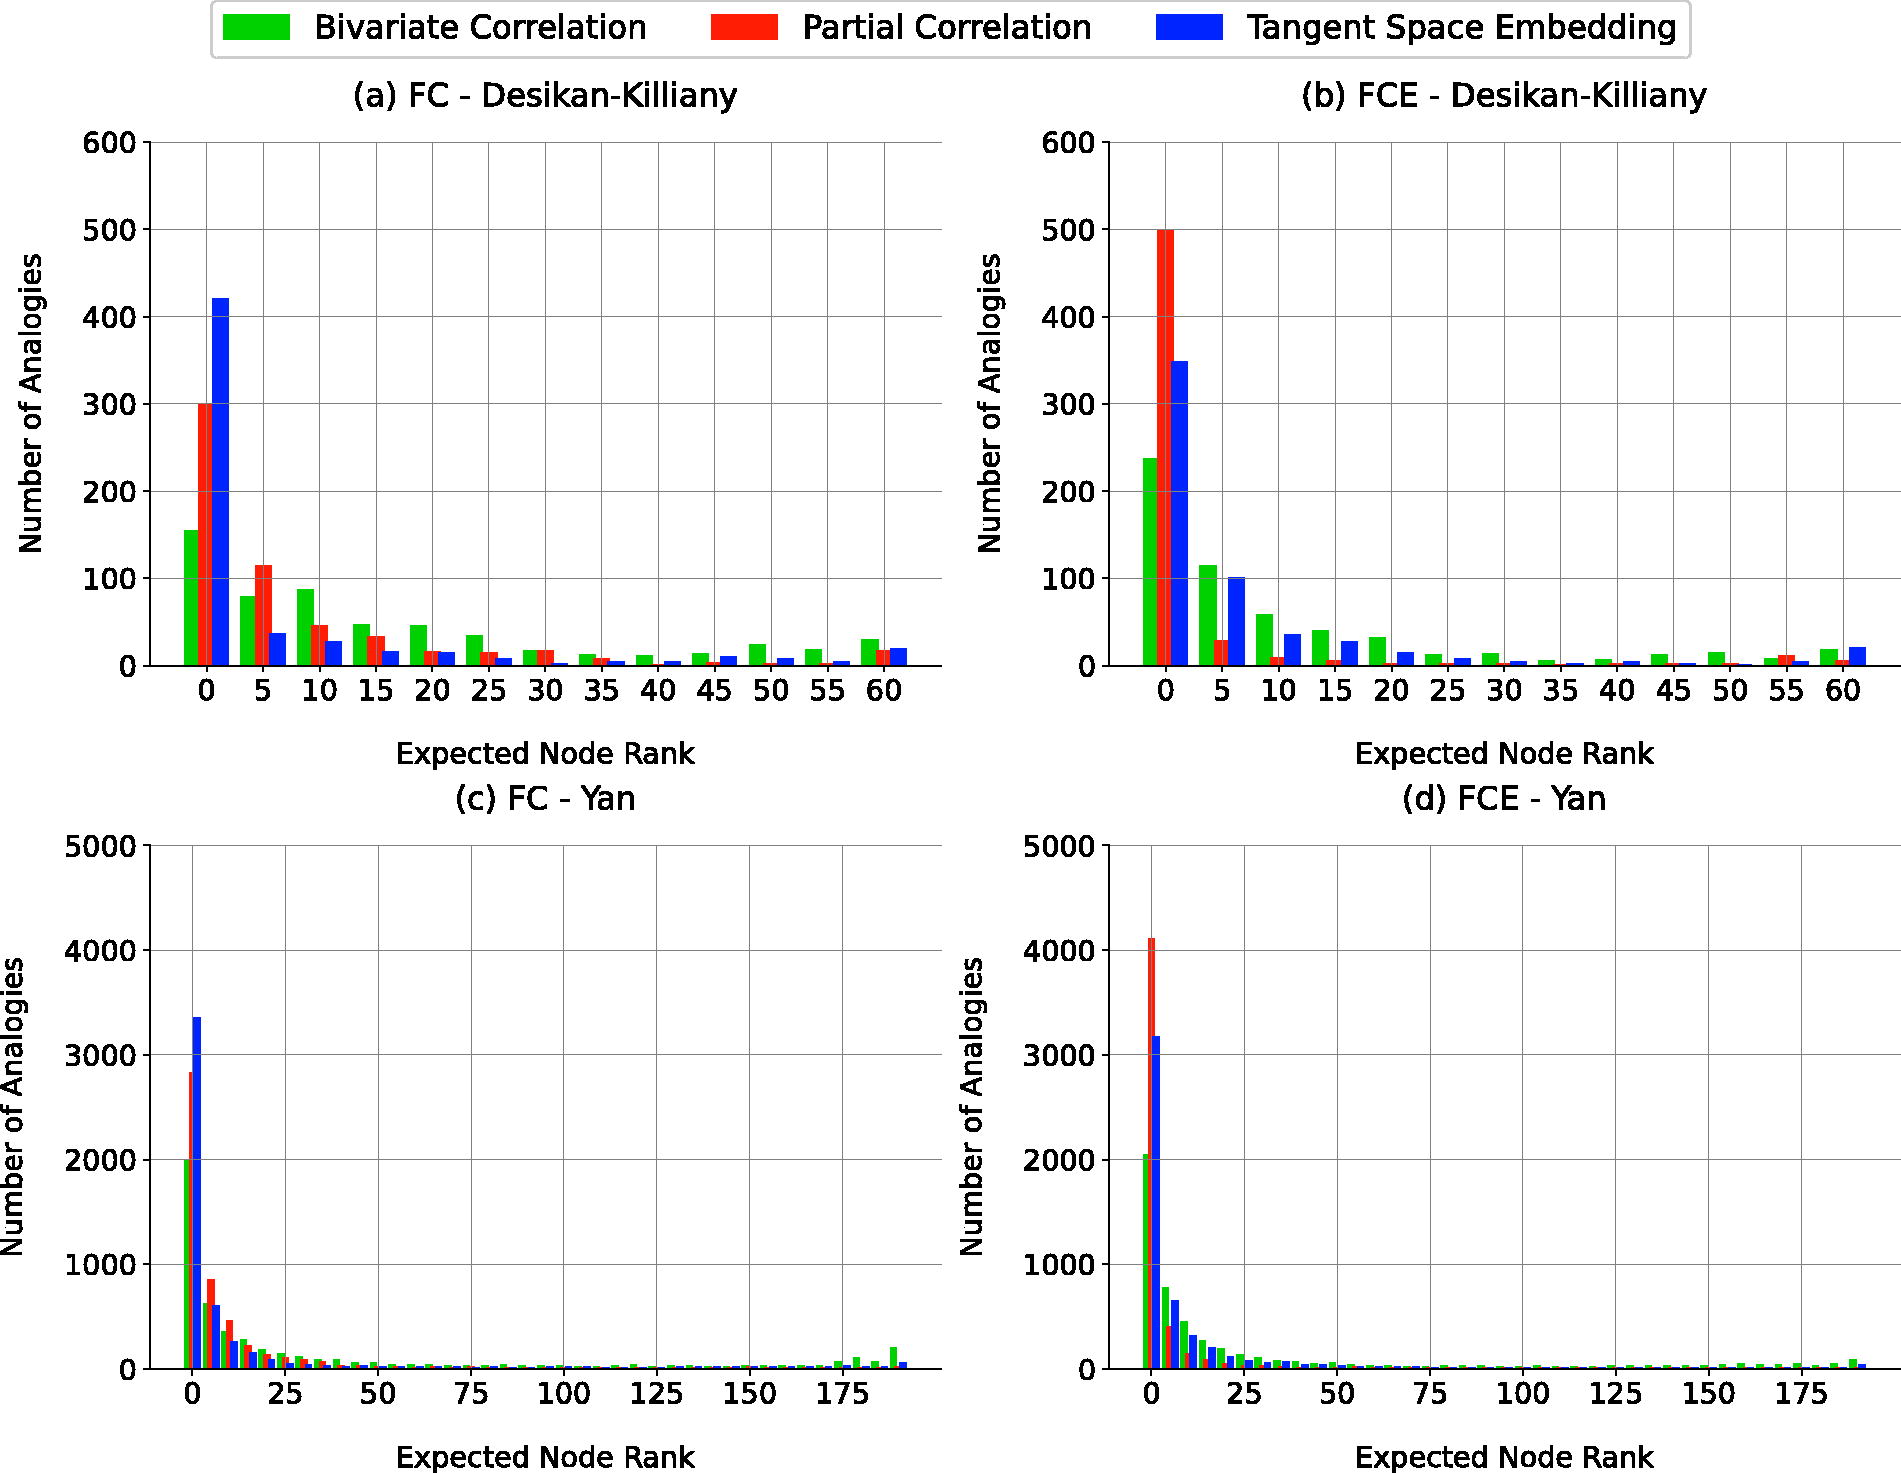
Performance of FC and FCE feature vectors in representing HoFC using interhemispheric analogy test. The ranking of the expected nodes was binned into bins of 5. For instance, the first column (consisting of three methods) shows the number of analogies in which the expected nodes were among the top 5 similar nodes. As it is observed in the figure the histograms have a right skewness.
The histograms consistently displayed right skewness, visually indicating that the expected nodes were consistently ranked among the top five in analogy tests. To evaluate the statistical significance of this observation, the results were compared with those obtained from randomized network ensembles generated using three distinct random network models (Vaša and Mišíc, 2022). The first model involved generating completely random adjacency matrices. The second null model reshuffled the weights within the original group-averaged functional connectivity, while the third preserved the degree of each node, with weights generated under this constraint, although complete preservation was not always achievable.
To assess HoFC using feature vectors derived from dyadic interactions (FC), we analyzed group-average FC constructed using bivariate correlation, partial correlation, and tangent space embedding in both the Yan and Desikan-Killiany atlases, resulting in six group-average FC matrices. For each matrix, 100 random networks were generated using random network models. Analogy tests were conducted to obtain histograms of expected node rank for the original group-average FCs and their corresponding random networks. In each statistical test, the histogram of the original group-averaged functional connectivity was compared with the histogram of each of the 100 random networks using the Kolmogorov–Smirnov statistical test (Massey, 1951). The results revealed statistically significant differences in more than 90 out of 100 comparisons in all cases. These findings validate HoFC using dyadic feature vectors across parameterizations and atlases.
To validate HoFC using feature vectors derived from FCE, node2vec was applied ten times to each of the 100 random networks, and the results were averaged to address the algorithm’s inherent variability. This process yielded 100 averaged FCEs for each random network model, and analogy tests were used to generate histograms of the expected node rank distributions for these networks. Similarly, node2vec was applied ten times to the original group-averaged functional connectivity, and the results were averaged. Analogy tests were used to generate histogram of expected node ranks for higher-order interactions in the original group-averaged functional connectivity. This histogram was then compared to those from random networks using the Kolmogorov-Smirnov test, which revealed statistically significant differences in over 90 out of 100 comparisons in all random network models. These findings confirm HoFC in higher-order interactions.
Evaluation of different connectivity construction methods in capturing HoFC using FC and FCE
After validating HoFC using FC and FCE, we focused our analysis on comparing the capability of the three functional connectivity construction methods in capturing HoFC. To achieve this, we employed interhemispheric analogy tests and analyzed analogy values within the range (0–5), as shown in Figure 4. In this analysis, a bin size of 1 represented expected ranks in the range (0–1), a bin size of 2 corresponded to ranks in the range (1–2), and so on. The analysis of expected node ranks within this range is critical, as the precise similarity range for HoFC remains uncertain (Rosenthal et al., 2018; Jin et al., 2020). Therefore, ensuring consistency of analogy test results across different bin sizes and atlases is essential for drawing robust conclusions.
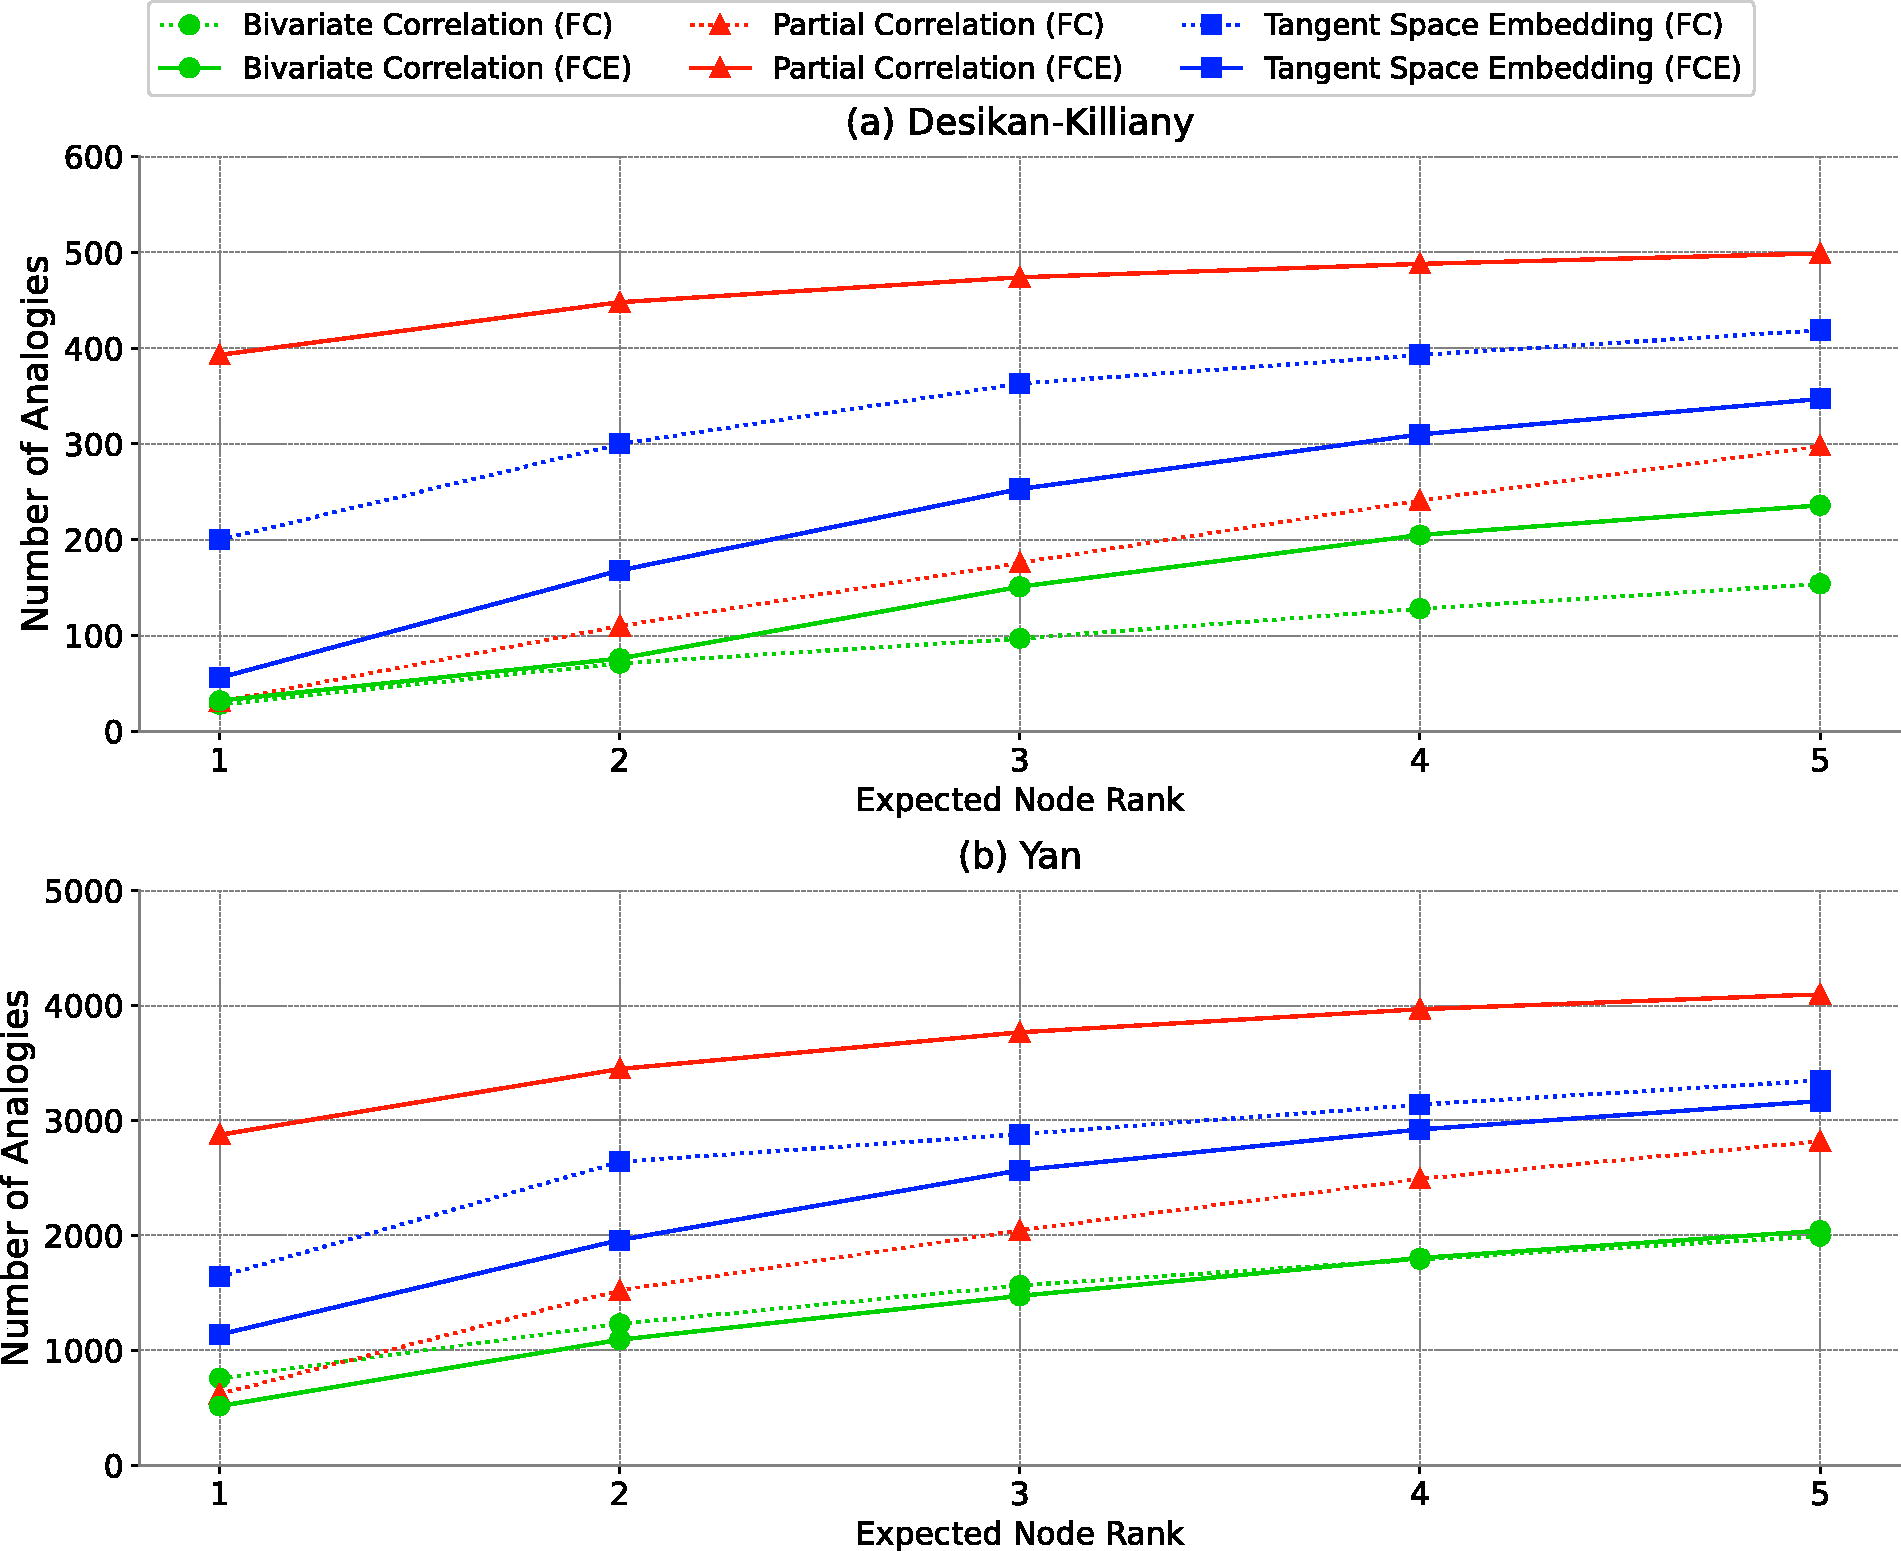
Interhemispheric analogies test.
The initial step involved identifying consistent results across bin sizes and atlases. Once consistency was established, further statistical analysis was conducted. This included several comparative evaluations: first, we compared the ability of dyadic feature vectors from the three functional connectivity construction methods to capture HoFC (FC comparison—found in subsection FC comparison in reflecting HoFC). Next, we compared higher-order feature vectors (FCE comparison—found in subsection FCE comparison in reflecting HoFC). Finally, comparisons were made between FC and FCE for each method (found in subsection FC vs. FCE). The final results are summarized in Table 1.
Based on All Analyses, This Table Presents and Compares the Results of FC and FCE. For FC, TSE Was the Most Effective Method in Reflecting HoFC, While Bivariate Correlation Yielded Inconsistent Results, and Partial Correlation Was Effective but Less so than TSE. In FCE, Partial Correlation Emerged as the Most Effective Method, Surpassing the Other Two Methods. In the Comparison of FC versus FCE, Partial Correlation Was More Effective in FCE, While TSE Was More Effective in FC. No Significant Pattern Was Observed in Bivariate Correlation between FC and FCE. Overall, Partial Correlation in FCE and TSE in FC Were Found to be the Most Effective Methods in Capturing HoFC, Respectively
In the chi-square test conducted in the following sections, the null hypothesis (H 0) states that there is no significant difference in the number of expected node ranks between two methods within a bin size of 5. The significance level (p value) is set at 0.01.
FC comparison in reflecting HoFC
In the case of dyadic feature vectors (FC), TSE outperformed both bivariate and partial correlation methods in reflecting the HoFC across various bin sizes, as shown in Figure 4, within both the Yan and Desikan-Killiany atlases. Despite the inconsistent performance between bivariate and partial correlations among atlases, TSE consistently demonstrated superior efficacy. In the Yan Atlas, out of 4950 analogies, TSE ranked the expected node within the top five positions 3349 times, significantly more than bivariate (1565 times) and partial correlation (2821 times). This was statistically supported by chi-square tests, revealing statistically significant differences in performance between TSE and bivariate correlation
FCE comparison in reflecting HoFC
In the case of FCE, partial correlation and TSE demonstrated superior capabilities in reflecting the HoFC across bin sizes, outshining bivariate correlation in both the Yan and Desikan-Killiany atlases. Specifically, in the Yan atlas analysis involving 4950 analogies, partial correlation led by ranking the expected node within the top five in 4098 cases, followed by TSE with 3169 instances and bivariate correlation at 2041. Chi-square tests underscored these differences, showing statistically significant differences: bivariate versus partial correlation
FC vs. FCE
In assessing the effectiveness of FCE versus FC in capturing HoFC, it was observed that in both atlases, partial correlation in FCE significantly outperformed its counterpart in FC. Conversely, for TSE, the FC method demonstrated superior representation of HoFC compared with FCE in both atlases. However, no significant or consistent trend was noted in the performance of the bivariate correlation between FC and FCE. Specifically, in the Yan atlas, bivariate correlation in FC outperformed that in FCE, while in the Desikan-Killiany atlas, the reverse was true, with bivariate correlation in FCE outperforming that in FC. In Yan atlas, a statistically significant difference was found in partial correlation between FC (2821) and FCE (4098), yielding
ROIs representing HoFC
In addition to statistically examining HoFC through inter-hemispheric analogies, Figure 5 presents visualizations of the expected regions consistently ranked among the top five. For each analogy, the ranks of both nodes are recorded. Subsequently, the median of these ranks for each region is computed, serving as the region rank. Regions with a rank within the range (0, 5) are then visualized in green. In FC, tangent space embedding results in more regions being highlighted in green compared to other methods. In FCE, partial correlation leads to the majority of the regions being highlighted in green.

Depiction of homotopic areas captured by the inter-hemispheric analogy test. Regions where the expected nodes rank among the top five are highlighted in green. As shown in the figure, higher-order interactions derived from partial correlation best capture HoFC, while TSE outperforms other methods in representing HoFC using dyadic feature vectors.
Discussion
Our study explores HoFC, a significant characteristic of mammalian brain networks, by using dyadic and higher-order feature vectors derived from resting-state functional interactions through machine learning techniques. Our key finding is that RWs on functional connectivity, created using partial correlation, more accurately capture HoFC, an intrinsic neurophysiological characteristic of the human brain. This highlights the significance of both higher-order interactions and the choice of statistical measure in constructing FC. It suggests that for a more effective encoding of FC using the random walk node embedding method, the statistical dependency measure that defines connections between two regions should focus exclusively on the dependency of their activation while excluding the influence of other nodes. Partial correlation accomplishes this by calculating a coefficient that more precisely represents the genuine interaction between two nodes, mitigating the impact of other intervening variables. Consequently, our results indicate that the best outcomes are achieved using RWs on FC created using partial correlation as the weight between two nodes.
We first validated HoFC using dyadic and higher-order feature vectors by comparing to various network null models. The findings imply that the corresponding regions in opposite hemispheres possess the most similar feature vectors, as computed by cosine similarity. These feature vectors, which encompass both dyadic and higher-order interactions, effectively validate HoFC. To the best of our knowledge, little work has been done on investigating HoFC using machine learning techniques.
In the case of dyadic interactions (FC), TSE better represents HoFC compared to other parametrizations. Previous results have shown that TSE results in higher classification accuracy relative to bivariate correlation and partial correlation (Dadi et al., 2019). These two findings are in accord with each other, as a method that better captures the intrinsic characteristics of the human brain can potentially perform better in machine learning tasks such as classification and regression. Indeed, TSE captures the correlation of neuronal activity across different brain regions by transforming them into a tangent space, thereby simplifying their complex, high-dimensional relationships. The difference between the effectiveness of TSE and other methods is more significant compared to the difference between bivariate correlation and partial correlation, generally indicating that dyadic feature vectors derived using TSE better capture the neurophysiological characteristics of the human brain. In addition, there does not seem to be a consistent, statistically meaningful difference between bivariate correlation and partial correlation.
In the case of FCE, partial correlation significantly and consistently outperforms other parameterizations in representing HoFC. One key element of RW node embedding approaches is the generation of node sequences, which serve as training samples. Thus, it is crucial that these node sequences are meaningfully generated, requiring that edge weights accurately reflect the genuine connections between nodes. To enhance the relevance of graph traversal, these values should be computed in a way that removes the effects of other nodes. Therefore, considering partial correlation as the statistical dependency measure might be more advantageous for generating RWs on FC. Conversely, it has been shown that bivariate correlation tends to produce substantial spurious or false positive edges (Sanchez-Romero and Cole, 2021), which can mislead the RWs on graph connectivity. Moreover, if an edge truly exists, its value could be influenced by other nodes, making it less informative for reflecting direct and genuine interactions, a necessity for generating meaningful RWs. These factors explain why bivariate correlation performs poorly in FC embedding when demonstrating neurophysiological characteristics of the human brain, with TSE performing better than bivariate correlation but worse than partial correlation in the case of FCE.
When comparing dyadic and higher-order interactions (FC vs. FCE) using bivariate correlation, no consistent or significant differences are observed in how well they reflect HoFC. More specifically, in some cases performance deteriorates with higher-order interactions compared with dyadic interactions. In addition, performance is sensitive to bin size. Overall, these findings do not support the superiority of higher-order interactions in representing HoFC when using bivariate correlation. This may indicate that RWs on FC, created using bivariate correlation, fail to capture higher-order interactions, possibly due to the intrinsic limitations of the method (Reid et al., 2019; Spirtes et al., 2001). In the case of TSE, FC better represents HoFC compared with FCE. This suggests that RWs on the connectivity matrix constructed by TSE may not be as informative and fail to adequately capture HoFC. Indeed, TSE primarily involves feature learning on the covariance matrix, and, in terms of correlation-based statistical dependencies, it less accurately represents true dyadic interactions between two nodes in functional connectivity. Consequently, performing RWs on TSE might be less meaningful. On the contrary, partial correlation more effectively represents HoFC and significantly outperforms other methods in capturing pure dyadic interactions between two nodes. These findings underscore that merely using a more advanced method, such as node2vec, may not adequately capture the intrinsic characteristics of functional connectivity. Indeed, the method of constructing FC is crucial because RW node embedding approaches traverse the graph based on edge weights, which influences their path through the graph. Therefore, the manner in which these graphs are constructed is of paramount importance to perform meaningful RWs and subsequent analysis using machine learning methods.
Conclusion
In this study, we explore HoFC by leveraging both dyadic and higher-order feature vectors derived from three different parameterizations of the resting-state functional connectivity. Our validation of HoFC using machine learning techniques demonstrates that partial correlation is the most suitable framework for random walk node embedding methods. These embeddings better capture HoFC, an important intrinsic characteristic of the human brain. Here, we do not investigate other graph exploration parameters, which are crucial for encoding the graph based on homophily or structural roles. Understanding these parameters remains vital for improving FC encoding. In addition, we do not examine the spectrum of HoFC within ROIs, identifying regions exhibiting HoFC using a strict threshold. Going forward, we aim to focus on how well partial correlation can predict individual differences in both healthy subjects and patients. This approach will be relevant for classification or regression problems. We also plan to adopt more sophisticated methods for establishing statistical associations in neural time series, which will enable deeper insights into the investigation of HoFC based on other parameterizations.
Footnotes
Acknowledgments
Data were provided (in part) by the Human Connectome Project, WU-Minn Consortium (Principal Investigators: David Van Essen and Kamil Ugurbil; 1U54MH091657) funded by the 16 NIH institutes and Centers that support the NIH blueprint for Neuroscience Research; and by the McDonnell Center for Systems Neuroscience at Washington University.
Authors’ Contributions
B.K.: Conceptualization, formal analysis, data curation, investigation, methodology, writing—original draft, writing—review and editing. P.J.: Conceptualization, formal analysis, data curation, investigation, methodology, writing—original draft. B.N.A.: Project administration, supervision, writing—review and editing.
Author Disclosure Statement
No competing financial interests exist.
Funding Information
All author confirms that their research is supported by University of Tehran that is primarily involved in education or research.