
Abstract
Background:
Respective changes in resting-state linear and nonlinear measures in major depressive disorder (MDD) have been reported. However, few studies have used integrated measures of linear and nonlinear brain dynamics to explore the pathological mechanisms underlying MDD.
Method:
Forty-two patients with MDD and 42 sex- and age-matched healthy controls (HC) underwent resting-state functional magnetic resonance imaging to calculate multiscale entropy (MSE) and regional homogeneity (ReHo). The MSE-ReHo coupling of the whole gray matter and the MSE/ReHo ratio (the complexity of intensity homogeneity per unit time series) of each voxel were compared between the two groups. To evaluate the discriminative capacity of ratio features between patients with MDD and HC, we employed the support vector machine (SVM) learning method.
Results:
We observed that patients with MDD displayed increased MSE/ReHo ratio mainly in the orbitofrontal cortex, sensorimotor areas, and visual cortex. Moreover, significant correlations were observed between MSE/ReHo ratio and clinical indicators, including depression severity and cognitive function tests. The SVM model demonstrated high accuracy in differentiating patients with MDD from HC, highlighting the potential of the MSE/ReHo ratio as a diagnostic and prognostic tool.
Conclusions:
The aberrant MSE/ReHo ratio implicated the underlying mechanisms of depressive symptoms and cognitive impairment in patients with MDD. It may represent a critical state of the brain region, reflecting the degree of chaos and order in the brain region. Integrating linear and nonlinear combinations of brain signals holds promise for diagnosing psychiatric disorders.
Impact Statement
Major depressive disorder (MDD) is a prevalent and severe mental illness that significantly impacts patients and their families. Conventional brain imaging techniques often fall short of revealing the pathogenesis of MDD. In this study, we employed resting-state functional magnetic resonance imaging alongside nonlinear and linear methods to identify abnormal multiscale entropy/regional homogeneity ratios in patients with MDD. This approach reflects the extent of brain state disarray and offers new insights into the pathogenesis, diagnosis, and treatment of mood disorders associated with MDD.
Introduction
Major depressive disorder (MDD) is a highly prevalent psychiatric disorder characterized by symptoms such as persistent low mood, anhedonia, somatic complaints, cognitive impairments, and suicidal ideation and behaviors (Malhi and Mann, 2018). The burden of MDD extends beyond individuals and their families, affecting society with significant health-related consequences (Gray et al., 2020; Monroe and Harkness, 2022).
In recent decades, resting-state functional magnetic resonance imaging (rs-fMRI) neuroimaging techniques have emerged as valuable tools for studying MDD. These techniques employ metrics such as regional homogeneity (ReHo), which assesses regional coherence (Yuan et al., 2022). ReHo is a fMRI-based linear indicator that quantifies the local synchronization or homogeneity of neural activity within a particular brain region (Zuo et al., 2013). It calculates the time series similarity among neighboring voxels within a given area, reflecting the extent to which these voxels exhibit similar temporal patterns of neural activity (Liu et al., 2021). However, the blood oxygen level-dependent (BOLD) signal in the brain, characterized by its nonlinearity, reflects the intricate nature of brain functioning (Friston et al., 2012). Nonlinear methods have emerged as valuable tools for quantifying, modeling, and predicting the behavior of such complex systems (Ehlers, 1995; Friston et al., 2012). Therefore, researchers have increasingly turned to entropy analysis, a nonlinear statistical approach, to capture the dynamic fluctuations observed in rs-fMRI data. In our study, we employed multiscale entropy (MSE) analysis to investigate the complexity of BOLD time series data (Smith et al., 2014). MSE calculates sample entropy at multiple timescales by segmenting the original time series and applying entropy measures to each segment. The resulting entropy values are then plotted against the corresponding timescale, providing a multiscale representation of signal complexity (Smith et al., 2014). This enables the identification of different entropy patterns across scales, which reflect diverse physiological processes and nonlinear interactions between signal components. MSE has found applications in disease diagnosis, prognosis, evaluation of therapeutic interventions, and the study of brain dynamics and cognitive processes (Busa and van Emmerik, 2016). In MDD, studies have reported abnormal MSE patterns, characterized by either increased or decreased entropy values depending on the timescale examined, indicating disrupted neural complexity and regularity (Bennie et al., 2019; Lin et al., 2019).
However, there has been limited research on the use of integrated measures of linear and nonlinear brain dynamics to explore the mechanisms underlying the pathology of MDD. MSE reflects the complexity of brain area activity and represents the degree of chaos and disorder in brain areas, ReHo quantifies the local synchronization or homogeneity of neural activity within a particular brain region. Therefore, MSE/ReHo integrates them, which may reflect the degree of chaos and order in the brain region. Previous studies have shown that analyzing the across-voxel ratio of cerebral blood flow (CBF) to functional connectivity strength (FCS) in individuals with schizophrenia (Zhu et al., 2017), and the CBF/ReHo ratio in individuals with epilepsy (Xu et al., 2023), can effectively identify changes in the amount of blood supply per unit of connectivity strength or neuronal activity. These alterations may not be observable when examining CBF, FCS, and ReHo separately. The MSE/ReHo ratio evaluates the complexity of intensity homogeneity per unit time series and indicates the coupling of linear and nonlinear metrics within particular voxels or brain regions. Therefore, we speculate that utilizing cross-voxel MSE-ReHo coupling and MSE/ReHo ratio can identify changes in linear versus nonlinear metrics in patients with MDD that cannot be identified through separate analyses of MSE and ReHo alone.
Support vector machine (SVM), as a classical supervised learning method, the main advantage is to improve the generalization ability of the model by maximizing the classification interval, which is particularly good for high-dimensional data and small-sample learning, and can deal with nonlinear problems using kernel tricks (Santana et al., 2022; Sela et al., 2011). However, SVM has a high computational overhead when trained on large datasets and requires high hyperparameter settings and data pre-processing. In contrast, logistic regression is computationally simple and easy to interpret, but only applies to linearly differentiable data and cannot model complex patterns (Zhang et al., 2018). Decision trees have good interpretability and are robust to missing data but are easily overfitted and sensitive to noise (Toyoda et al., 2023). Random forest reduces the risk of overfitting by integrating multiple decision trees and is suitable for large datasets, but model complexity is high, and interpretability is poor (Huang et al., 2023). Neural networks are excellent at processing complex data such as images and speech, especially in deep learning, and can automatically extract features through end-to-end training, but require large amounts of data and computational resources, lack transparency, and are usually considered “black box” models (O’Connell et al., 2023). k-Nearest neighbor algorithms are simple and intuitive but have high computational costs on high-dimensional data, are sensitive to noise, and increase with data size (Zhang et al., 2023). Overall, SVM is suitable for small- to medium-sized, high-dimensional datasets and provides robust performance for many classification tasks.
Considering the spatial inconsistency of brain regions displaying ReHo and MSE alterations in individuals with MDD (as shown in Supplementary Tables S1 and S2), our hypothesis posits that patients with MDD will showcase regional variations in the MSE-ReHo coupling in comparison to healthy subjects. Given the divergent effect sizes and directions of ReHo and MSE changes across different brain regions in patients with MDD, we further hypothesize that these individuals will exhibit region-specific alterations in MSE/ReHo ratios. Higher MSE/ReHo may respond to higher levels of chaotic disorder in brain regions. To investigate these hypotheses, rs-fMRI data were collected from 42 patients with MDD, matched in terms of age and gender to 42 healthy controls (HC). Comparison of voxel-wise MSE-ReHo coupling and MSE/ReHo ratio were conducted between the two groups.
Materials and Methods
Participants and clinical assessments
This study investigated 42 individuals diagnosed with MDD from the Anhui Mental Health Center, scanned at the University of Science and Technology of China (USTC) between February 2017 and December 2019, based on the Diagnostic and Statistical Manual of Mental Disorders, fifth edition. Exclusion criteria were applied, including individuals aged ≤18 years, those who had comorbid neuropsychiatric disorders, and participants with contraindications for MRI scans. The HC group underwent the same screening process. We performed clinical and MRI evaluations of patients with MDD versus the HC group. Ethical approval (No. 20160236) was obtained from the Anhui Medical University Ethics Committee, and written consent was obtained from all participants. The 17-item Hamilton Depression Rating Scale (HAMD) was used to assess depression severity. Cognitive function tests were evaluated using the Mini-Mental State Examination (MMSE), a global cognitive screening tool assessing orientation, attention, calculation, registration, recall, and language.
MRI data acquisition
We employed a 3-T scanner (Discovery GE750w; USTC) for acquiring structural and functional MRI scans. Participants were instructed to maintain vigilance with their eyes closed. The functional images comprised 217 echo-planar imaging volumes, featuring a repetition time (TR) of 2400 ms, echo time (TE) of 30 ms, a 90° flip angle, a 64 × 64 matrix size, a 192 × 192 mm3 field of view, a 3 mm slice thickness, and a total of 46 slices (voxel size = 3 × 3 × 3 mm3). Additionally, we obtained anatomical images consisting of 188 slices with a TR of 8.16 ms, TE of 3.18 ms, a 12° flip angle, a 256 × 256 mm2 field of view, a 1 mm slice thickness, and a voxel size of 1 × 1 × 1 mm3.
MRI pre-processing
We preprocessed the rs-fMRI data using SPM12 (http://www.fil.ion.ucl.ac.uk/spm). To allow for signal equilibration and scanning noise adaptation, the first 10 volumes of each participant were discarded. The remaining volumes underwent correction for acquisition time delay between slices and realignment to correct for motion between time points. Subject head motion was assessed post-scan, with all participants’ BOLD data verifying the defined motion thresholds (i.e., translational or rotational motion parameters <3 mm or 3°) to minimize correlations influenced by subject motion. Frame-wise displacement (FD), indicating volume-to-volume head position changes, was also calculated. We regressed out nuisance covariates (24 motion parameters, their first-time derivations, and signals of global brain, white matter, and cerebrospinal fluid); furthermore, we removed volumes containing FD >0.5 to account for signal spikes related to head motion, which could still impact the final rs-fMRI results even after regressing out linear motion parameters (Power et al., 2012). The datasets then underwent band-pass filtering using a frequency range of 0.01–0.1 Hz. For normalization, individual structural images were linearly coregistered with the mean functional image; these transformed structural images were segmented into gray matter, white matter, and cerebrospinal fluid, and then nonlinearly coregistered to tissue probability maps in the Montreal Neurological Institute (MNI) space. Finally, each filtered functional volume was spatially normalized to MNI space via the parameters estimated from nonlinear coregistration.
MSE estimation of temporal signal complexity
The MSE algorithm employs sample entropy as its basis. Sample entropy measures the complexity of data by assessing the self-similarity of time series(Richman and Moorman, 2000). The basic workflow of the MSE algorithm can be summarized as follows: (a) constructing coarse-grained time series based on various scale factors, (b) quantifying the sample entropy of each coarse-grained time series, and (c) analyzing the distribution and statistical results of the sample entropy within a specific range. Each coarse-grained time series has a length equal to the original time series divided by the corresponding scale factor. For Scale 1, the time series remains the same as the original. Sample entropy is defined as the negative natural logarithm of the conditional probability that a dataset of length N, with a similarity factor (tolerance) of r, will repeat itself for m + 1 points without self-matches, having already repeated itself for m points. In our experiment, we set the parameter values as follows: m = 3, r = 0.6, mm = m + 1, and T = 5 for MSE analysis (Smith et al., 2014). To analyze complexity, we used the automated anatomical labeling (AAL) template from the DPABI toolkit to partition the brain into 116 regions. Furthermore, before MSE analysis, we standardized the BOLD signals to mitigate noise and outlier interference, and a Gaussian smoothing kernel with a 4 mm core was applied. The resulting entropy values were statistically compared between patients with MDD and HC using the general linear model. The MSE algorithm for calculating entropy in functional brain activity can be accessed at http://www.psynetresearch.org/tools.html.
ReHo measurement and analysis
DPABI software was employed for conducting ReHo analyses. The ReHo brain map was constructed by calculating the Kendall coefficient of concordance (KCC) between the time series of each voxel and its neighboring voxels. The ReHo value of each voxel was then normalized by subtracting the average ReHo value of the entire brain and dividing it by the standard deviation, enabling subsequent analysis. The KCC-ReHo value in each voxel direction was calculated and further normalized to obtain the KCC-ReHo z value (Zuo et al., 2013). To mitigate the impact of deformation and noise, enhance the signal-to-noise ratio and statistical efficiency, and improve image quality, a Gaussian smoothing kernel with a 4 mm core was applied.
Comparisons of regional MSE-ReHo coupling
The evaluation of regional MSE-ReHo coupling was carried out through the calculation of across-voxel correlations within each brain area defined by the AAL atlas, which divides the cerebrum into 90 regions (Tzourio-Mazoyer et al., 2015). The regional correlation coefficients for MSE-ReHo were compared between patients with MDD and HC using independent samples t-test at a significance level of p corr < 0.05, with correction for multiple comparisons using the voxel-wise false discovery rate (FWE) method (Korthauer et al., 2019).
MSE/ReHo ratio analysis
We evaluated the time series complexity of unit homogeneity strength using the MSE/ReHo ratio, which was calculated for each voxel without z-transformation. To ensure normality, we transformed the MSE/ReHo ratio of each voxel into a z-score for each participant. The intergroup differences in the MSE/ReHo ratio were then assessed voxel-wise using a two-sample t-test, while head movement and whole brain volume were treated as nuisance variables. We corrected for multiple testing using a voxel-wise FWE method with a threshold of p corr < 0.05. We further extracted the mean MSE/ReHo ratio of each cluster showing significant group differences for each participant and used these values to conduct region of interest (ROI)-based analyses. To test the association between the MSE/ReHo ratio of each significant ROI and the severity of depressive symptoms, we employed nonparametric Spearman’s rank correlation analysis. We corrected for multiple testing by using the Bonferroni method (p corr < 0.0042, corrected for 12 ROIs).
Voxel-wise comparisons in MSE and ReHo
To gain insight into the factors contributing to the differences in the MSE/ReHo ratio, we performed voxel-wise comparisons of MSE and ReHo between the two groups while controlling for head movement and whole brain volume. Multiple comparisons were corrected using a voxel-wise FWE method at a significance level of p corr < 0.05. The resultant intergroup difference maps of MSE, ReHo, and MSE/ReHo ratio were overlaid to visualize the driving factors behind the differences in MSE/ReHo ratio.
Linear SVM learning
We utilized linear SVM analysis with a leave-one-out cross-validation (LOOCV) strategy to investigate whether the identified neural indices could serve as imaging biomarkers to differentiate patients with MDD from HC. This analysis utilized the LIBSVM toolkit with a linear kernel setting for classification, and MSE/ReHo ratios showing significant differences between the two groups were used as features for classification. The LOOCV strategy involved leaving one participant out of the analysis and using the remaining participants for training, such that each participant was left out only once and the number of folds equaled the number of total participants. We have optimized the regularization parameter C through fivefold cross-validation to ensure optimal model performance. Specifically, we have used a linear kernel function (-t 0), which is the most commonly used kernel. The complexity of the model is controlled by optimizing the C value. We have ensured the selection of the optimal C value through nested cross-validation to improve the model’s generalization ability across different datasets. SVM-predicted labels were obtained in each fold, and the classification accuracy, sensitivity, specificity, and area under the receiver operating characteristic curve (ROC) were assessed by comparing true labels and predicted labels. Significance was determined using permutation tests (5000 permutations) with p < 0.05. The SVM algorithm maps training samples to points in a multidimensional space, with each dimension corresponding to a feature, and finds the hyperplane that maximizes the margin between the samples of different categories. The performance of the classifier was evaluated using ROC analysis and the SVM decision value.
Statistical analysis
We used SPSS (version 25.0; SPSS Inc., Chicago, IL, United States) for statistical analyses of demographic and clinical data. To compare continuous variables between individuals diagnosed with MDD and HC, we employed independent-sample t-tests. Chi-square tests were used to compare non-Gaussian variables, such as sex, across groups. Additionally, exploratory Spearman’s correlations were conducted to investigate the relationship between MSE/ReHo ratios in significant cerebral areas of MDD and clinical response. All comparisons were statistically significant (p < 0.05).
Results
Demographics and clinical results
The demographic and clinical data of all participants are summarized in Table 1. No significant distinctions between patients with MDD and HC were observed in terms of age (t = 1.64, p = 0.104) or sex (χ 2 = 0.34, p = 0.558). However, disparities in educational years were observed (t = −2.98, p = 0.004). Patients with MDD have higher HAMD scores (t = 25.77, p < 0.001) and lower MMSE scores (t = −2.48, p = 0.017) compared with HC.
Demographic Characteristics and Clinical Features of Patients with MDD and Healthy Control Groups
MDD, major depressive disorder; HAMD, 17-item Hamilton Depression Rating Scale; MMSE, Mini-Mental State Examination; SSRIs, selective serotonin reuptake inhibitors; SNRIs, serotonin–norepinephrine reuptake inhibitors; SARIs, serotonin antagonist/reuptake inhibitors; NaSSAs, norepinephrine and specificity serotonergic antidepressants.
Spatial distribution of the MSE, ReHo, and MSE/ReHo ratio
Both patients with MDD and HC exhibited similar spatial distributions of MSE, ReHo, and the MSE/ReHo ratio. Specifically, brain regions with lower MSE were primarily located in the sensorimotor cortex and lateral temporal cortex. On the contrary, brain regions with higher ReHo were predominantly distributed in the posterior cingulate cortex/precuneus, medial prefrontal cortex, anterior cingulate cortex, parietal cortices (comprising the default mode network), as well as the lateral prefrontal cortex, and visual cortices. Notably, the sensorimotor cortex and lateral temporal cortex showed lower values of ReHo. Moreover, the MSE/ReHo ratio was higher in the sensorimotor and lateral temporal cortices, while it was lower in the medial prefrontal cortex, posterior cingulate, precuneus, and angular gyrus. Detailed results can be found in Figure 1.

Spatial distribution maps of MSE and ReHo in HC and patients with MDD. The MSE and ReHo maps are normalized to Z-scores and averaged across subjects within groups. L, left; R, right; HC, healthy controls; MDD, major depressive disorder; MSE, multiscale entropy; ReHo, regional homogeneity.
Between-group differences in MSE and ReHo
In comparison to HC, patients with MDD showed reduced MSE in the left caudate and left angular. Moreover, patients with MDD exhibited lower ReHo in several brain regions, including the bilateral middle temporal gyrus, postcentral gyrus, lingual gyrus, calcarine gyrus, precentral gyrus, insula, middle frontal gyrus, superior frontal gyrus, thalamus, left rectus, left precuneus, and orbitofrontal cortex. The statistical significance of these findings is reported in Supplementary Tables S1 and S2 and illustrated in Supplementary Figures S1 and Figure S2 (p < 0.001, FWE corrected p < 0.05).
Between-group differences in MSE/ReHo ratio
In comparison to HC, patients with MDD demonstrated higher MSE/ReHo ratio in several brain regions, including the bilateral postcentral gyrus, precentral gyrus, lingual gyrus, calcarine gyrus, rectus gyrus, thalamus, and orbitofrontal cortex (p < 0.001, FWE corrected p < 0.05). The detailed findings can be found in Supplementary Table S3 and Figure 2.

Group differences in MSE/ReHo between patients with MDD and HC (p < 0.001, FWE corrected p < 0.05). FEW, voxel-wise false discovery rate; L, left; R, right; HC, healthy controls; MDD, major depressive disorder; MSE, multiscale entropy; ReHo, regional homogeneity.
Correlation between MSE/ReHo ratio and clinical symptoms
Figure 3A and B displays the correlations between MSE/ReHo ratios for significant ROI and the severity of depressive symptoms (HAMD general scores) as well as the degree of memory impairment (MMSE scores) in patients with MDD. In cluster 5, we observed a significant correlation between MSE/ReHo ratios and HAMD scores (Spearman’s ρ = 0.431, p = 0.004). However, for cluster 1, cluster 4, and cluster 10, we only found a trend toward a significant correlation between MSE/ReHo ratios and MMSE scores (cluster 1: Spearman’s ρ = −0.358, p = 0.044; cluster 4: Spearman’s ρ = −0.428, p = 0.015; cluster 10: Spearman’s ρ = −0.343, p = 0.041). It is important to note that these correlations did not reach significance after applying the Bonferroni correction (p < 0.05/12 = 0.0042). Furthermore, separate graphs were created to illustrate the MSE/ReHo values for clusters showing correlations with clinical symptoms, as depicted in Supplementary Figure S3.

Associations between the MSE/ReHo ratio and MSE and ReHo changes in patients
Figure 4 depicts the relationships between the MSE/ReHo ratio (red) and changes in MSE (blue) and ReHo (green) in patients with MDD. Red-colored regions represent areas with an altered MSE/ReHo ratio without significant changes in MSE or ReHo alone. These areas include the left orbitofrontal cortex, fusiform, lingual, insula, sensorimotor cortex, and parts of the occipital and temporal lobes. The overlap (yellow) between the MSE/ReHo ratio and ReHo changes was mainly observed in the partial frontal and occipital lobe, lingual calcarine, right fusiform, left rectus, right orbitofrontal cortex, insula, sensorimotor cortex, thalamus, and precuneus. Green-colored regions were those with ReHo changes but without MSE/ReHo ratio and MSE changes. These regions include the right orbitofrontal cortex, fusiform, insula, lingual, thalamus, precuneus, angular, sensorimotor cortex, and parts of the frontal and occipital lobes. No overlapping areas of brain regions were found to differ in the MSE/ReHo ratio and MSE between HC and patients with MDD.
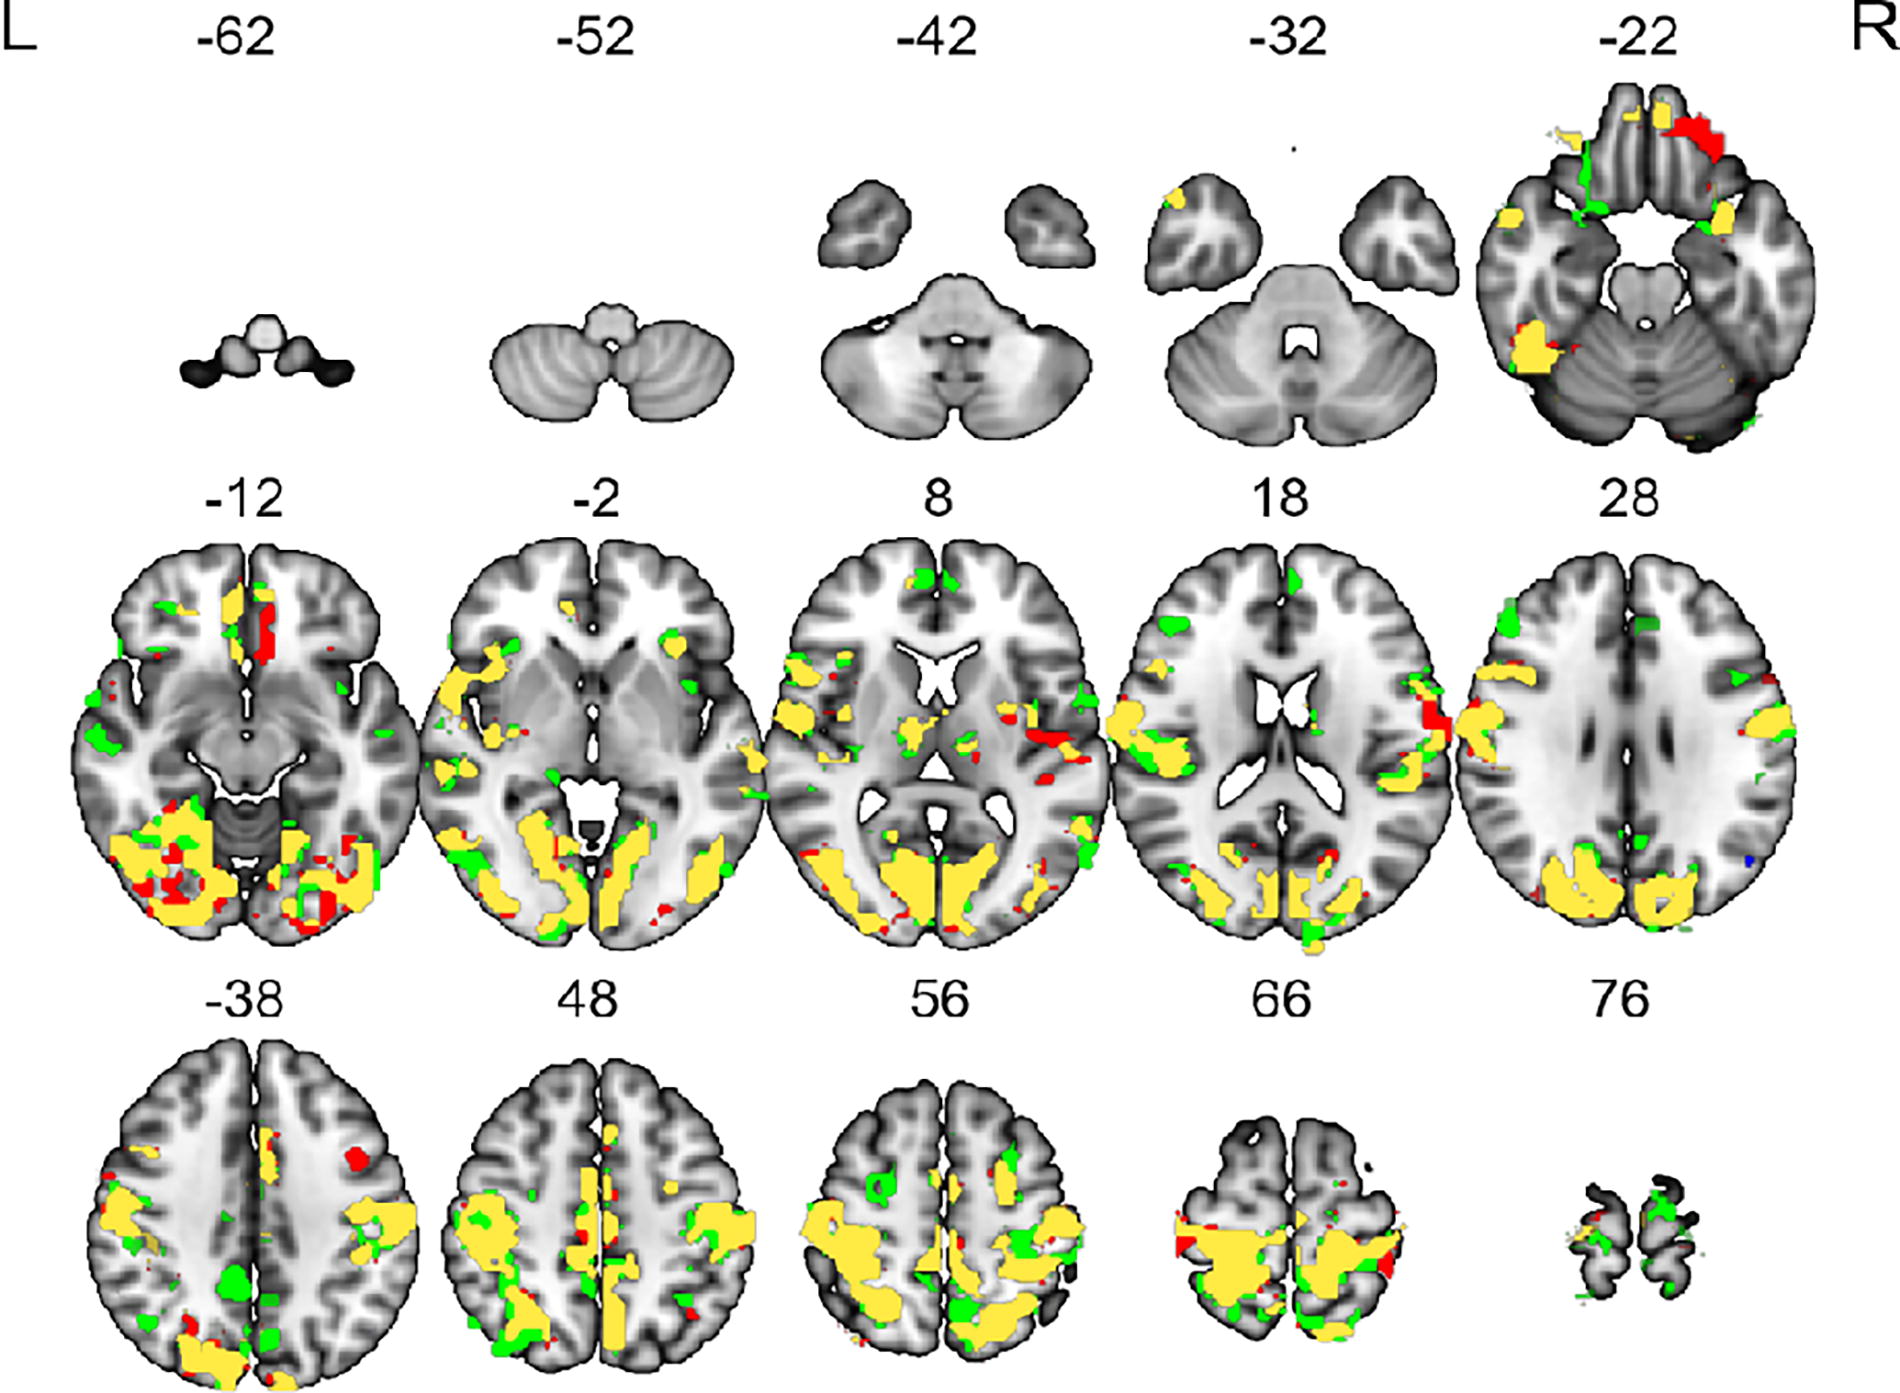
The overlaps of MSE/ReHo ratio (red), MSE (blue), and ReHo (green) change in patients with MDD. The red color represents brain regions with MSE/ReHo ratio but without MSE and ReHo changes. The yellow color indicates the overlap between the MSE/ReHo ratio and ReHo changes. The green color denotes the regions that were those with ReHo changes but without MSE/ReHo ratio and MSE changes. L, left; R, right; MDD, major depressive disorder; MSE, multiscale entropy; ReHo, regional homogeneity.
Classification performance
By utilizing the MSE/ReHo ratio features in the aforementioned brain regions that exhibited significant associations with HAMD and MMSE scores, the linear SVM classifier demonstrated a sensitivity of 83.00%, specificity of 71.00%, accuracy of 77.38%, and an area under the ROC curve of 85.00%. Detailed results can be found in Figure 5. Furthermore, the SVM decision value of these significant brain regions displayed a negative correlation with MMSE scores (Spearman’s ρ = −0.447, p = 0.010). Detailed results can be found in Supplementary Figure S4.
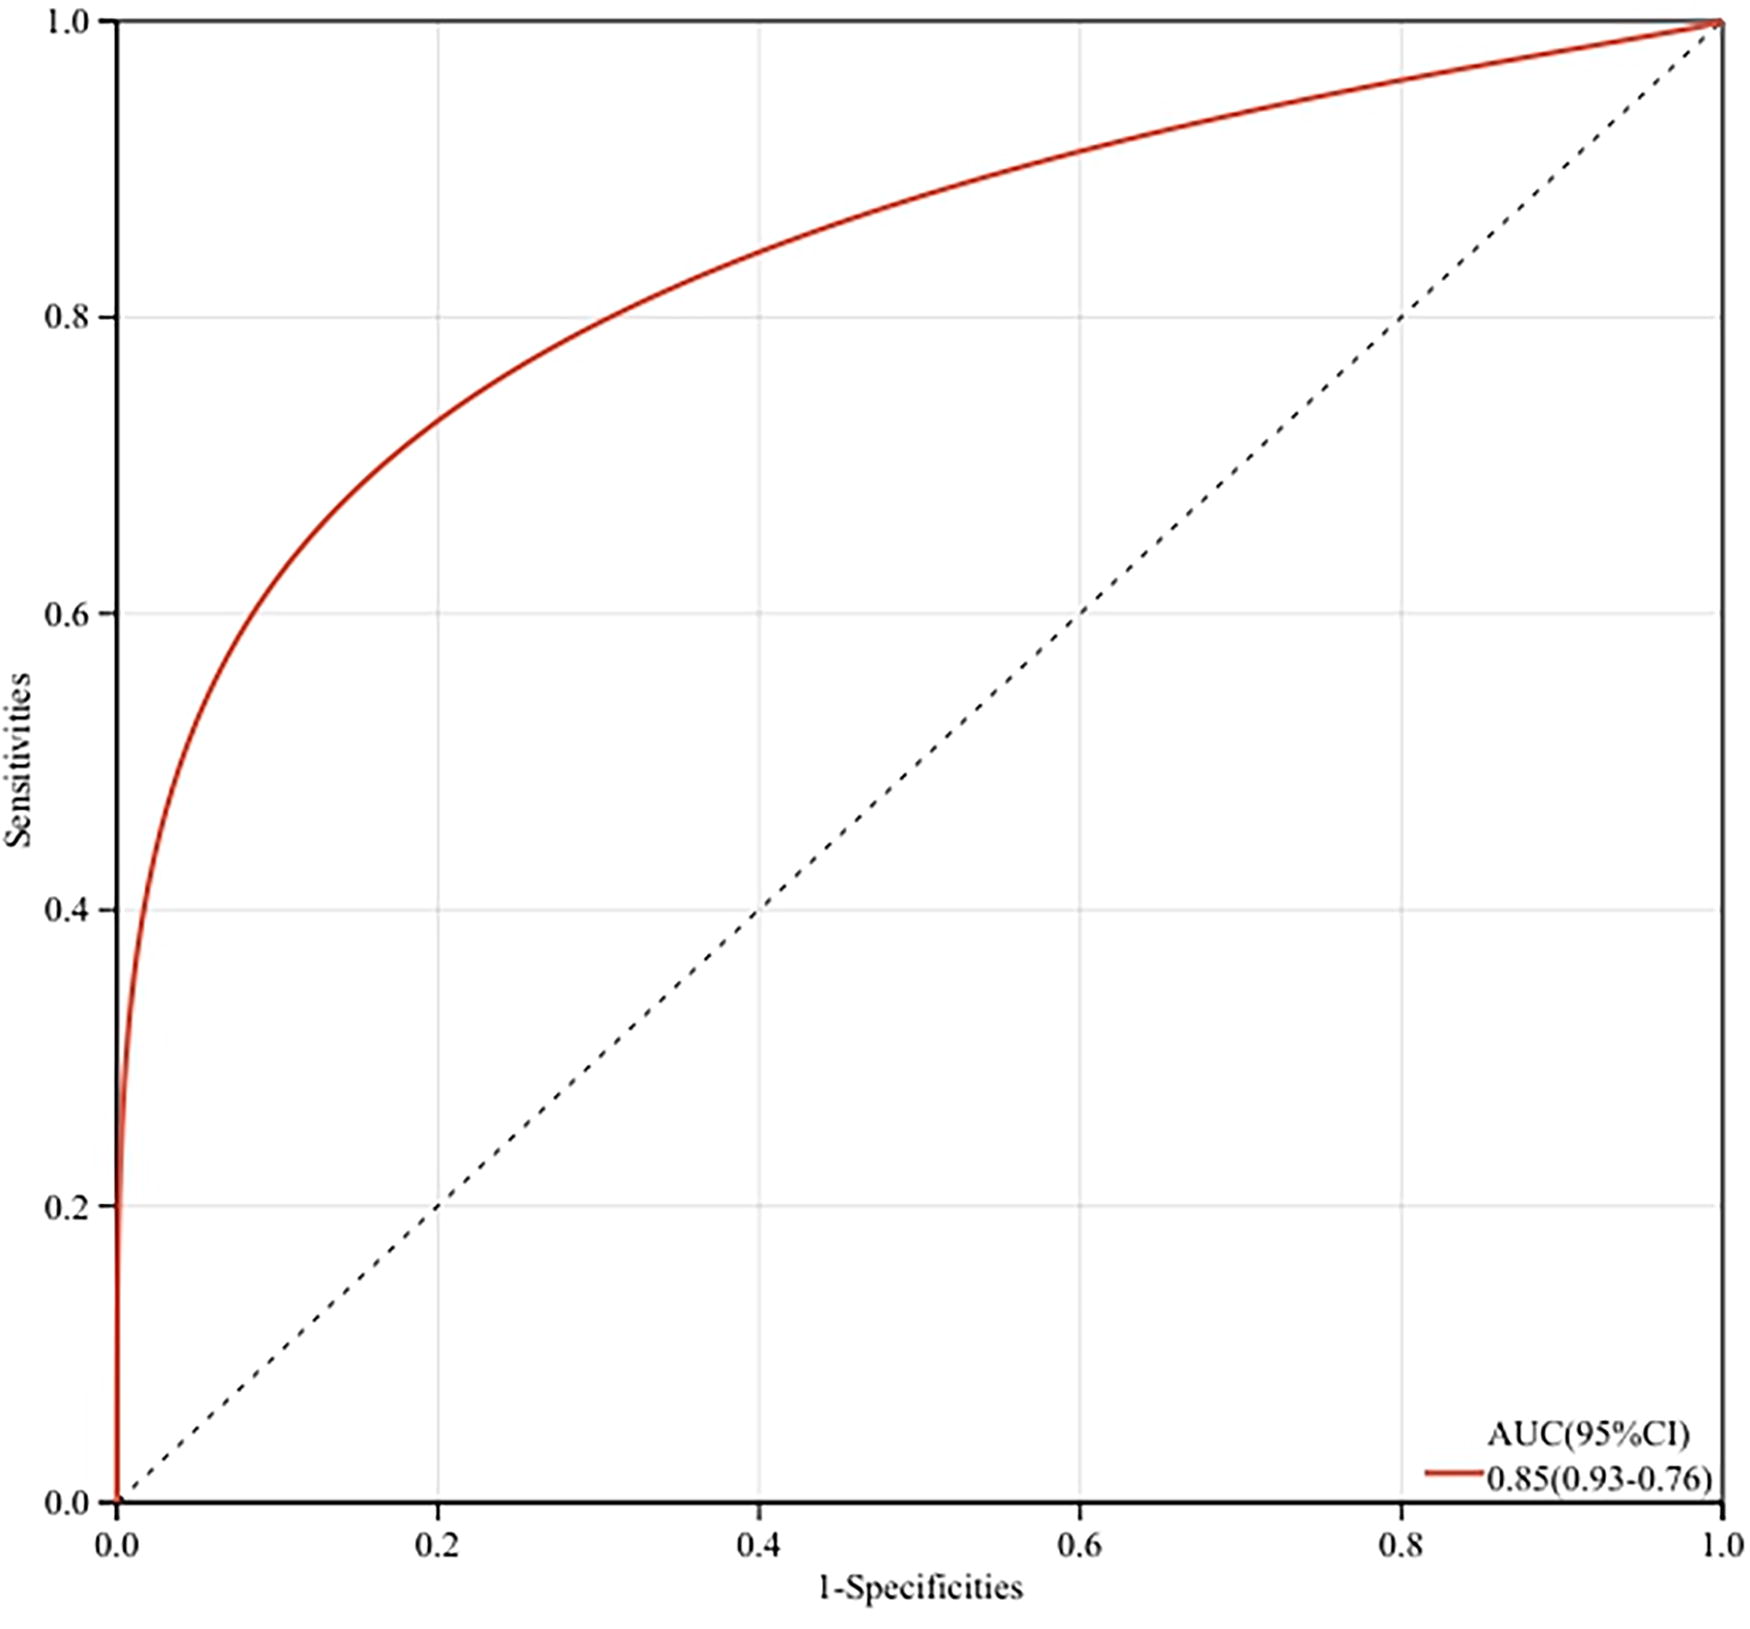
The support vector machine (SVM) model achieved a correct classification rate of 77.38% (sensitivity: 83.00%; specificity: 71.00%; and area under the receiver operating characteristic curve: 0.8500) with the features of MSE/ReHo ratio of cluster 1, cluster 4, cluster 5, and cluster 10. The area under the ROC curve was shown. MSE, multiscale entropy; ReHo, regional homogeneity; ROC, receiver operating characteristic curve.
Validation analyses
To validate the reproducibility of our findings, we conducted an evaluation of the effectiveness of nonlinear/linear indices using MSE and ReHo. We observed significant overlaps between abnormal MSE-ReHo coupling and the MSE/ReHo ratio, specifically in brain regions such as the orbitofrontal cortex, left insula, left transverse temporal gyrus, left middle temporal gyrus, and left inferior temporal gyrus. Additionally, we found a negative correlation between MMSE scores and MSE-ReHo coupling specifically in the left orbitofrontal cortex (Spearman’s ρ = −0.407, p = 0.021). Detailed results can be found in Supplementary Table S4 and Figure 6.
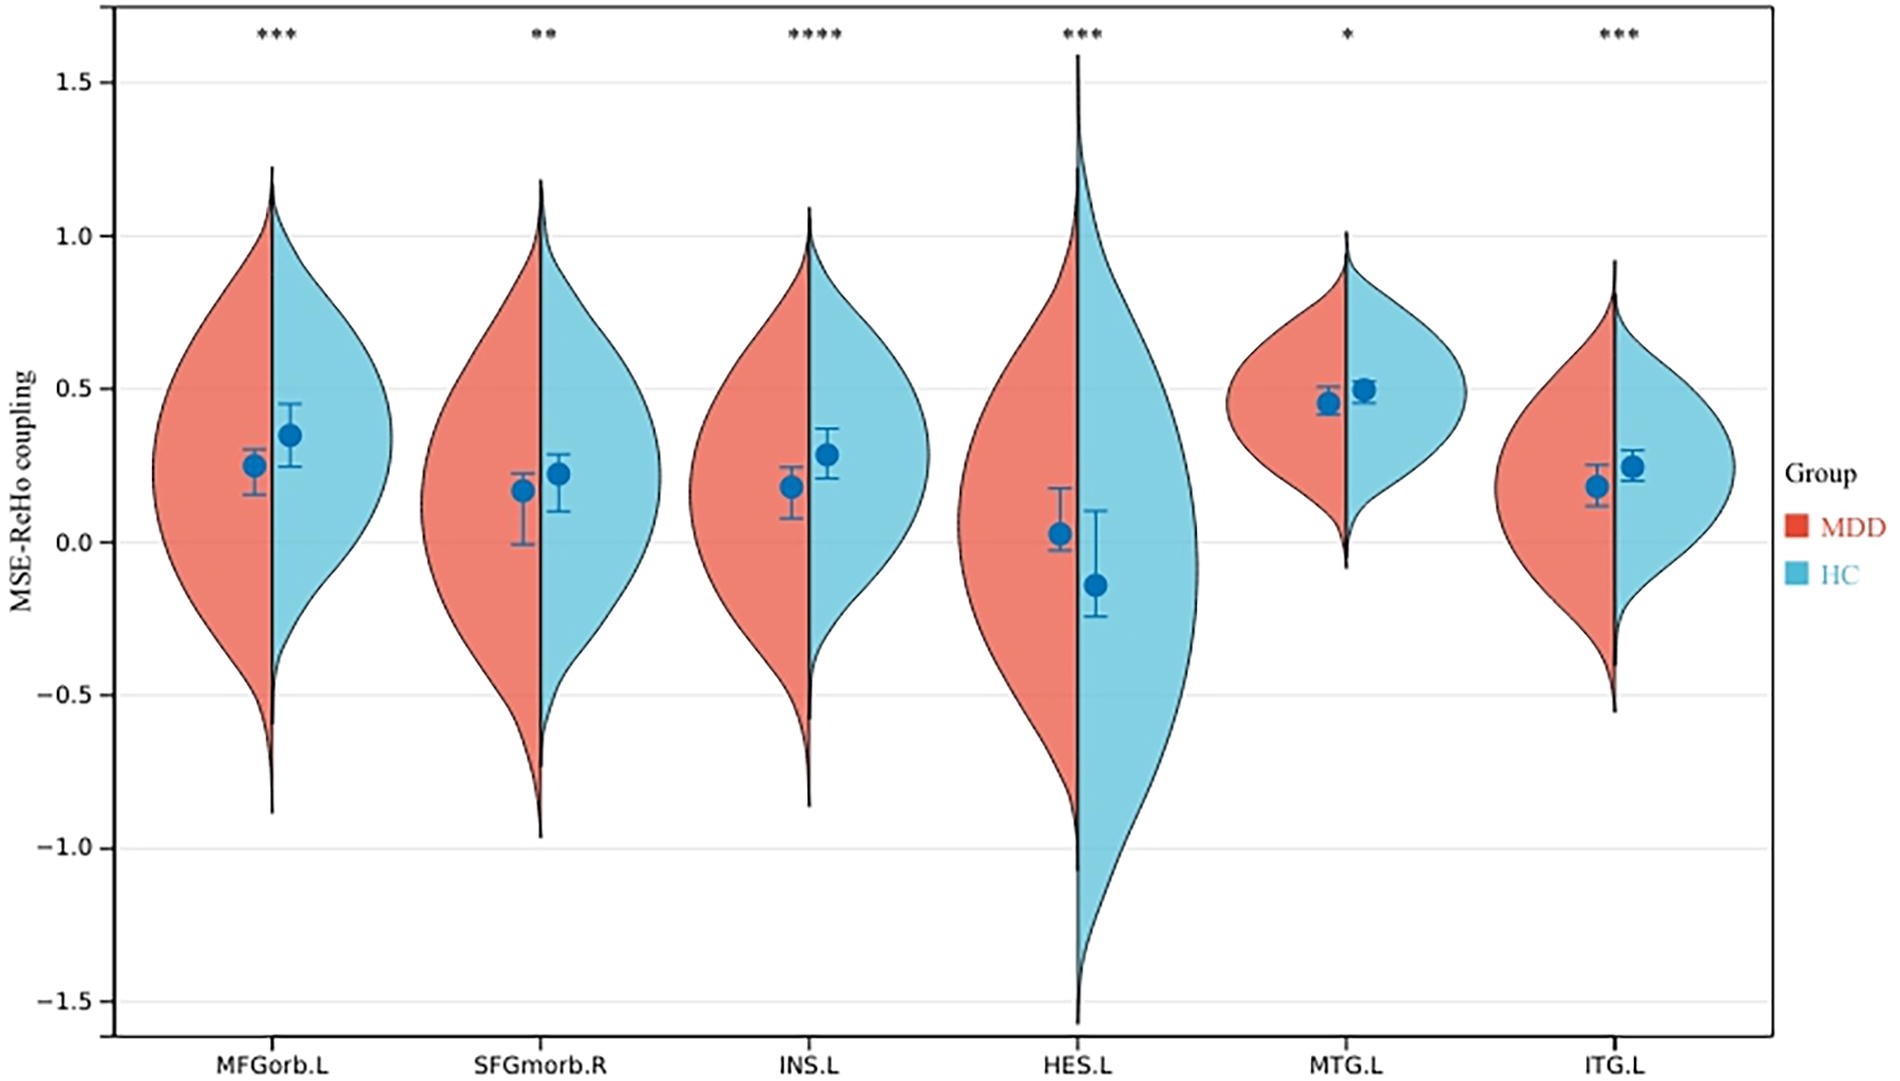
Regions showing significant changes in MSE/ReHo coupling values. HC, healthy controls; MDD, major depressive disorder; MFGorb.L, left middle orbitofrontal cortex; SFGmorb.R, right superior orbitofrontal cortex; INS.L, left insula; HES.L, left transverse temporal gyrus; MTG.L, left middle temporal gyrus; ITG.L, left inferior temporal gyrus; MSE, multiscale entropy; ReHo, regional homogeneity. *, p < 0.05; **, p < 0.01; ***, p < 0.001; ****, p < 0.0001.
Discussion
This present study integrated linear and nonlinear indices to investigate functional changes in brain regions of patients with MDD. Compared with HC, patients with MDD displayed elevated MSE/ReHo ratios, predominantly in the sensorimotor and cognition-emotion-related regions encompassing the orbitofrontal cortex, precuneus, and thalamus. In a validation cohort, similar differences were observed in regions such as the orbitofrontal cortex. Moreover, MSE/ReHo ratios within the right orbitofrontal cortex correlated positively with the HAMD scores, whereas MMSE correlated negatively with the sensorimotor areas, lingual gyrus, precuneus, and right thalamus. Notably, advanced multivariate pattern analysis using linear SVMs revealed that the MSE/ReHo ratio biomarker could effectively distinguish between patients with MDD and HC based on the ratios of all brain regions related to the severity of depressive symptoms and cognitive impairment, providing satisfactory sensitivity (83.00%), specificity (71.00%), accuracy (77.38%), and an area under the ROC curve (85.00%). These neuroimaging indices can serve as valuable biomarkers for diagnosing individuals with MDD and contribute significantly to our understanding of the neural mechanisms underlying the complexity of regional spontaneous neuronal activity in MDD.
Altered time series complexity, as indicated by changes in MSE, was observed in patients with MDD (Chen et al., 2024; Yu et al., 2024; Yun and Jeong, 2021). Specifically, patients with MDD exhibited reduced MSE in the left caudate and left angular gyrus compared with HC. This suggests that the time series complexity in these regions is lower in patients with MDD. It has been shown that the caudate gyrus and angular gyrus are involved in a variety of cognitive and affective processes, such as motor control, learning, emotional processing, memory, and reward processing (Liu et al., 2012; Lu et al., 2023; Wang et al., 2020), so it can be inferred that brain function is impaired in patients with MDD in these areas.
In our study, patients diagnosed with MDD exhibited reduced ReHo values in multiple brain regions. Specifically, these regions included the bilateral middle temporal gyrus, posterior central gyrus, lingual gyrus, calcarine gyrus, precentral gyrus, insula, middle frontal gyrus, superior frontal gyrus, thalamus, left rectus, left precuneus, and orbitofrontal cortex. This finding indicates that patients with MDD exhibit relatively low ReHo in these regions. Notably, the orbitofrontal–hippocampal pathway plays a crucial role in alleviating depression symptoms following transcranial magnetic stimulation treatment (Han et al., 2023; Tadayonnejad et al., 2022). Additionally, ketamine treatment resulted in increased metabolism in certain brain regions in patients with MDD. These regions included the bilateral occipital cortex, right sensorimotor cortex, left parahippocampal cortex, and left inferior parietal cortex. Notably, improvements in depression scores were positively correlated with metabolic changes observed in the right superior temporal gyrus and middle temporal gyrus (Carlson et al., 2013). Thus, brain activity in these regions has an important role in patients with MDD.
Patients with MDD displayed increased MSE/ReHo ratios in multiple brain regions, including the bilateral postcentral gyrus, precentral gyrus, lingual gyrus, calcarine gyrus, rectus gyrus, thalamus, and orbitofrontal cortex, in comparison to HC. This result suggests that patients with MDD have more chaos compared with HC in these brain regions, indicating that the brain is in a more disorganized state. Prior studies have reported alterations in brain regions involved in sensory processing, motor regulation, and cognitive control associated with emotion regulation in patients with MDD. Specifically, the sensorimotor cortex, orbitofrontal cortex, thalamus, lingual gyrus, and talar cortex exhibit normal mean signal MSE but reduced ReHo, indicating that the elevated MSE/ReHo ratios in these regions are primarily driven by reduced ReHo. This abnormality may partially account for the cognitive and emotional abnormalities observed in patients with MDD. The elevated MSE/ReHo in the orbitofrontal cortex, a key region involved in emotion regulation, may contribute to affective disorders in MDD (Hamazaki et al., 2015; Tadayonnejad et al., 2022). Furthermore, patients with MDD display decreased activity levels, impaired motor coordination, and precision, suggesting aberrant functioning of the sensorimotor cortex. These abnormalities can be attributed to disruptions in neural circuits and neurotransmitter systems involved in emotion regulation. Further research is necessary to gain a comprehensive understanding of how depression affects sensorimotor cortex function (Frost Bellgowan et al., 2015). The thalamus, a pivotal node in multiple functional circuits supporting cognitive function, including memory and executive functioning, exhibits elevated MSE/ReHo ratios, potentially impacting thalamocortical circuits and contributing to cognitive deficits in patients with MDD (Cooper et al., 2020; Nugent et al., 2013; Schneck et al., 2021). Additionally, the lingual gyrus, located in the visual cortex, not only participates in visual encoding but also modulates inhibition and divergent thinking (Couvy-Duchesne et al., 2018; Zhang et al., 2016). Impairments in attention regulation and inhibition mechanisms in this region may be implicated in pathological processes, leading to heightened preoccupation with somatic sensations. Support for this hypothesis comes from various rs-fMRI studies confirming the involvement of the lingual gyrus in pain modulation and psychiatric conditions (Jung et al., 2014).
We observed a positive correlation between the MSE/ReHo ratio and HAMD scores in the orbitofrontal cortex, indicating that higher MSE/ReHo ratios (primarily driven by lower ReHo) are associated with more severe depressive symptoms in patients with MDD. Previous research has demonstrated a correlation between the functional connectivity of the orbitofrontal cortex and hippocampus and the expression of depressive symptoms. This suggests that the orbitofrontal cortex may serve as a potential target for alleviating depressive symptoms, as hypothesized based on the lower ReHo observed in patients with MDD, which affects the collaboration between the orbitofrontal cortex and other brain regions and contributes to the emergence of depressive symptoms (Han et al., 2023). Similarly, we found a negative correlation trend between the MSE/ReHo ratios in the sensorimotor cortex, thalamus, lingual gyrus, and calcarine gyrus and MMSE scores, indicating that higher MSE/ReHo ratios (primarily driven by lower ReHo) are associated with lower MMSE scores and greater cognitive impairment in patients with MDD. Patients with MDD exhibit lower ReHo in these brain regions compared with healthy individuals. The sensorimotor cortex is known to play a crucial role in motor learning and memory, with repetition of movements enhancing neural connections between the sensorimotor cortex and other brain regions, thereby potentially improving motor performance and memory consolidation (Kumar et al., 2019). Additionally, the sensorimotor cortex is involved in encoding and retrieving sensory and perceptual memories. Damage to these areas may lead to impairment in visual or tactile memory. The sensorimotor cortex also interacts with the hippocampus and prefrontal cortex to support memory processing and consolidation, where the hippocampus is responsible for forming new memories, and the prefrontal cortex is involved in working memory and decision-making (Goard et al., 2016; Kumar et al., 2019). The thalamus, lingual gyrus, and calcarine gyrus are brain regions implicated in memory processes, particularly in the context of visual memory. The thalamus serves as a relay station for sensory information, including visual information, by receiving input from the retina and transmitting it to the visual cortex, including the lingual gyrus and calcarine gyrus (Ferraris et al., 2021; Pergola et al., 2018; Roy et al., 2022). The lingual gyrus is involved in visual processing and the recognition and perception of visual stimuli, while the calcarine gyrus specializes in processing visual information in the central visual field. These regions work together to encode, store, and retrieve visual memories (Chen et al., 2020; Shang et al., 2021; Watkins et al., 2012). The thalamus also plays a role in regulating attention and arousal, which are essential factors in memory formation and retrieval (Pardi et al., 2020; Toader et al., 2023). It is important to note that memory is a complex process involving multiple brain regions, and the thalamus, lingual gyrus, and calcarine gyrus represent only a subset of regions involved in visual memory. Other regions such as the hippocampus and prefrontal cortex also play crucial roles in different aspects of memory. In summary, the relationship between the thalamus, lingual gyrus, calcarine gyrus, and memory underscores the interconnectivity of various brain regions in the formation and retrieval of visual memory.
In voxel-level analyses, certain brain regions with no notable between-group differences in MSE and ReHo exhibited significant differences in the MSE/ReHo ratios between patients with MDD and HC. Subsequent ROI analyses revealed relatively higher MSE and lower ReHo in these regions among patients with MDD compared with HC (see Supplementary Fig. S5). The MSE/ReHo ratios may amplify between-group differences, enabling the identification of MDD-related abnormality in regions that would not be detected using MSE or ReHo analyses at the same statistical thresholds. Moreover, no brain regions exhibited significant between-group differences in both MSE and ReHo. Together, these results suggest that MSE, ReHo, and MSE/ReHo ratios offer complementary information and should be utilized synergistically to elucidate pathological changes in MDD.
Our study’s validation cohort revealed significant overlap between the brain regions exhibiting increased MSE-ReHo coupling and altered MSE/ReHo ratios in HC, namely, the orbitofrontal cortex, left insula, left transverse temporal gyrus, left middle temporal gyrus, and left inferior temporal gyrus. Furthermore, we found a negative correlation between MMSE scores and MSE-ReHo coupling in the left orbitofrontal cortex. These findings provide further support for the hypothesis that the orbitofrontal cortex may serve as a promising target for future treatment strategies.
This study has several limitations. First, the relatively small sample size necessitates further investigations with larger cohorts to validate our findings. Second, the inclusion of predominantly medicated patients with MDD introduces potential confounding factors that may impact interpretation. Future studies focusing on medication-free, first-episode patients with MDD are necessary to mitigate the influence of medication and verify our study’s outcomes. Third, the utilization of a cross-sectional design falls short of establishing a definitive causal relationship between imaging indices and clinical symptoms. Longitudinal studies, incorporating pre- and post-treatment comparisons, are indispensable for confirming such a causal relationship and elucidating the functional significance of biomarkers. Moving forward, refining the study design is essential to enhance clarity regarding the causal relationship and bolster the reliability of the results.
Conclusions
Our study utilized rs-fMRI in conjunction with both nonlinear and linear techniques to identify abnormal ratios of MSE/ReHo ratios in patients diagnosed with MDD. Specifically, we observed increased MSE/ReHo ratios in brain systems associated with the orbitofrontal cortex, sensorimotor, and visual processing. This result suggests that patients with MDD have more chaos compared with HC in these brain regions. It is the disordered state of the brain in patients with MDD that causes the weakening of specific brain regions, thereby resulting in the clinical symptoms observed in these patients. Moreover, these ratios exhibited significant correlations with the severity of MDD symptoms in corresponding brain regions. These findings provide evidence that uncertain and irregularly dynamic brain activity contributes to ineffective visual stimulation and somatosensory sensation, consequently impairing the homogeneity of local brain regions. Thus, this aberrant neural mechanism may underlie the pathophysiology of symptoms in individuals with MDD.
Footnotes
Acknowledgments
The authors sincerely appreciate the cooperation of all participants in our study and thank the Anhui Provincial Mental Health Center and the University of Science and Technology of China for their support.
Data Availability Statement
All data generated or used during the study are available from the corresponding author by request.
Authors’ Contributions
Y.T. and Y.W. designed the study methodology. N.D., H.W., Y.Y., Y.J., and X.X. were involved in recruiting participants and assessing and documenting clinical performance. S.F. analyzed the imaging data. R.Q. edited the article. S.F. and R.Q. are both the first authors of this article.
Author Disclosure Statement
No competing financial interests exist.
Funding Information
This study was financially supported by the National Natural Science Foundation of China (No. 32071054) and the Research Fund of Anhui Institute of Translational Medicine (No. 2021zhyx-B10).
Supplementary Material
Supplementary Figure S1
Supplementary Figure S2
Supplementary Figure S3
Supplementary Figure S4
Supplementary Figure S5
Supplementary Table S1
Supplementary Table S2
Supplementary Table S3
Supplementary Table S4
References
Supplementary Material
Please find the following supplemental material available below.
For Open Access articles published under a Creative Commons License, all supplemental material carries the same license as the article it is associated with.
For non-Open Access articles published, all supplemental material carries a non-exclusive license, and permission requests for re-use of supplemental material or any part of supplemental material shall be sent directly to the copyright owner as specified in the copyright notice associated with the article.