
Abstract
Background:
Central nervous system complications are common in sickle cell disease (SCD), and the defining associated biomarkers are becoming increasingly relevant for physicians in diagnostic and prognostic contexts. Recent studies have reported altered brain connectivity in pain processing, highlighting a new avenue for developing sensitive measures of SCD severity.
Method:
This cross-sectional study used graph theory concepts to analyze effective connectivity in individuals with SCD and healthy controls during rest and motor imagery tasks. The SCD group was further divided into two subgroups based on pain intensity (less pain or more pain) during the evaluation.
Results:
Individuals with SCD and chronic pain exhibited a distinct brain connectivity signature compared to healthy individuals and within pain sublevels.
Conclusion:
Chronic pain in SCD shows a unique brain connectivity pattern when compared to healthy subjects and across different pain levels. The results support the hypothesis that chronic pain condition is associated with decreased interhub connections and increased intrahub connections for specific brain rhythms. Furthermore, the small-world parameter can distinguish SCD individuals from controls and differentiate pain levels within SCD individuals, offering a promising biomarker for clinical assessment.
Impact Statement
Chronic pain exhibits a different brain connectivity signature compared to healthy subjects and across sublevels of pain. The results support the hypothesis that chronic pain is associated with decreased interhub connections and increased intrahub connections for specific brain rhythms.
Introduction
Understanding brain function remains a challenge, particularly in how neural networks balance segregation and integration. Communities of interconnected regions support specialized functions, whereas hubs facilitate global information exchange, a concept central to “whole-brain connectomics” (Sporns, 2013; Lord et al., 2017).
Brain connectivity analysis, applied to resting-state and motor imagery (MI) tasks, models brain networks using graph theory. In this framework, brain regions are the nodes of the network, and their connections form the edges (Sporns et al., 2004; Bullmore and Sporns, 2012). The complexity of these graphs is evaluated using clustering and interconnection parameters, distinguishing regular from randomized networks with neurophysiological correlates (Sporns et al., 2004; Bullmore and Sporns, 2012). A measure of graph interconnectedness is the average path length (L), which represents the average number of steps from one node to another along the shortest path. A measure of graph density is the average clustering coefficient (C), which represents the proportion of connections between neighboring nodes, favoring the processing of specialized and segregated information in brain networks (Duncan and Strogatz, 1998; Sporns et al., 2004; Bullmore and Sporns, 2012). Some networks exhibit a small-world (SW) architecture, characterized by a low L and high C, optimizing both local processing and global integration (Smit et al., 2008; Humphries et al., 2017).
Research suggests that SW organization in the human brain supports efficient functional integration and provides insights into brain function (Sporns et al., 2004; Van den Heuvel et al., 2008; Wang et al., 2010; Bullmore and Sporns, 2012; Stam, 2014; Bernhardt et al., 2015). Meanwhile, chronic pain is linked to nervous system reorganization, with individuals exhibiting altered brain structure and function (Farmer et al., 2012; Liu et al., 2013; Mansour et al., 2016; Case et al., 2018; Ferdek et al., 2019; Santana et al., 2023). Studies indicate that migraine patients may show increased clustering and lower SW values (Liu et al., 2013), whereas individuals with sickle cell disease (SCD) often exhibit reduced clustering and a random network pattern (Case et al., 2019). Such findings contribute to identifying unique pain signatures for different conditions (Liu et al., 2013; Pinheiro et al., 2016; Case et al., 2019; Santana et al., 2023).
Despite these advances, evidence on brain connectivity in chronic pain remains inconsistent, as pain-related neuroplasticity varies across conditions and is influenced by clinical and sociodemographic factors. Additionally, connectivity analyses depend on imaging techniques and modeling approaches. Notably, no studies have specifically examined connectivity disruptions in individuals with hip osteonecrosis-related pain during rest and MI tasks. In MI, individuals imagine performing daily activities, experiencing the painful phenomenon without actual movement (Malouin et al., 2007).
This study aims to analyze brain network connectivity by exploring directed interactions in electroencephalography (EEG) signals. We apply convergent cross mapping (CCM) (Sugihara et al., 2012) to assess causal relationships and information flow between signals, providing new insights into physiological states (McCracken and Weigel, 2014; McBride et al., 2015; Jiang et al., 2016; Hirata et al., 2016; Schiecke et al., 2017). A previous study used this method and demonstrated that individuals with temporomandibular disorder (TMD) and chronic pain had lower SW values in the delta (δ), theta (θ) and alpha (α) bands compared to healthy individuals (Ito et al., 2024). We apply CCM to examine brain topology in individuals with SCD and hip osteonecrosis-related chronic pain, comparing rest and MI states. Our hypothesis is that chronic pain promotes changes in brain circuitry parameters and overall network efficiency.
Material and Methods
The study was approved by the Research Ethics Committee of the Adventist Institution of Bahia, Brazil, through Certificate of Presentation for Ethical Appreciation no. 31237514.1.0000.0042 and was conducted at the Health and Functionality Study Group, Institute of Health Sciences-Federal University of Bahia, Brazil. All individuals signed an Informed Consent Form after receiving verbal and written information about the study procedures.
Study design
This is a cross-sectional study.
Participants
This study included individuals with SCD (diagnosis obtained through hemoglobin electrophoresis) and chronic pain secondary to hip osteonecrosis (confirmed by a specialist based on radiological and clinical findings) lasting at least 6 months, aged between 18 and 50 years. Individuals with neuropathic pain, screened through the Douleur Neuropathique-4 (DN4) questionnaire (Santos et al., 2010) who scored positive for more than 4/10 were excluded from the study. The individuals were referred from reference centers for DF treatment in the city of Salvador and other municipalities in Bahia. If on the day of the assessment the participant presented a vaso-occlusive crisis, he/she was advised to seek emergency medical care, the assessment was suspended and rescheduled for another time.
For the control group, the inclusion criteria were healthy individuals (HC)—without chronic pain and SCD—matched by sex and age to the SCD group. The SCD group was further divided into two subgroups according to pain intensity during the evaluation and a similar method was used in another study by our group (Santana et al., 2023). The group with SCD and Less Pain (SCD-LP) consisted of individuals with pain intensity ≤5.5/10, and the group with SCD and More Pain (SCD-MP) included individuals with pain intensity >5.5/10 (the threshold of 5.5/10 is the median value of the SCD group).
Procedure
All individuals completed a screening form regarding sociodemographic and clinical data. Pain intensity was assessed using the Visual Analogue Scale (VAS), which ranges from no pain to the worst possible pain (intensity of 0–10) (Gift, 1989). Psychoaffective symptoms were investigated using the Hospital Anxiety and Depression Scale (HAD) being classified as having anxiety, those with a score greater than or equal to 8, and as having depression, those with a score greater than or equal to 9 (Castro et al., 2006). Additionally, all individuals were trained to perform kinesthetic MI, using the respective questionnaire (Malouin et al., 2007). This questionnaire contains 10 items and for each item the volunteer is instructed to imagine the sensation of performing that movement, without moving body structures. The volunteer then evaluates the intensity of the imagined sensation using a scale ranging from 1 (“no sensation”) to 5 (“intense sensation, as if performing the movement”). EEG recordings were made with 31 gold electrodes placed on the scalp (Fp1, Fp2, F3, F4, F7, F8, FC3, FC4, FT7, FT8, C3, C4, CP3, CP4, P3, P4, T3, T4, TP7, TP8, T5, T6, O1, O2, Oz, Fpz, Fz, FCz, Cz, CPz, Pz), according the international 10/10 system, with reference to the Cz electrode. Electrode impedance was maintained below 5 kΩ. Data were collected at a frequency of 600 Hz, amplified by the BrainNet signal acquisition system (BrainNet EMSA, Brazil), and filtered at 60 Hz.
Electroencephalographic acquisition
EEG evaluation was performed in a Faraday cage, with the room kept semi-lit and at a comfortable temperature (18°C–22°C). The recording was divided into three stages: (1) Resting state: for four minutes, the individual remained with eyes closed, in a wakeful state; (2) Hand MI: for the nonpainful MI task, the participant was asked to mentally simulate the opening and closing of the dominant hand; (3) Hip MI: for the painful MI task, the participant was asked to mentally simulate flexion and abduction of the painful hip. The HC group, which had no pain, was asked to perform left Hip MI. All MI tasks were guided by a recorded audio and were performed for 2 min, with the eyes closed. Electromyographic activity was also recorded to ensure that no muscle activity occurred during MI. Electrodes were placed on the flexors of the dominant hand’s fingers in both groups; and on the gluteus medius muscle of the most painful hip for individuals with SCD, or on the left hip gluteus medius for the HC group.
Construction of effective networks
To calculate the effective connectivity, we used the nonlinear causality measure CCM (Sugihara et al., 2012) which captures the nonstationary coupling effects between brain regions through EEG signal interactions.
Let X = {x1
,..., xn
} and Y = {y1
,..., yn
} be two n-length EEG signals (pair of channels). First we determine Xvec
, the phase space reconstruction of X using time lagged embedding coordinates with dimension m and time interval τ, defined as:
Then, for each vector the Euclidean distances from the distance-related weights: the normalized weights: the Y scalar value estimated by
We define the CCM
XY
from the source signal X to the target signal Y, as the correlation between
Considering a dynamic and narrowband analysis, we evaluated CCM matrices in 1 s time windows within five different neural rhythms delta - δ (0.5−3.5 Hz), theta - θ (4−7 Hz), alpha - α (8−12 Hz), beta- β (13–30 Hz) and gamma - γ (32−45Hz). The diagonal values (self-causality) were discarded, and we considered the absolute values of CCM to analyze the connectivity strength. For each connectivity matrix, the median value was chosen as a threshold to define the respective binary adjacency matrix or graph (0 if lower than the median and 1 otherwise). The graph analysis was performed considering three complexity measures: the average path length (L), the average clustering coefficient (C), and the SW parameter (S) (Duncan and Strogatz, 1998). Following the ideas reported in Smit et al (2008), for each graph, we evaluated the parameters L, C, and S. In Figure 1, the workflow of the pipeline is depicted.

Pipeline workflow. For each individual the channel EEG signals are decomposed in the neural rhythms Delta (δ), Theta (θ), Alpha (α), Beta (β), and Gamma (γ). For each 1 s time window CCM is evaluated among channels within the specific neural rhythm providing information about the brain connectivity (
Variables
Shortest Path Length (L): this is the shortest number of edges from one node to another and is related to global efficiency.
Clustering coefficient (C): this represents the proportion of connections between neighboring nodes and is related to local efficiency.
Small-world parameter (S): defined as the ratio between C and L, when S is greater than one, the network exhibits the SW feature. It combines both local and global network efficiency.
Statistical analysis
Statistical analyzes were performed using the MATrix LABoratory (MATLAB) software, version 2018 b. Data normality was assessed using the Kolmogorov–Smirnov test. For categorical variables (gender, ethnicity, education level, genotype), results were presented as absolute and percentage values. For continuous data with normal distribution, the mean and standard deviation were presented. Data with asymmetrical distribution were presented as the median and interquartile range. Unpaired categorical variables were compared using the chi-square test or Fisher’s exact test. For independent data analysis, the Mann–Whitney test was used. Graph parameter values (C, L, and S) for the neural rhythms Delta (δ), Theta (θ), Alpha (α), Beta (β), and Gamma (γ) were aggregated by group and stage. Considering a robust estimate of data variability, we select the interquartile range for each distribution. To check for statistical significance, the Wilcoxon signed rank test and the Friedman test (both Bonferroni-corrected) were used for inter- and intragroups comparisons, respectively, with a 95% confidence level.
Results
Sociodemographic and clinical data
This study included 22 individuals with SCD and chronic pain in the hip, and 18 HC. Tables 1 and 2 provide information about the sociodemographic and clinical data of the study population.
Sociodemographic and Clinical Data of Individuals with Sickle Cell Disease and Healthy Controls
Bold indicates statistically significant difference.
t test for independent samples.
Chi-square test.
Fisher’s exact test.
Median (interquartile range).
HAD, Hospital Anxiety and Depression Scale; HC, healthy controls; SCD, sickle cell disease; SD, standard deviation; VAS, Visual Analog Scale.
Clinical Data of Subgroups of Sickle Cell Disease (SCD) with Less Pain (VAS ≤ 5.5/10) and SCD with More Pain (VAS > 5.5/10)
Bold indicates statistically significant difference.
Fisher’s exact test.
Mann–Whitney test.
IR, interquartile range; HAD, Hospital Anxiety and Depression Scale; SCD-LP, SCD and Less Pain; SCD-MP, SCD and More Pain; VAS, Visual Analog Scale.
Clustering coefficient (C)
The C parameter was lower in individuals with SCD (Table 3) across all neural rhythms and EEG recording stages (Fig. 2A).
Comparing the Medians and Interquartile Intervals of Healthy Controls and SCD Groups in Intergroup Analysis by Session and by Frequency Band for Clustering Coefficient Parameter
Displayed values exhibited statistical differences with p-value < 0.05. Sample size by session and by band: Delta (δ): I - 2449 / II - 1499 / III - 1700 | Theta (θ): I - 2449 / II - 1499 /III - 1700 | Alpha (α): I - 2449 / II - 1499 / III - 1700 | Beta (β): I - 2449 / II - 1499 / III - 1700 | Gamma (γ): I - 2449 / II - 1500 / III - 1699.
Healthy
Controls.
Sickle Cell Disease.
Bonferroni-corrected Friedman test.
Hand Motor Imagery.
Hip Motor Imagery.

Distribution of network parameters in Healthy Controls (HC) and individuals with sickle cell disease (SCD) during Resting state (I), Hand Motor Imagery (II), and Hip Motor Imagery (III).
The SCD-MP subgroup exhibited higher C values in the theta (θ), beta (β) and γ (gamma) rhythms across all stages (Fig. 3). The lowest values were observed in the delta (δ) rhythm at all stages and in the alpha (α) rhythm during Hand MI and Hip MI (Table 4).
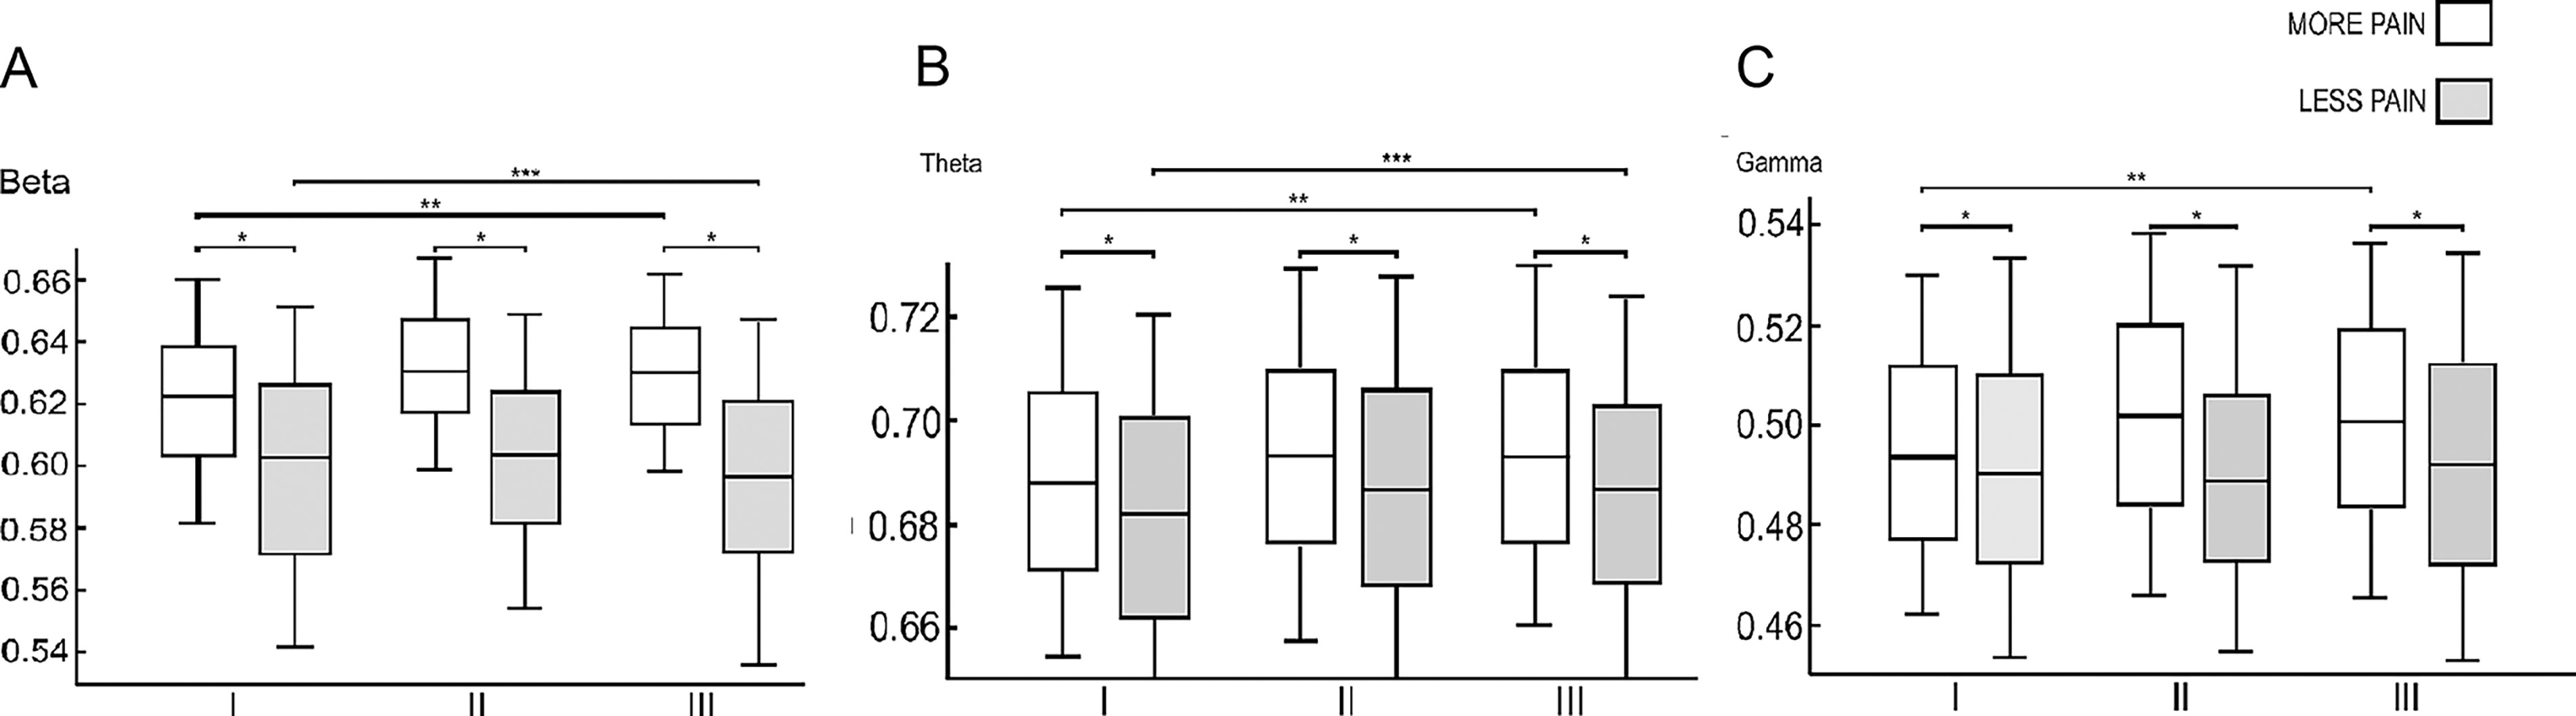
Distribution of clustering coefficient of sickle cell disease with less pain (SCD-LP) and sickle cell disease with more pain (SCD-MP) subgroups during Resting state (I), Hand Motor Imagery (II) and Hip Motor Imagery (III).
Comparing the Medians and Interquartile Intervals of More Pain and Less Pain Subgroups in Intergroup Analysis by Session and by Frequency Band for Clustering Coefficient Parameter
Displayed values exhibited statistical differences with p-value < 0.05, while the dashes represent non statistical values. Sample size by session and by band: Delta (δ): I - 1053/II - 643/III - 734 | Theta (θ): I - 1053/II - 643/III - 734 | Alpha (α): I - 1053/II - 643/III - 734 | Beta (β): I - 1053/II - 643/III - 734 | Gamma (γ): I - 1053/II - 643/III - 734.
Subgroups of Sickle Cell Disease with Less Pain.
Subgroups of Sickle Cell Disease with More Pain.
Bonferroni-corrected Friedman test.
Hand Motor Imagery.
Hip Motor Imagery.
Regarding parameter C, intragroup differences between SCD and HC groups were notable in the delta (δ) and gamma (γ) rhythms (Supplementary Table S1). In the δ rhythm, the SCD group showed the lowest value during Hand MI (χ 2 = 97.87, p < 0.01), whereas the HC group had the lowest value at rest (χ 2 = 95.23, p < 0.01). The opposite pattern was observed in the γ rhythm, where the SCD group had the lowest value at rest (χ 2 = 14.90, p < 0.01), whereas the HC group exhibited the lowest value during Hand MI (χ 2 = 25.76, p < 0.01).
The β rhythm distinguished the intragroup behavior of SCD-LP and SCD-MP subgroups (Supplementary Table S2). Individuals with SCD-LP had the highest values at rest and the lowest during Hip MI (χ 2 = 17.58, p < 0.01). In contrast, those with SCD-MP exhibited the highest values during Hand MI and the lowest at rest (χ 2 = 61.86, p < 0.01).
Shortest path length (L)
Regarding the L parameter, higher values were observed in the SCD group (Fig. 2B). The largest difference between groups (SCD vs. HC) occurred in the delta (δ) rhythm during Hip MI (U = 16.30; p < 0.01), a movement perceived as painful by individuals with SCD (Supplementary Table S3). Only in the γ rhythm, during Hip MI (U = −8.44; p < 0.01), did individuals with SCD exhibit the shortest path length.
In the SCD-MP subgroup, shorter L values were observed across all EEG stages in the α rhythm (Fig. 4). In contrast, in the β rhythm, individuals with SCD-MP showed longer L values throughout all EEG stages (Fig. 4). In the δ and θ rhythms, the longest L values in the SCD-MP group were found at rest (Table 5). However, in the θ rhythm, shorter L values were observed during Hip MI. In the γ rhythm, L was shorter during rest and longer during Hand and Hip MI in the SCD-MP subgroup.
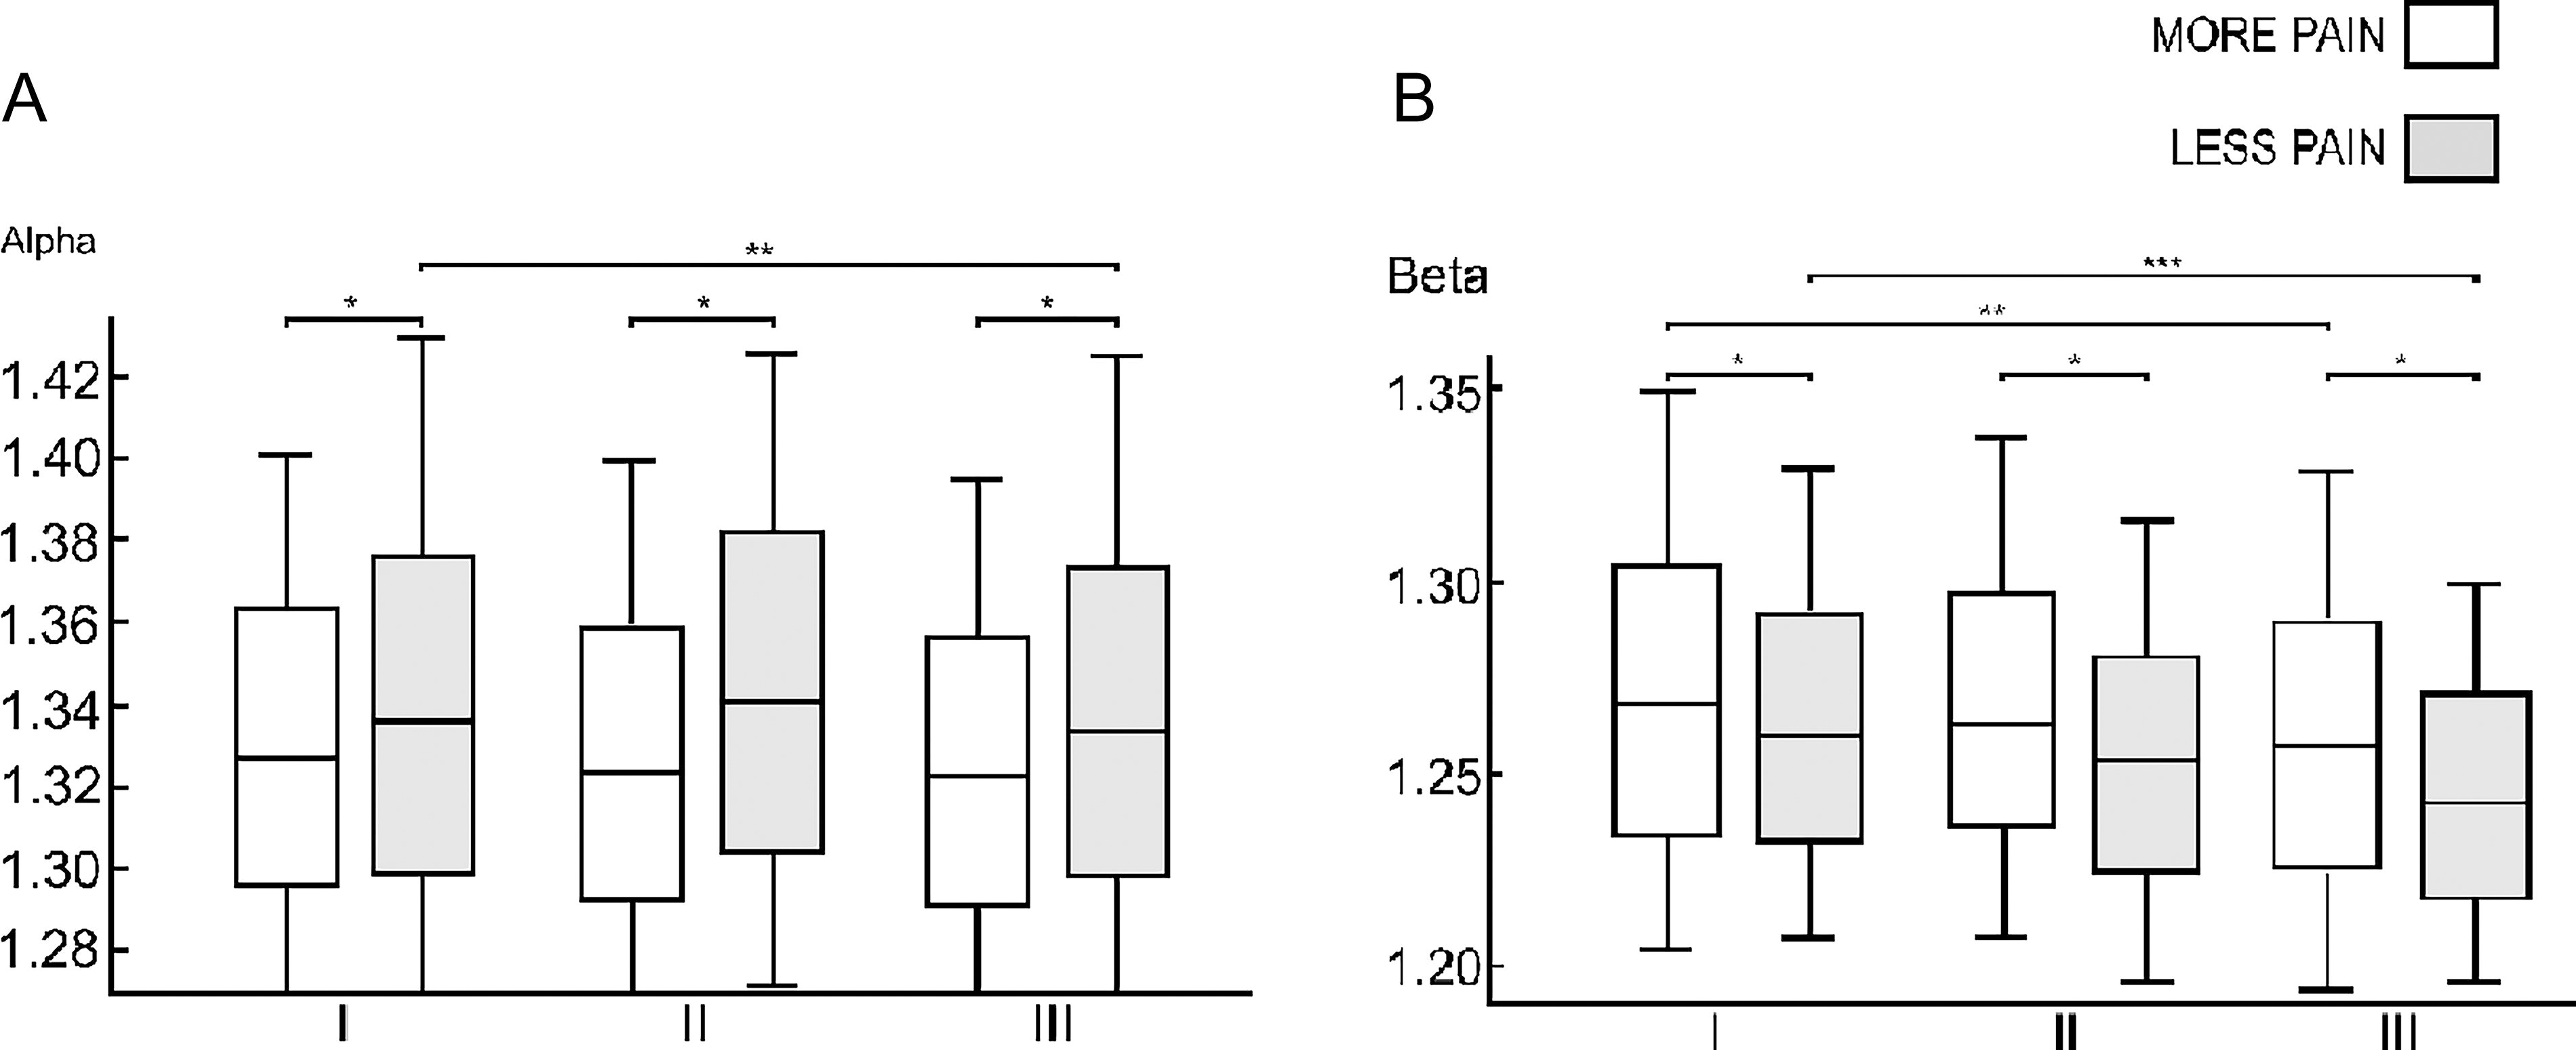
Distribution of shortest path length of Sickle Cell Disease with Less Pain (SCD-LP) and Sickle Cell Disease with More Pain (SCD-MP) subgroups during Resting state (I), Hand Motor Imagery (II), and Hip Motor Imagery (III).
Comparing the Medians and Interquartile Intervals of More Pain and Less Pain SCD Subgroups in Intergroup Analysis by Session and by Frequency Band for Shortest Path Length Parameter
Displayed values exhibited statistical differences with p-value < 0.05, while the dashes represent non statistical values. Sample size by session and by band: Delta (δ): I - 1053/II - 643/III - 734 | Theta (θ): I - 1055/II - 644/III - 737 | Alpha (α): I - 1059/II - 646/III - 737 | Beta (β): I - 1057/II - 648/III - 739 | Gamma (γ): I - 1057/II - 644/III - 738.
Subgroups of Sickle Cell Disease with Less Pain.
Subgroups of Sickle Cell Disease with More Pain.
Bonferroni-corrected Friedman test.
Hand Motor Imagery.
Hip Motor Imagery.
When analyzing intragroup differences in the L parameter, the α and β rhythms stand out (Supplementary Table S4). In the α rhythm, the SCD group had the longest L values during Hand MI (χ 2 = 7.18, p = 0.03), whereas the HC group showed the highest values at rest (χ 2 = 10.30, p < 0.01). In the β rhythm, the SCD group exhibited the highest L value at rest and the lowest during Hip MI (χ 2 = 76.56, p < 0.01), whereas the HC group had the highest value during Hip MI and the lowest during Hand MI (χ 2 = 33.55, p < 0.01).
The γ rhythm differentiates the intragroup behavior of the SCD-LP and SCD-MP subgroups (Supplementary Table S5). In this frequency band, individuals with SCD-LP had the highest L values at rest (χ 2 = 141.23, p < 0.01), while those with SCD-MP exhibited the highest values during Hand MI (χ 2 = 32.17, p < 0.01). In both subgroups, the lowest values occurred during Hip MI (Table 5).
Small-world (S)
S values were lower in individuals with SCD across all neural rhythms during both the resting state and MI tasks (Table 6). This suggests that the HC group exhibits greater global effective connectivity efficiency (Fig. 2C).
Comparing the Medians and Interquartile Intervals of Healthy Controls and SCD Groups in Intergroup Analysis by Session and by Frequency Band for Small World Parameter
Displayed values exhibited statistical differences with p-value < 0.05. Sample size by session and by band: Delta (δ): I - 2447/II - 1486/III - 1696 | Theta (θ): I - 2449/II - 1497/III - 1700 | Alpha (α): I - 2445/II - 1495/III - 1696 | Beta (β): I - 2447/II - 1496/III - 1698 | Gamma (γ): I - 2448/II - 1499/III – 1697.
Healthy Controls.
Sickle Cell Disease.
Bonferroni-corrected Friedman test.
Hand Motor Imagery.
Hip Motor Imagery.
In the β and γ rhythms, the SCD-MP subgroup showed the highest S-values across all EEG stages (Table 7). In the delta (δ) rhythm, SCD-MP individuals had lower SW values at rest (U = 4.48; p < 0.01) and during Hip MI (U = −19.64; p < 0.01), whereas in the θ rhythm, they exhibited higher SW values during Hand (U = −4.04; p < 0.01) and Hip MI (U = −7.04; p < 0.01) (Table 7). In the α rhythm, higher SW values were observed in the SCD-MP group only during Hip MI (U = −6.83; p < 0.01) (Fig. 5).
Comparing the Medians and Interquartile Intervals of More Pain and Less Pain Subgroups in Intergroup Analysis by Session and by Frequency Band for Small World Parameter
Displayed values exhibited statistical differences with p-value < 0.05, while the dashes represent non statistical values. Sample size by session and by band: Delta (δ): I - 1052/II - 642/III - 734 | Theta (θ): I - 1053/II - 642/III - 733 | Alpha (α): I - 1051/II - 643/III - 734 | Beta (β): I - 1054/II - 642/III - 732 | Gamma (γ): I - 1053/II - 653/III – 733.
Subgroups of Sickle Cell Disease with Less Pain.
Subgroups of Sickle Cell Disease with More Pain.
Bonferroni-corrected Friedman test.
Hand Motor Imagery.
Hip Motor Imagery.

Distribution of small-world of sickle cell disease with less pain (SCD-LP) and sickle cell disease with more pain (SCD-MP) subgroups during Resting state (I), Hand Motor Imagery (II) and Hip Motor Imagery (III).
When analyzing intragroup differences, the SCD and HC groups showed distinct patterns in the δ and θ rhythms (Supplementary Table S6). The SCD group exhibited the highest SW values during Hip MI (δ: χ 2 = 175.24, p < 0.01; θ: χ 2 = 16.55, p < 0.01), whereas the HC group showed the highest values during Hand MI (δ: χ 2 = 26.20, p < 0.01; θ: χ 2 = 27.40, p < 0.01).
The δ, α, and β rhythms distinguished the intragroup behavior of SCD-MP and SCD-LP subgroups (Supplementary Table S7). In the SCD-MP group, regardless of neural rhythm, the lowest values occurred at rest, and the highest during Hip MI (δ: χ 2 = 78.39, p < 0.01; α: χ 2 = 13.15, p < 0.01; β: χ 2 = 28.79, p < 0.01). Conversely, in the SCD-LP group, the lowest values were observed during Hand MI in the δ (χ 2 = 83.69, p < 0.01) and α (χ 2 = 11.01, p < 0.01) rhythms. Additionally, in the α rhythm, higher values were found at rest (χ 2 = 11.01, p < 0.01), while in the β rhythm, the lowest value occurred during Hip MI (χ 2 = 13.27, p < 0.01).
Discussion
The aim of this study was to investigate brain effective connectivity based on EEG signals of individuals with SCD and chronic pain associated with hip osteonecrosis. EEG provides high temporal resolution, capturing real-time brain dynamics. This feature allows for tracking dynamic changes using causality measures, such as CCM, which evaluates the dynamical state through cross-prediction information between brain regions. Causality estimation in brain signals can provide insight into fMRI connectivity results (which offer high spatial resolution) such as reduced activity in the default mode network and increased activity in pain-processing regions in individuals with SCD (Case et al., 2019). EEG and fMRI connectivity have different temporal and spatial domains and capture complementary aspects of neural activity and network interactions. Our findings indicate that EEG-derived neural networks differ between individuals with SCD and chronic pain and HC. Specifically, the SCD group exhibited lower clustering coefficients, greater path length, and reduced SW values compared to HC individuals. These results are innovative and may add to findings from other studies, highlighting the presence of maladaptive plasticity in this population. A study of functional connectivity using fMRI also found a lower clustering coefficient during resting state in individuals with SCD and more severe disease, assessed through the number of hospitalizations (Case et al., 2019). Moreover, Case et al. (2019) found an association between SCD severity and greater path length, which aligns with our results. The main differences between the studies are that our population has a specific chronic pain condition (hip osteonecrosis), which may be related to the severity of SCD, and the methods of obtaining and constructing the networks also differed between the studies.
On the other hand, functional and structural brain networks of individuals with migraine demonstrated higher values of clustering coefficient and decreased network modularity (Liu et al., 2011; Liu et al., 2012; Liu et al., 2013). Furthermore, the brain structural network of individuals with migraine showed a greater path length compared to HC (Liu et al., 2013). This was evidenced by the greater proportion of medium-distance connections and the reduction of modularity, suggesting greater integration of regions involved in pain processing, resulting in abnormal global integration in long-term migraine (Liu et al., 2013; Liu et al., 2015). Another characteristic of migraine suffers is that they are less resilient to attacks targeting the main nodes, with women being the most affected (Liu et al., 2011). It has also been shown that the brain network of women with migraine tends to be more dysfunctional (Liu et al., 2011). Regarding network topology, in the analysis of functional connectivity, individuals with migraine exhibited SW characteristics (Liu et al., 2011), whereas the white matter structural network demonstrated the formation of an irregular network, with high clustering coefficient values and lower SW values (Liu et al., 2013). There was a positive association between migraine duration and SW values and clustering coefficient in the analysis of functional connectivity (Liu et al., 2011). A SW network is able to combine high clustering with a short path length, which gives the network greater efficiency in information transmission-global efficiency (Liu et al., 2011). Based on our findings, we can infer that the brain network of individuals with SCD and chronic pain has the ability to adapt and maintain SW characteristics, similar to what is observed in migraine and osteoarthritis (Liu et al., 2013; Barroso et al., 2021). Thus, it is possible to preserve the overall efficiency of the network in these individuals with chronic pain. However, our results indicate lower SW values in the SCD and chronic pain group compared to HC individuals. The literature suggests that greater SCD severity correlates with increased path length, lower SW values, and consequently, reduced network efficiency (Case et al., 2019), which is consistent with our findings. This pattern does not seem to apply to individuals with long-term migraines, who demonstrate increased SW values compared to HC individuals (Liu et al., 2012; Liu et al., 2013; Liu et al., 2015). This difference may be explained by the presence of a specific brain signature for each chronic pain condition, which may have different underlying mechanisms (Finn et al., 2015; Rosário et al., 2015; Case et al., 2019; Santana et al., 2023; Lopes et al., 2024).
Connectivity and frequency bands
Low frequency thalamocortical oscillations have been identified in individuals with chronic pain during wakefulness and have been associated with dysfunctional brain mechanisms (Llinás et al., 1999; Llinás et al., 2005; Pinheiro et al., 2016; Meneses et al., 2016; Case et al., 2018; Case et al., 2019; Lopes et al., 2024). Our previous research demonstrated that individuals with SCD and chronic pain exhibit higher power spectral density in delta (δ) and theta (θ) frequency bands compared to HC (Lopes et al., 2024). Other chronic pain conditions also demonstrate an increase in low frequency rhythms (Meneses et al., 2016; Rosselló et al., 2015). Individuals with rheumatoid arthritis have increased α power at rest (Meneses et al., 2016). Fibromyalgia patients exhibited a higher overall EEG power in the δ, θ, and β rhythms compared to HC when viewing video clips that provoked different emotions, compared to rest. It is possible that this variation in the frequency bands was related to attention, emotion, arousal, and alertness caused by emotional stimuli (Rosselló et al., 2015). In addition, a systematic review has shown that individuals with chronic pain have increased α peak frequency and θ power at rest (Pinheiro et al., 2016).
Continuous low-frequency oscillations have been associated with dysfunctional inhibitory activity, leading to the recruitment of surrounding regions oscillating at high frequency (γ waves) in a mechanism known as thalamocortical dysrhythmia (Llinás et al., 2005). In this sense, it has been demonstrated that low- and high-frequency oscillations occur simultaneously in several chronic pain conditions (Llinás et al., 2005).
Corroborating this, data from the quantitative EEG evaluation of individuals with SCD identified an increase in θ rhythm (low frequency), and functional connectivity analysis identified changes in network indices in high-frequency rhythms-β1 (Case et al., 2018; Case et al., 2019).
Given the variability in EEG findings in chronic pain, we assessed effective connectivity in individuals with SCD and chronic pain across different rhythms (δ, θ, α, β and γ).
Clustering coefficient (C)
The C values were significantly lower for the SCD group in all neural rhythms during rest and both MI conditions compared to the HC group. This finding is consistent with the work of Case et al (2019), where the authors found lower C values for the β1 rhythm (12–17 Hz) in the context of functional connectivity (based on statistical dependence) for SCD individuals. Our study builds upon an effective connectivity measure (CCM), sensitive to causal relations, and the significant shifts in C-values distribution across all neural oscillations indicate robust neural circuitry modification.
In the intragroup analysis, the SCD group showed the lowest C values during Hand MI, whereas the HC group presented the lowest values at rest in the δ-rhythm. In Barttfeld et al. (2011), the authors correlated lower C-values for the δ rhythm with reduced intra-hub (local) connections during rest. Our findings support this correlation for the HC group and highlight specific alterations in the default mode networks of SCD individuals across different neural rhythms (Mansour et al., 2016; Ferdek et al., 2019). For the γ-rhythm, we obtained opposite results, within the SCD group, C was lowest at rest, whereas within the HC group, C was lowest during Hand MI. When comparing the SCD group experiencing MP to the SCD group experiencing LP, the MP group had the highest clustering levels in all stages for θ, β, and γ rhythms. And the lowest C values for MP occurred in the δ (all stages) and α (imagery) rhythms. The α rhythm is often related to attention and pain anticipation, contributing to the activation of pain and emotion networks (Babiloni et al., 2008; Meneses et al., 2016; Kitaura et al., 2017). This could explain the reduced clustering in the MP group, as increased connectivity in certain regions may reduce the network clustering coefficient. In the β band, the clustering coefficient differentiates the LP and MP groups. LP individuals had the highest C values during rest and the lowest during Hip MI, whereas MP individuals had lower C values at rest and higher during Hand MI. Beta (β) oscillations are associated with cognitive processing, and individuals with SCD have demonstrated cognitive deficits (Case et al., 2018). These results suggest that changes in network parameters, such as a reduction in clustering coefficient and local efficiency, could explain the cognitive deficits observed in this population (Case et al., 2018).
Those findings for clustering coefficient (both inter- and intragroups) support the hypothesis that chronic pain induces a reorganization of local connections within brain networks, producing a pain signature with specific patterns for different neural oscillations (Farmer et al., 2012).
Shortest path length (L)
For the path length variable, we observed higher values in the SCD group, which aligns with previous findings (Case et al., 2019). Evidence shows that the greater the severity of SCD, the longer the path length (Case et al., 2019). Notably, the biggest difference between the SCD and HC groups occurred in the δ rhythm during Hip MI.
Increased path length may be associated with a reduction in connector hubs or interhubs, which are nodes that connect different modules (groups of nodes) and optimize the communication between specialized regions (Bullmore and Sporns, 2012; Barttfeld et al., 2011). Therefore, the increase in path length can promote the isolation of distant nodes and the formation of modules (Barttfeld et al., 2011).
In the intragroup analysis, in the α rhythm, the SCD group had the longest L values during Hand MI, whereas the HC group had the highest values at rest. In the β rhythm, the highest value for the SCD group occurred at rest and the lowest during Hip MI, while the HC group showed the opposite pattern. On the other hand, HC group had the highest L values during Hip MI and the lowest during Hand MI. This suggests that imagining the most familiar movement for each group (hip movement for SCD, hand movement for HC) optimized network use and information flow. These inferences are justified by the fact that the β band is related to cognitive processing (Babiloni et al., 2006).
What differentiates the intragroup behavior of SCD-LP and SCD-MP groups is the γ rhythm. SCD-LP individuals had the highest L values at rest, whereas SCD-MP individuals presented the highest values during Hand MI. In both groups, the lowest values occurred during Hip MI. Being able to identify differences between groups in the γ band is consistent with the literature (Llinás et al., 2005; May et al., 2019). Current evidence suggests that γ waves in the prefrontal cortex serve as biomarkers of chronic pain and are associated with the emotional aspects involved in chronic pain (May et al., 2019).
Small-world (S)
There is evidence that brain activity in HC is organized as a SW, highly efficient network with significant modularity and highly connected central regions (Wang et al., 2010; Vecchio et al., 2018).
Our results demonstrate that the SW parameter was lower in the SCD and chronic pain group, suggesting reduced global network efficiency. Similarly, individuals with TMD and chronic pain also showed lower small world values in the δ, θ, and α bands at rest and in painful and nonpainful MI tasks (Ito et al., 2024).
Previous studies identified a negative correlation between SCD severity and network efficiency, with SCD individuals exhibiting a random network topology at rest (Case et al., 2019). Additionally, Joo et al. (2024) found that SCD individuals with frequent vaso-occlusive crises showed reduced efficiency in their brain networks. These authors suggest that the occurrence of vaso-occlusive crises throughout the life of a person with SCD may lead to cumulative and progressive changes in their brain networks (Joo et al., 2024). These changes contributed to increased explosive synchronization and disassortativity of the network, which makes the brain hypersensitive to painful stimulus. Their computational model showed that if the network reaches a critical hypersensitivity threshold, it may trigger more severe vaso-occlusive crises (Joo et al., 2024).
Another study on individuals with different chronic pain conditions reported reduced overall network efficiency, specifically in the γ band (Ta Dinh et al., 2019). Furthermore, increased functional brain connectivity has been observed in the frontal region, along with signs of global brain network reorganization (Ta Dinh et al., 2019). Gamma (γ) oscillations in the frontal region result from changes in GABAergic synapses and are associated with the motivational, emotional, and evaluative aspects of pain (Ta Dinh et al., 2019).
In the γ and β rhythms, the SCD-MP group had the highest S values in all EEG stages. A study on effective brain connectivity in women with chronic pain associated with endometriosis identified the main connectivity differences in the β band. During rest, there was an increase in effective connectivity, particularly in the left hemisphere (Ferdek et al., 2019). During pain-related imagery, connectivity increased from the left dorsolateral prefrontal cortex to the right temporal cortex (Ferdek et al., 2019). These findings may reflect sustained activity in areas involved in abnormal pain processing or impaired memorization of pain experiences (Ferdek et al., 2019).
What differentiates the intragroup behavior of SCD-MP and SCD-LP individuals are the δ, α, and β rhythms. In the SCD-MP group, regardless of the neural rhythm, the lowest small-word value was observed at rest, whereas the highest was during Hip MI. In contrast, SCD-LP individuals had the lowest value during Hand MI for δ and α rhythms. In the α rhythm, SCD-LP individuals had higher values at rest, and in the β rhythm, the lowest value occurred during Hip MI. Thus, SCD-MP individuals had higher small-word values, similar to the HC group, regardless of the neural rhythm. It is possible that chronic pain promotes adaptations in effective brain connectivity, leading individuals with greater pain intensity to exhibit higher SW parameter values.
Limitations and future prospects
Our study has some limitations that should be considered. We cannot state that our results are due only to chronic hip pain, since we did not have a group with SCD without chronic pain. It was also not possible to obtain information about the clinical history of the volunteers (history of vaso-occlusive crises, neurological imaging exams, among other information), since many of them came from different cities in Bahia to attend consultations with specialists and were invited to participate in the study. Future studies may investigate the effect of noninvasive neuromodulation on brain networks in individuals with SCD and chronic pain to offer a nonpharmacological option that has the potential to modify brain networks and pain.
Conclusion
Individuals with SCD exhibit changes in effective brain connectivity both at rest and during mental tasks. The results support the hypothesis that the chronic pain condition is associated with a decrease in interhub connections.
Footnotes
Authors’ Contributions
J.E.R.S.S., A.F.B., A.F., T.S.L., and J.G.V.M. designed the study; J.E.R.S.S. and T.S.L. contributed to all data collection. M.L.C. and A.F. analyzed the data; all authors collaborated on the interpretation of the results; J.E.R.S.S., A.F.B., A.F., and P.M. wrote the main article text. All authors critically revised the final version of the article.
Data Availability Statement
The data presented in this study are available on request from the corresponding author.
Author Disclosure Statement
The authors declare no competing interests with respect to the research, authorship, and/or publication of this article.
Funding Information
J.E.R.S.S. received a PhD scholarship from the Coordination for the Improvement of Higher Education Personnel—CAPES, Brazil (Finance Code 001). T.S.L received a post-doctoral grant from CAPES (grant # 88887.801519/2023-00). J.G.V.M. (grant # 308758/2021-8) and A.F.B. would like to thank the National Council for Scientific and Technological Development (CNPq) for the research fellowships.
Supplementary Material
Supplementary Table S1
Supplementary Table S2
Supplementary Table S3
Supplementary Table S4
Supplementary Table S5
Supplementary Table S6
Supplementary Table S7
References
Supplementary Material
Please find the following supplemental material available below.
For Open Access articles published under a Creative Commons License, all supplemental material carries the same license as the article it is associated with.
For non-Open Access articles published, all supplemental material carries a non-exclusive license, and permission requests for re-use of supplemental material or any part of supplemental material shall be sent directly to the copyright owner as specified in the copyright notice associated with the article.