
Abstract
Objective:
Repetitive transcranial magnetic stimulation (rTMS) uses electromagnetic fields to induce electrical currents in the superficial cortex, and this electric signal is believed to propagate to functionally connected distal brain regions. We previously reported that rTMS targeting the postcentral gyrus affected resting-state functional connectivity with the posterior insula. The current study investigated whether rTMS targeting the postcentral gyrus would affect task-based functional connectivity (TBFC) with the posterior insula during a cognitive-affective distress task.
Methods:
Twenty-five healthy participants were assigned to 10 Hertz (Hz) (n = 13) or 1 Hz (n = 12) rTMS groups. Participants received five consecutive days of once-daily rTMS and underwent pre- and post-rTMS magnetic resonance imaging (MRI) scans while completing a cognitive-affective distress task with negative auditory feedback. rTMS coil placement over the right postcentral gyrus was guided with neuronavigation, and TBFC analysis of the MRI data was performed using the bilateral auditory cortex as a seed region-of-interest.
Results:
There was an false discovery rate (FDR)-corrected significant group-by-session-by-condition interaction in a right putamen/posterior insula cluster: in the distress condition, the 1 Hz rTMS group had significantly weaker (i.e., smaller absolute value) negative TBFC following rTMS (p = 0.005), while the 10 Hz group had no significant effect.
Conclusion:
This preliminary, proof-of-concept study suggests that rTMS can modulate TBFC in distal brain regions implicated in the neural response to cognitive-affective negative feedback. Future research should investigate whether rTMS can both modulate insula-associated TBFC and improve cognitive-affective task performance or mood outcomes, potentially by increasing the number of rTMS sessions or using different rTMS pulse sequences.
Impact Statement
Clinical application of repetitive transcranial magnetic stimulation (rTMS) may exert a therapeutic effect by modulating the strength of functional connectivity between superficial cortical areas and deeper brain regions. These effects on functional connectivity are typically measured while participants are at rest. This proof-of-concept study suggests that rTMS can have a measurable effect on task-based functional connectivity as well. In the future, this could be an important means of understanding how rTMS exerts effects on cognitive-affective task performance and mood.
Introduction
Transcranial magnetic stimulation is a noninvasive brain stimulation technique that uses electromagnetic fields to induce electrical currents in the brain and evoke action potentials in cortical neurons. Repetitive transcranial magnetic stimulation (rTMS) can modulate cortical excitability and induce long-term changes in synaptic plasticity (Hoogendam et al., 2010). rTMS is approved by the U.S. Food and Drug Administration for the treatment of major depressive disorder, obsessive-compulsive disorder, and smoking cessation, in addition to other psychiatric and neurological indications (Mahoney et al., 2020). The rTMS-induced electromagnetic field directly affects the superficial cortical gyri within about 2.5 cm of the scalp and is thought to indirectly affect brain regions outside the electromagnetic field due to a propagation of the electric signal along anatomically or functionally connected pathways in the brain (Deng et al., 2013; Siebner et al., 2022). Thus, the therapeutic efficacy of rTMS in psychiatric disorders may result from proximal activity in superficial cortical areas that fall within the magnetic field, as well as its effects on large-scale brain networks that are functionally connected to the target site. Indeed, an increasing number of studies have tested the ability of rTMS to indirectly modulate distal brain regions by administering rTMS to a functionally connected superficial cortical target (Beynel et al., 2020). To test these rTMS effects, studies have investigated resting-state functional connectivity (RSFC) using magnetic resonance imaging (MRI), which measures correlations in blood oxygen level-dependent (BOLD) signals across brain regions while at rest.
We were interested in modulating the posterior insula (PI) via its functional connectivity with the postcentral gyrus because our previous study indicated stronger RSFC between the PI and this postcentral gyrus location (on the outer cortical surface) among smokers who remained abstinent during a quit attempt compared with those who relapsed (Addicott et al., 2015). Modulating this connectivity using rTMS could have therapeutic potential for smoking cessation. In a previous study, we reported that administering rTMS to the postcentral gyrus modulated RSFC with the PI, a deep area that is not directly within the stimulating magnetic field (Addicott et al., 2019). We compared 1 Hertz (Hz) to 10 Hz rTMS based on the existing heuristic that low-frequency rTMS (e.g., < 3 Hz) induces inhibitory activity, while high-frequency rTMS (e.g., >3 Hz) induces excitatory activity in the affected cortex (Fitzgerald et al., 2006). This heuristic is based on studies indicating that over the motor cortex, low-frequency rTMS decreases cortical excitability, and high-frequency rTMS increases cortical excitability, measured with motor evoked potentials (Fitzgerald et al., 2006; Pascual-Leone et al., 1994). By extension, it is commonly hypothesized that low- and high-frequency rTMS will have opposing effects on connectivity to distal brain regions (Beynel et al., 2020). However, this heuristic has been criticized, and the distal effects of cortical rTMS may be more nuanced given that studies have found variability in response depending on the brain region, individual subject factors, and underlying neural network integration (Beynel et al., 2020; Hamada and Rothwell, 2016; Kanig et al., 2023).
Research on connectivity-based rTMS has rarely investigated task-based functional connectivity (TBFC). TBFC measures whether functional connectivity between regions is strengthened or weakened during the performance of a task. In this study, we investigated the effects of rTMS on TBFC during the Paced Auditory Serial Addition Test-MRI version (PASAT-M). The original PASAT is a mental math test that was modified to exacerbate cognitive-affective distress (Lejuez et al., 2003). In this modified version, adapted for MRI, players must mentally add consecutive single-digit numbers and indicate the correct sum from an array of options using a response box (Addicott et al., 2018; Addicott et al., 2023; Daughters et al., 2017). Auditory performance feedback differs by condition: in the easy (i.e., control) condition, pleasant, positive feedback is delivered following correct and on-time responses. In the distress (i.e., experimental) condition, negative, aversive feedback is delivered following incorrect or late responses. The distress condition increases negative mood and decreases accuracy (Addicott et al., 2018; Addicott et al., 2023; Daughters et al., 2017). The easy and distress conditions produced unique patterns of TBFC with the auditory cortex (Addicott et al., 2018; Addicott et al., 2023). Compared to the easy condition, the distress condition induces more positive connectivity with frontal, parietal, and anterior insula (AI) regions, known to be involved in executive function and salience detection (Niendam et al., 2012; Seeley et al., 2007), and induces more negative connectivity with sensorimotor and PI regions, known to be involved in sensory awareness and motor planning (Omata et al., 2018).
The PASAT-M connectivity patterns may reveal how different brain regions engage, or disengage, with each other in response to negative feedback and perhaps to regulate negative emotions when they conflict with a cognitive goal (i.e., the mental math task). A better understanding of the bottom-up stress response and the top-down regulation of mood has many applications since low distress tolerance is a common symptom across numerous psychiatric disorders (Leyro et al., 2010). The ability to modulate the brain networks involved in the regulation of negative emotions using rTMS could have significant therapeutic potential. In this proof-of-principle study, we applied rTMS to a postcentral gyrus location in healthy volunteers to investigate whether there would be connectivity changes with the PI. Participants underwent an MRI scan during the PASAT-M, before and after 5 days of rTMS, as part of a larger protocol (Addicott et al., 2018; Addicott et al., 2019). The postcentral gyrus/PI network may play an important role in PASAT-M task performance; the negative connectivity between this network and the auditory cortex suggests that negative feedback inhibits motor planning or motor response and could interfere with response accuracy or response time. Thus, better performance may be associated with weaker negative connectivity with the postcentral gyrus/PI. Based on the high- versus low-frequency heuristic, we hypothesized that 10 Hz would strengthen (i.e., larger absolute value) and 1 Hz would weaken (i.e., smaller absolute value) TBFC with the PI along with accompanying differences in performance.
Methods
Participants
Healthy participants (n = 25), aged 18–55 years, were included if they were right-handed, had no history of serious health or neurological problems, had no current diagnosis of Diagnostic and Statistical Manual of Mental Disorders (DSM-5) psychiatric disorders, did not have any contraindications for rTMS or MRI, had negative urine and breath screens for psychoactive substances and alcohol, and had a negative pregnancy test (females only). To ensure that age and sex differences did not differ across treatment arms, participants were assigned pseudorandomly, balancing for age and sex, to a 1 Hz or a 10 Hz rTMS group.
Procedure
During the screening session, participants completed the Distress Tolerance Scale (Simons and Gaher, 2005), the Beck Anxiety Inventory (Beck et al., 1988), and the Center for Epidemiological Studies Depression Scale (Eaton et al., 2004), and practice versions of the PASAT-M easy and distress conditions. Participants completed a pre-rTMS MRI scan, followed by five consecutive days of once-daily rTMS, and then completed a post-rTMS MRI scan between 1 and 24 h after the last rTMS visit. Due to MRI scheduling limitations on Fridays, some participants received four days of rTMS (n = 3 in the 10 Hz group, n = 6 in the 1 Hz group). During the MRI scan, participants completed the PASAT-M easy and distress conditions along with the mood ratings. During rTMS, participants completed a 10-min version of the PASAT (see PASAT-M description below). These procedures were part of a larger study protocol on distress tolerance that has been described previously (Addicott et al., 2018; Addicott et al., 2019).
Repetitive transcranial magnetic stimulation
rTMS was administered using a Magstim Rapid2 device (Magstim Company Ltd., Morrisville, NC) with an air-cooled figure-8 coil. Resting motor threshold (MT) was determined using electromyography on the left dorsal interosseous muscle and the Adaptive Parameter Estimation by Sequential Testing procedure (Borckardt et al., 2006).
The rTMS target site was predetermined for each participant by transforming the location of the postcentral gyrus cluster functionally connected to the PI (Addicott et al., 2015) into individual anatomical space, then drawing an 8 mm2 region of interest (ROI) over the location (approximate Montreal Neurological Institute (MNI) coordinates: 64, −5, 28). rTMS coil placement was guided with a neuronavigation system (Brainsight; Rogue Instruments, Montreal, Canada). Participants received either 1 Hz (100% MT, 960 pulses) or 10 Hz rTMS (100% MT, 5-sec trains, 20-sec inter-train interval, 2000 pulses total). The 1 Hz and 10 Hz rTMS sequences were matched for duration, each lasting for 16 min. During rTMS administration, participants practiced the PASAT-M math test for 10 min and then rested for the remainder of the session.
Paced auditory serial addition test functional magnetic resonance imaging (fMRI) version
Participants completed a modified version of the PASAT-M (Addicott et al., 2018). A series of single-digit numbers appeared onscreen one at a time, and players had to mentally add the current number to the previous number and indicate the sum using a response box. Four response options were displayed along the bottom of the screen. Numbers appeared onscreen for 3 sec. During the easy condition, two response options were displayed onscreen along with two null options (represented by “0”). Correct and on-time responses (made within 2 sec) were followed by a 750-millisecond bell sound. Missed responses resulted in a “Respond Faster!” message displayed for 1 sec, and incorrect responses received no feedback.
During the distress condition, four response options were displayed along the bottom of the screen. Correct and on-time responses received no feedback. Incorrect, late responses were followed by a 750-millisecond buzzer sound. Participants had to respond 75% faster than their average response time during the easy condition, which was completed just prior to the distress condition. This resulted in a measure of actual accuracy, representing the percentage of trials in which the correct sum was selected within 2 sec, and forced-fail accuracy, representing the percentage of trials in which participants responded <75% faster than their easy condition average and the buzzer was not heard. Missed responses resulted in a “Respond Faster!” message displayed for 1 sec. Each condition consisted of six 60-sec task blocks, alternating with 30-sec rest blocks. The easy condition was always presented before the distress condition to avoid carry-over effects of stress and negative affect.
Participants earned points for each correct, on-time response during the easy condition and lost points for every incorrect, late response during the distress condition. Points went toward a $2.50 bonus.
During the PASAT-M, self-report scales were presented before the easy condition (time 1), in between the easy and distress condition (time 2), and after the distress condition (time 3). Participants rated the extent they were experiencing each emotion on a scale from one (not at all) to four (extremely). Emotions were irritable, bored, frustrated, happy, angry, stressed, excited, and motivated to perform well. A negative mood composite score was calculated by averaging the ratings for irritable, frustrated, angry, and stressed at each time point.
During rTMS, participants completed a 10-min version of the PASAT in which two options (and two null options) were shown onscreen. A buzzer sound followed missed responses or responses with latencies greater than 2 sec. This version was intended to engage cognitive control (Sack et al., 2024) and deter noncompliance while minimizing cognitive exertion and distress.
Magnetic resonance imaging
MRIs were acquired on a 3T General Electric MR750 scanner (Milwaukee, WI) equipped with 50 mT/m gradients. During the MRI, participants completed a high-resolution anatomical scan (3D-SPGR, TR = 8.156 ms, TE = 3.18 ms, FOV = 25.6 cm2, matrix = 256 × 256, flip angle = 120, 166 slices, slice thickness = 1 mm) and the PASAT-M during functional scans (SENSE spiral, TR = 2 sec, TI = 0, TE = 32 ms, flip angle = 770, matrix = 64 × 128, FOV = 25.6 cm2, slices = 34, slice thickness = 4 mm resulting in 4 × 4 × 4 mm voxels, 2 runs of 285 volumes each).
Functional images were preprocessed using SPM12 (Wellcome Dept. of Imaging Neuroscience). Images were spatially realigned to the first volume, slice-time corrected, co-registered to the T1 anatomical image, resliced to 2 mm voxels, and normalized to the MNI template. Anatomical images were segmented into gray matter, white matter, and cerebrospinal fluid (CSF) tissues. Functional data was smoothed with an 8 mm full width at half maximum (FWHM) Gaussian kernel. Functional data were denoised and analyzed using CONN v22.a (Nieto-Castanon, 2020; Whitfield-Gabrieli and Nieto-Castanon, 2012), including the regression of 5 CompCor white matter noise components, 5 CSF noise components, motion parameters and their first-order derivatives, session and task effects and their first-order derivatives, and linear trends within each functional run, followed by bandpass frequency filtering of the BOLD timeseries between 0.008 Hz and 0.09 Hz. TBFC of the changes across the easy and distress conditions of the PASAT-M was analyzed using a generalized psychophysiological interaction (gPPI). The seed ROI was the bilateral planum temporale and Heschl’s gyri (the auditory cortices), defined by the Harvard-Oxford Cortical Atlas, to measure connectivity relevant to the auditory feedback. Functional connectivity changes between the seed ROI and all other voxels in the brain across conditions were characterized by the multivariate regression coefficient of the gPPI term in each model.
The denoising and gPPI analyses, described here, are identical to the methods used previously (Addicott et al., 2018), except instead of the left planum temporale seed ROI used in the prior analysis, we used a bilateral auditory cortex seed ROI in this analysis similar to (Addicott et al., 2023).
Data analysis
Demographic data were analyzed with independent-samples t-tests and chi-square tests. Mood ratings were analyzed with a 3 Timepoint (before, during, and after PASAT-M) by 2 Session (pre-rTMS vs. post-rTMS) by 2 Group (10 Hz vs. 1 Hz) repeated-measures analysis of variance (rmANOVA). Actual accuracy (i.e., percent correct) and response time were analyzed with 2 Session by 2 Condition (easy vs. distress) by 2 Group rmANOVAs, and forced-fail accuracy in the distress condition was analyzed with 2 Session by 2 Group rmANOVA. Data were analyzed using SPSS v29 (IBM Corp.). Whole-brain, TBFC analyses were performed using general linear models with F-tests or two-sided t-tests. Results were thresholded at voxel-level uncorrected p < 0.001 and cluster-size false discovery rate (FDR)-corrected p < 0.05. Given the small sample size and the exploratory nature of this preliminary study, nonsignificant trends are also reported at voxel-level uncorrected p < 0.001 and cluster-size uncorrected p < 0.05.
Results
Participant characteristics and PASAT-M performance
Twenty-five participants (n = 18 female) completed the study and were assigned to 10 Hz (n = 13) or 1 Hz (n = 12) rTMS. See Table 1 for details about participant characteristics and PASAT-M performance. There were no significant differences between groups in sex, age, education, racial distribution, or the number of rTMS sessions (p’s >0.05). Groups did not differ on distress tolerance, anxiety, or depression scores. PASAT-M negative mood scores increased across the easy and distress conditions (Time effect: F[2,22] = 16.5, p < 0.001; partial ƞ2 = 0.60), and increased more in the pre-rTMS session than in the post-rTMS session (Session effect: F[1,23] = 4.6, p = 0.042; partial ƞ2 = 0.17). Negative mood also increased more among the 1 Hz group than the 10 Hz group (Time by Group interaction: F[2,22] = 5.5, p = 0.012; partial ƞ2 = 0.33). There were no other significant effects.
Participant Characteristics and PASAT-M Performance Measures, Means (Standard Deviations). Significance Tests Included Independent-Samples t-Tests, Chi-Squared Tests, and Repeated-Measures ANOVAs
Percent correct accuracy when forced-fail trials are counted as incorrect responses. On these correct trials, no auditory stimulus was delivered.
Actual accuracy decreased from the easy to the distress condition (Condition effect: F[1,23] = 15.6, p < 0.001; partial ƞ2 = 0.41). From the pre-rTMS to the post-rTMS session, actual accuracy increased in the easy condition and decreased in the distress condition (Session by Condition interaction: F[1,23] = 6.5, p = 0.018; partial ƞ2 = 0.22). There were no other significant effects. Forced-fail accuracy in the distress condition had no significant Group, Session, or Interaction effects. Response time decreased from the pre-rTMS to the post-rTMS session (Session effect: (F[1,23] = 47.1, p < 0.001; partial ƞ2 = 0.67) and decreased from the easy condition to the distress condition (Condition effect: F[1,23] = 10.9, p = 0.003; partial ƞ2 = 0.32). There were no other significant effects.
TBFC condition effect
Averaged across sessions, the distress > easy contrast revealed TBFC differences in the bilateral AI, inferior and middle frontal gyri, anterior paracingulate gyrus, superior parietal lobules, and supramarginal gyri (FDR-corrected p values <0.001). The easy > distress contrast revealed differences in the bilateral PI, pre- and post-central gyri, supplementary motor cortex, posterior cingulate gyrus, frontal medial cortex, putamen, accumbens, hippocampus, and amygdala (FDR-corrected p values <0.001). See Table 2 and Figure 1.
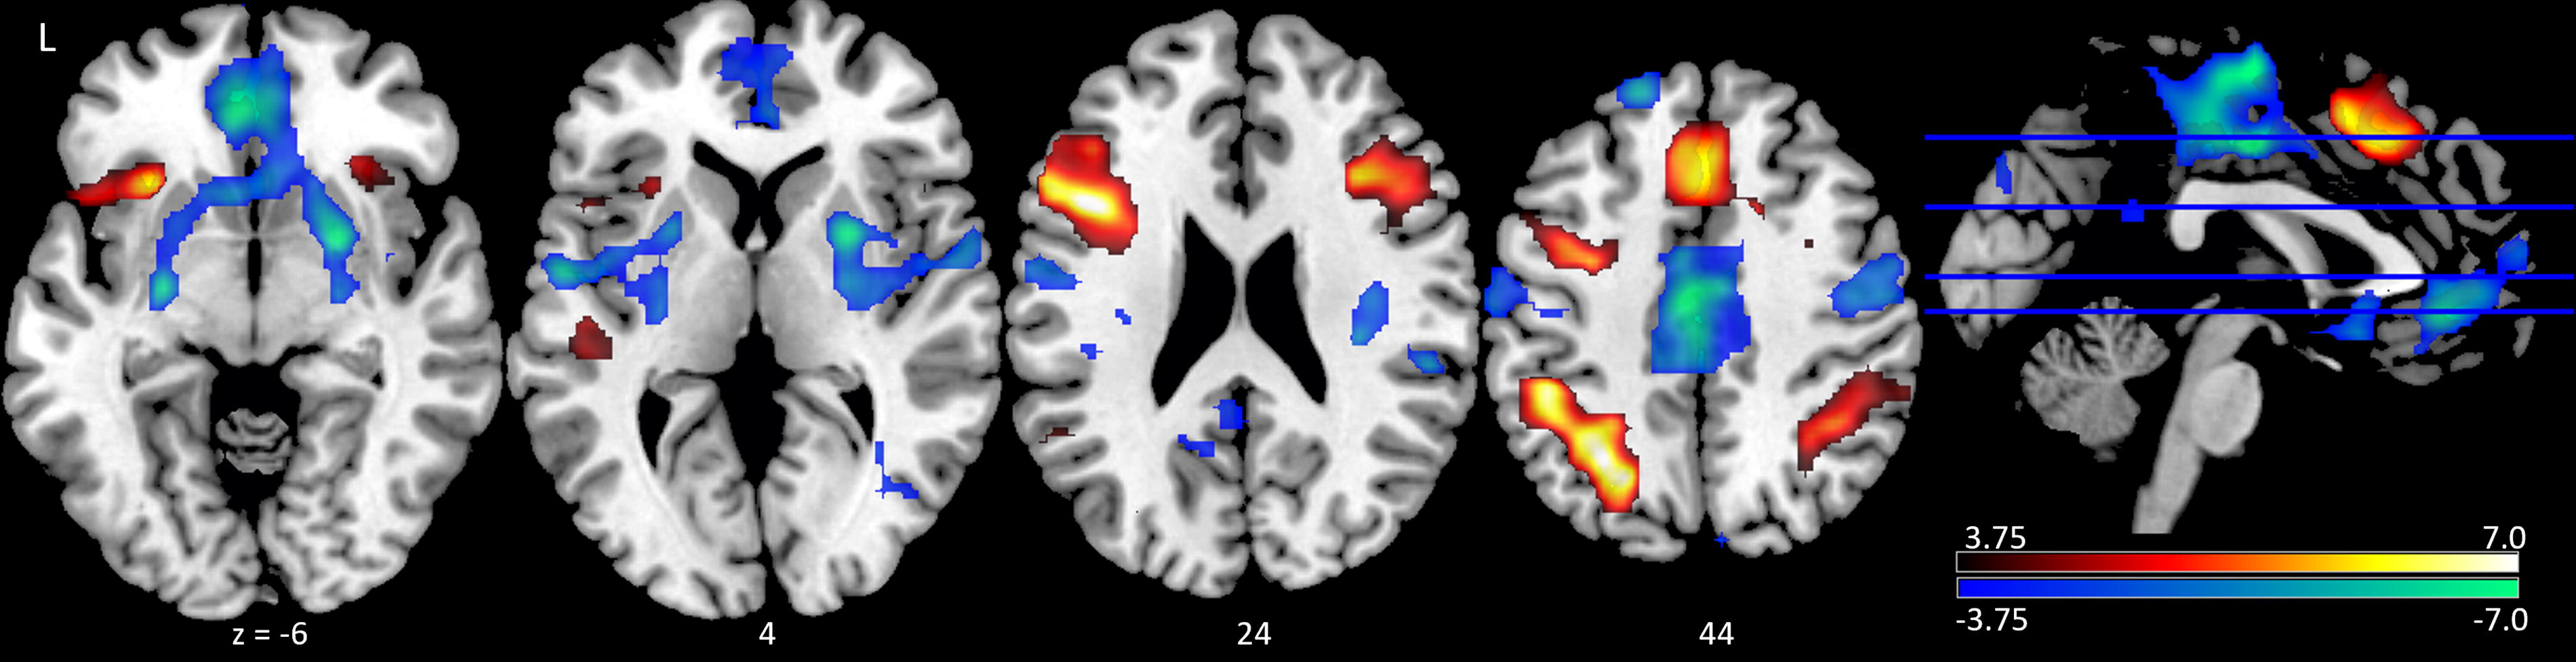
Task-based functional connectivity of the PASAT-M between the bilateral auditory cortex seed region of interest and all other voxels in the brain. Shown is the contrast between the distress > easy condition (red), and the easy > distress condition (blue), averaged across sessions. Statistical map is thresholded at voxel-level uncorrected p < 0.001 and cluster-size FDR-corrected p < 0.05. Color bar represents T-values. PASAT-M, Paced Auditory Serial Addition Test—MRI version.
Task-Based Functional Connectivity between the Bilateral Auditory Cortex Seed Region of Interest and All Other Voxels in the Brain during the MRI Paced Auditory Serial Addition Task (PASAT-M). Significance Threshold Voxel-Level Uncorrected p < 0.001 and Cluster-Size FDR-Corrected p < 0.05 or Non-Significant Trend-Level Cluster-Size Uncorrected p < 0.05 (2 mm2)
TBFC session effect
No clusters survived FDR-cluster correction. There was a nonsignificant trend across sessions: averaged across conditions, the post-rTMS session > pre-rTMS session contrast revealed TBFC differences in the left central operculum, which had stronger negative connectivity in the pre-rTMS session than in the post-rTMS session (voxel-level uncorrected p < 0.00006, cluster-size uncorrected p = 0.043). See Table 2.
TBFC group effect
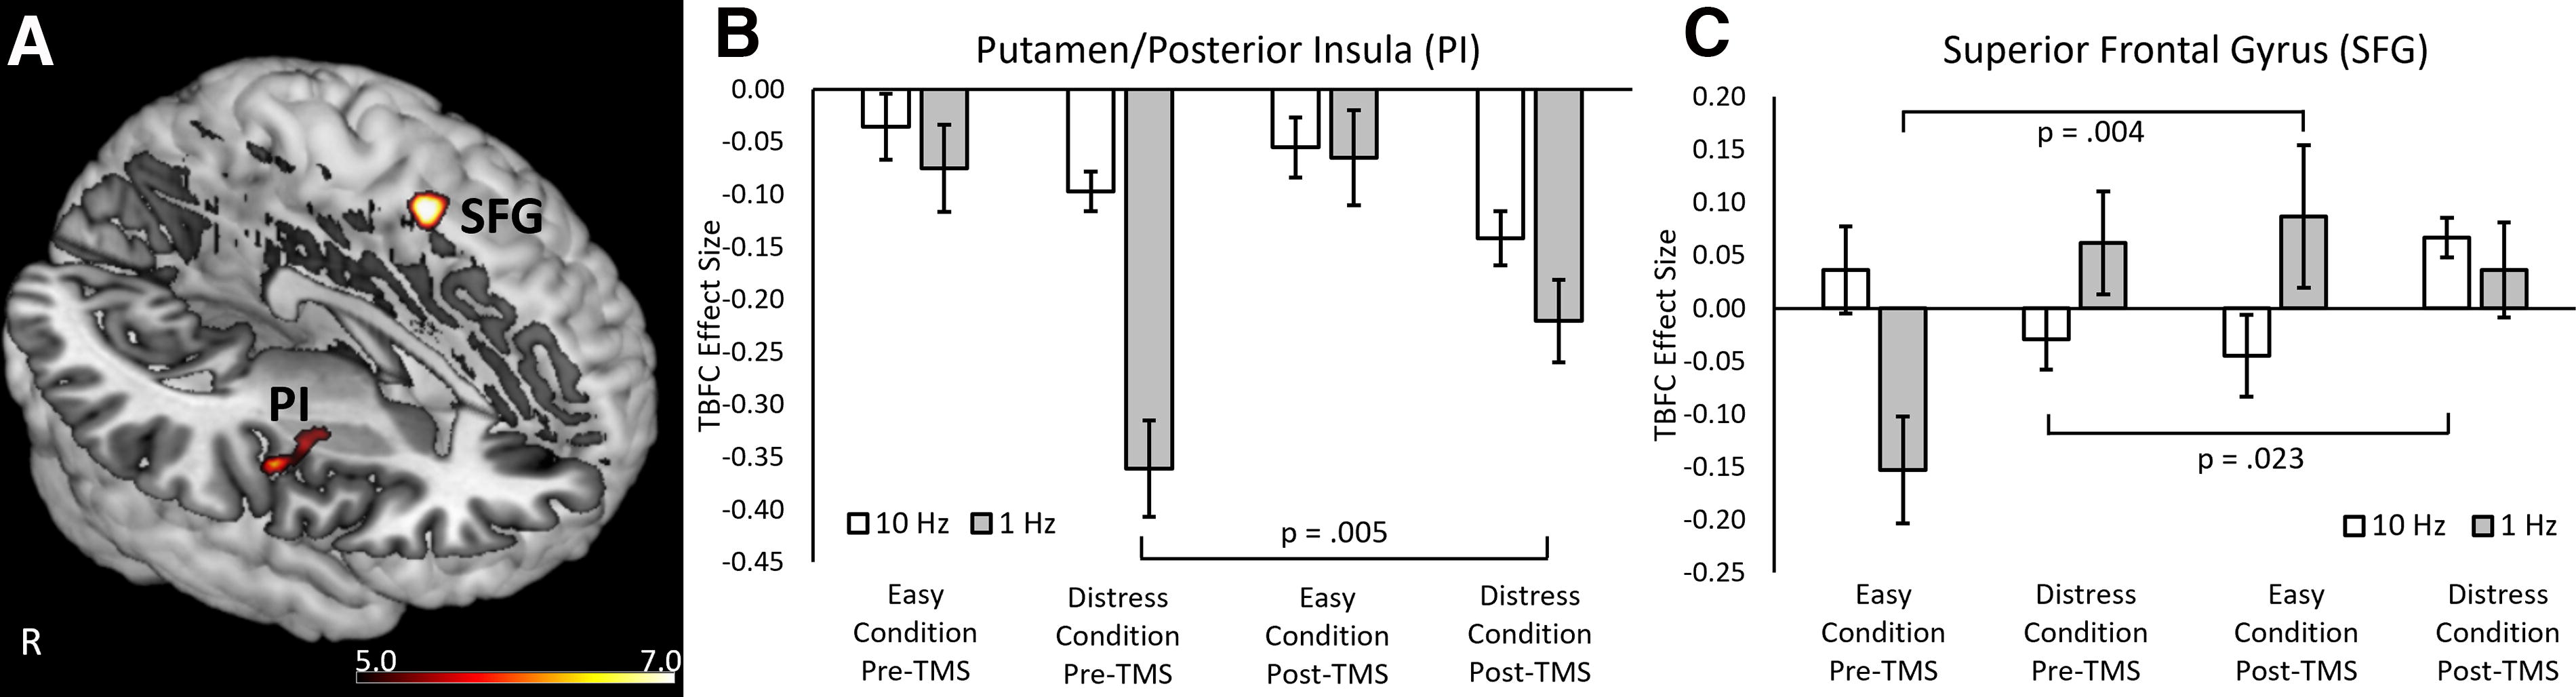
A group difference contrast was applied to an F-test of Condition and Session TBFC effects. This revealed TBFC differences in two clusters, a significant cluster in the right putamen/PI (FDR-corrected p = 0.025) and a nonsignificant trend in the left superior frontal gyrus (SFG) (voxel-level uncorrected p < 0.00002, cluster-size uncorrected p = 0.024). See Table 2 and Figure 2. The extracted cluster values revealed Group by Session by Condition interaction for the putamen/PI cluster (F[1,23] = 8.6, p = 0.007; partial ƞ2 = 0.273) and the SFG cluster (F[1,23] = 30.9, p < 0.001; partial ƞ2 = 0.573) (if the number of TMS sessions is included as a covariate of no interest, these three-way interactions remain significant: putamen/PI cluster (F[1,22] = 7.3, p = 0.013; SFG cluster (F[1,22] = 25.9, p < 0.001). In addition, the 1 Hz group had stronger negative TBFC than the 10 Hz group in the putamen/PI (group effect: F[1,23] = 6.0, p = 0.022; partial ƞ2 = 0.208). There was no significant Group effect for the SFG.
Group effect of the task-based functional connectivity (TBFC) analysis of the PASAT-M.
To investigate these three-way interaction effects, Session effects were tested within each Condition, within each Group, using two-sided paired-samples t-tests. In the putamen/PI, the 1 Hz group TBFC in the distress condition became weaker from the pre-rTMS to the post-rTMS session (t[11] = 3.4, p = 0.005).
In the exploratory SFG cluster, the 1 Hz group had negative, easy-condition TBFC in the pre-rTMS session and positive, easy-condition TBFC in the post-rTMS session (t[11] = 3.6, p = 0.004), and the 10 Hz group had negative, distress-condition TBFC in the pre-rTMS session and positive, distress-condition TBFC in the post-rTMS session (t[12] = 2.6, p = 0.023).
Discussion
This study investigated the effects of daily sessions of 1 Hz or 10 Hz rTMS to the right postcentral gyrus on performance and TBFC during the PASAT-M. Negative mood increased, and actual accuracy decreased, from the easy to the distress condition. However, there were no group interaction effects on response time or actual accuracy. Consistent with previously published data (Addicott et al., 2018; Addicott et al., 2023), the distress condition elicited stronger negative TBFC connectivity with sensorimotor regions (pre- and post-central gyri, central opercular cortex, PI, and putamen) and stronger positive TBFC connectivity with executive function regions (bilateral AI, middle and inferior frontal gyri, SFG, and paracingulate), compared to the easy condition. There was a group by session by condition interaction in the right putamen/PI that survived the FDR-corrected cluster threshold. This effect is particularly relevant since the right PI was the intended, distal target of the rTMS administration. In addition, the distress condition would be the ideal condition for a therapeutic intervention if there were evidence linking PI function with real-world distress tolerance outcomes. In the distress condition, the 1 Hz group had significantly weaker (i.e., smaller absolute value) negative TBFC following rTMS, while the 10 Hz group had nonsignificantly stronger (i.e., larger absolute value) negative TBFC. These preliminary outcomes partially support our hypothesis and suggest that rTMS can be used to modulate TBFC during the PASAT-M.
The right putamen/PI cluster location overlapped with the TBFC pattern in the easy>distress contrast, which strongly suggests this cluster is relevant to neural mechanisms underlying PASAT-M. The postcentral gyrus rTMS target was chosen because our previous study indicated stronger RSFC between the PI and this postcentral gyrus location (on the outer cortical surface) among smokers who remained abstinent during a quit attempt compared to those who relapsed (Addicott et al., 2015). While the current study was conducted in healthy participants, an ongoing set of clinical studies in patients with posttraumatic stress disorder and tobacco use disorder undergoing a cessation attempt have administered 1 Hz repetitive rTMS and, in a subsequent randomized controlled trial, intermittent theta burst stimulation to the postcentral gyrus (Young et al., 2024). The purpose of applying rTMS to the postcentral gyrus is to modulate the distal connectivity with the PI. The insula is known to play an important role in maintaining smoking behavior (Naqvi et al., 2014), perhaps because it connects interoceptive awareness of withdrawal symptoms and craving with goal-directed behavior (Garavan, 2010). Furthermore, the putamen/PI are sensorimotor regions involved in motor planning (Omata et al., 2018). Hypothetically, modulating the insula-based network may weaken the connection between the interoceptive awareness of craving and the motor response of cigarette smoking and/or strengthen the connection with goal-directed control of smoking behavior. In the context of the PASAT-M, whether it is therapeutically desirable to strengthen or weaken connectivity with the putamen/PI remains uncertain, since the lack of effects on performance and negative mood makes the modulation of the TBFC difficult to interpret.
The postcentral gyrus is functionally connected to the PI during the resting state (Addicott et al., 2018). Based on the inhibitory/excitatory rTMS heuristic, we had hypothesized that 10 Hz would strengthen and 1 Hz would weaken RSFC between the postcentral gyrus and the PI. Unexpectedly, both 10 Hz and 1 Hz strengthened RSFC (Addicott et al., 2018). A review of effects of rTMS on resting-state network-level effects reveals mixed effects on distal connectivity (Beynel et al., 2020). Most studies using hypothetically inhibitory rTMS stimulation protocols reported strengthened RSFC to the distal target. In addition, many studies report rTMS-induced changes outside the stimulated functional network (Beynel et al., 2020). Despite no differences in RSFC, our TBFC analysis indicated that the 1 Hz rTMS protocol significantly weakened negative connectivity, while the 10 Hz protocol non-significantly strengthened negative connectivity. However, these effects could have been partially driven by group differences in session 1, which existed prior to rTMS stimulation. Despite pseudorandom group assignment and no group differences in baseline characteristics or PASAT-M performance, the 1 Hz group had stronger negative TBFC at baseline than the 10 Hz group. This suggests that the effects of rTMS are dependent on baseline functional connectivity. It is also possible that the effects were due to session effects, PASAT practice during the rTMS administration, or a regression toward the mean (e.g., the TBFC Session effect in the left central operculum). As we noted previously, it is a limitation of this type of research to not include a sham control condition, as there remain significant gaps in knowledge regarding how changes in rTMS-induced cortical excitability or regional BOLD activity affect connectivity in distal brain regions (Addicott et al., 2018). Future research with larger samples and adequate control conditions is necessary to confirm these results.
The nonsignificant trend in the SFG revealed the 10 Hz group changed from pre-rTMS negative TBFC to post-rTMS positive TBFC in the distress condition. Consistent with our other study, the SFG is part of a bilateral prefrontal cortical area that, on average, has negative TBFC in the easy condition and positive TBFC in the distress condition. This suggests that the negative auditory feedback in the distress condition engages the executive control network, which may have evaluated whether the recent performance was accurate or not (Addicott et al., 2023). The strengthened positive connectivity in the 10 Hz group in the SFG is interesting and could be a desirable effect, but replication with a larger sample and its relation to mood and performance are needed to interpret this exploratory outcome.
In summary, this preliminary proof-of-concept study offers evidence that rTMS can modulate TBFC in brain regions distal to the rTMS target site. Other studies using the PASAT-M have shown that individuals with tobacco use disorder have worse performance and increased negative mood compared to healthy controls (Addicott et al., 2023), suggesting rTMS may have a larger effect in clinical populations than in healthy participants, such as the sample included here. Individuals with psychiatric disorders characterized by increased distress may experience more distress and worse performance in response to the negative auditory feedback or have a worse ability to control the distress during the PASAT-M. If so, this research may have important implications for the therapeutic neuromodulation of distress among individuals with psychiatric disorders. Participants practiced a version of the PASAT during rTMS administration, based on the belief that rTMS effects are dependent on the brain state (Sack et al., 2024). The induction of a positive emotional state in addition to a cognitive control state during rTMS may also assist the modulation of distress. Future research should investigate whether rTMS can also improve PASAT-M performance or mood outcomes, potentially by increasing the number of rTMS sessions or using different rTMS pulse sequences.
Footnotes
Authors’ Contributions
M.A.A.: Responsible for the study concept and design, performed the analysis, and drafted the article. J.R.Y. and L.G.A.: Provided critical revision of the article for important intellectual content. All authors critically reviewed the content and approved the final version for publication.
Author Disclosure Statement
No competing financial interests exist.
Funding Information
This study was funded by Duke University Psychiatry Department pilot funding, Duke Institute for Brain Sciences Incubator Award, NIH NIDA K01 DA033347 (PI: Addicott) and the Office of the Director, NIH under Award Number S10 OD 021480. J. Young is supported by Department of Veterans Affairs (VA) Clinical Science Research and Development Service (CSR&D) Career Development Award (CDA-2: 1IK2CX002610-01); VA Mid-Atlantic Mental Illness Research, Education, and Clinical Center (MIRECC), Durham VA Health Care System; Duke University Department of Psychiatry & Behavioral Sciences; and Duke Bass Connections.