
Abstract
Understanding the fate and transport of biological agents into buildings will be critical to recovery and restoration efforts after a biological attack in an urban area. As part of the Interagency Biological Restoration Demonstration (IBRD), experiments were conducted in Fairfax County, VA, to study whether a biological agent can be expected to infiltrate into buildings following a wide-area release. Bacillus thuringiensis var. kurstaki is a common organic pesticide that has been sprayed in Fairfax County for a number of years to control the gypsy moth. Because the bacterium shares many physical and biological properties with Bacillus anthracis, the results from these studies can be extrapolated to a bioterrorist release. In 2009, samples were collected from inside buildings located immediately adjacent to a spray block. A combined probabilistic and targeted sampling strategy and modeling were conducted to provide insight into likely methods of infiltration. Both the simulations and the experimental results indicate sampling entryways and heating, ventilation, and air conditioning (HVAC) filters are reasonable methods for “ruling in” a building as contaminated. Following a biological attack, this method is likely to provide significant savings in time and labor compared to more rigorous, statistically based characterization. However, this method should never be used to “rule out,” or clear, a building.
As part of the Interagency Biological Restoration Demonstration (IBRD), experiments were conducted in Fairfax County, VA, to study whether a biological agent can be expected to infiltrate into buildings following a wide-area release. The results indicate sampling entryways and heating, ventilation, and air conditioning (HVAC) filters are reasonable methods for “ruling in” a building as contaminated.
Outdoor pesticide releases of Bacillus thuringiensis var. kurstaki (Btk) in an area, such as Fairfax County, VA, provide a rare opportunity to study the release of viable, aerosolized Bacillus in an urban setting. While the application of Btk does not resemble a typical state-sponsored release scenario involving a dry, weaponized powder, analysts have noted it is a “technically feasible” and effective (though simplistic) means of producing inhalational exposures. 10 In addition, Greenberg et al. recently concluded that Btk is the most appropriate simulant for studying the environmental fate and transport of B. anthracis since the 2 agents exhibit many similarities in genetics and morphology. 11 Outdoor pesticide releases of Btk can therefore provide insights on infiltration into buildings following a deliberate—albeit crude—terrorist release.
Modeling studies have been done to simulate infiltration of particles 12 and to simulate the behavior of an agent or particle once it is inside a building. 13 Sextro et al. noted the importance of airflow as a means of transporting aerosols throughout a building, and they suggested that tracking (transport driven by the movement of individuals) has a more modest effect. The authors also noted that although advection and deposition are well understood, tracking and resuspension are not, suggesting that activity-related resuspension is an important potential source of human exposure. 13
Teschke et al. tracked the aerosol concentration indoors and outdoors following an outdoor airborne release of Btk. 14 At 5 to 6 hours after spraying, indoor concentrations exceeded those outdoors, with an average of 244 CFU/m3 versus 77 CFU/m3 outdoors. The authors suggest that the initial benefits of remaining indoors (or “sheltering-in-place”) during spraying may not persist, as outside air moves indoors with normal daily activities. There are commensurate benefits of being outside once the plume has passed and dilution of the agent has occurred. Additional experimental work has also demonstrated transport into a building after an outdoor Btk release. 15
As there is ample evidence in the literature that an outdoor release will migrate into buildings and deposit contamination, potentially at levels significant to public health, it will be critical to be able to rapidly restore buildings following a biological release. However, implementing the base remediation strategy Wein et al. evaluated—restoring all buildings within the potentially contaminated area—is not feasible. 1 Statistically based sampling of all potentially affected buildings could provide a method to rule out clean buildings, but it would be prohibitively time consuming and expensive because of the number of samples required to characterize tens to thousands of buildings.
This study, under the purview of the Interagency Biological Restoration Demonstration (IBRD), was initiated to determine whether there was a rapid way to identify, or “rule in,” a contaminated building and expedite it to restoration, without subjecting it to statistically based sampling. This would allow a triage approach to be implemented, wherein some buildings could be ruled in without extensive sampling, thereby freeing up resources for buildings that require more extensive characterization.
To accomplish this objective, experimental sampling was combined with indoor transport and dispersion modeling and simulation to provide insights into the primary mechanism of building infiltration and associated high probability areas for agent deposition. Based on the results of both the modeling and the experiment, a methodology was developed to allow one to rapidly rule in a building as contaminated based on sampling the most likely routes for agent infiltration.
The authors caution that this method should never be used to “rule out,” or clear, a building. Clearance requires a more stringent approach, in which local public health authorities must determine their tolerance for potential residual contamination. Once this has been established, statistical sampling is the only currently accepted method for determining whether a building is ready for reoccupancy.
Methods
Btk Application
Fairfax County, VA, delivered 1 application of a 3.3% volume:volume suspension of Btk (Foray 76B; Valent Biosciences, Libertyville, IL) in water via helicopter at a rate of 1.9 liters per acre. The helicopter flew roughly 16 m above the tree canopy. A Micronair AU 5000 rotary atomizer, calibrated prior to spraying, was used to produce a distribution of droplets with a median volume diameter of 200 μm and a median number diameter of 125 μm at the tree canopy. Spraying was conducted in the early morning under conditions of low wind and high humidity to minimize evaporation and drift. The particle size distribution was not characterized during the calibration; however, the Micronair AU 5000 delivers a lognormal distribution of particle sizes.
The insecticide Foray 76B contains spores of Bacillus thuringiensis subsp. kurstaki strain ABTS-351 with fermentation solids and solubles as its active ingredient (18%). A sample of the spray suspension was obtained from Fairfax County for laboratory analysis. The concentration of Btk was found to be 3.6×10⁹ spores/mL (±5.6×10⁸) with heat treatment and 5.5×10⁹ spores/mL (±4.5×10⁸) without, indicating the majority of the Btk in the suspension was sporulated rather than vegetative. Assuming the density of spores is approximately 1×10¹¹ spores/gram, the Btk was applied at approximately 20 to 60 grams per acre. 16
Sample Collection
In general, sampling was focused on potential aerosol entry points into the building, such as HVAC systems, doorways, windows, and loading docks. Samples were collected over large areas (approximately 10 m2 per sample) to maximize the probability of obtaining detectable amounts. For the same reason, most samples were collected using vacuum socks, which allow a large area to be sampled using 1 sock. The entire entryway and lobby area of each building was sampled with vacuum socks. Targeted swipe samples were collected from windowsills and HVAC vents; 3M Trace Evidence Collection Filter samples were collected from HVAC filters. Sample collection was performed using the protocols contained in the BioWatch Outdoor Program Guidance Document for BioWatch Jurisdictions when applicable. 17 The procedures reflect, whenever possible, the Centers for Disease Control and Prevention (CDC) guidance on collection of nonhazardous environmental samples. Indoor sample data were tracked and visualized using the Sandia National Laboratories' Building Restoration Operations Optimization Model (BROOM).
To briefly summarize sample collection, swipe samples were collected using sterile gauze premoistened with phosphate buffered saline and 0.03% Tween (PBST). An area of approximately 1 square meter was wiped using vertical then horizontal S-strokes. HVAC filter samples were collected from Air Handling Units (AHU) using the 3M Trace Evidence Collection Filter (3M) inserted into a HEPA Dirt Devil Classic handheld vacuum cleaner. Team members collected less than 2 tablespoons of vacuumed debris over a 1 m2 surface, making 2 passes of the entire sampling area using vertical then horizontal S-strokes. Outside-air side and inside-air side samples were taken from the same AHU but from a separate filter or separate section of filter.
Vacuum sock samples were collected from building floors using vacuum socks inserted into a HEPA Dirt Devil Classic handheld vacuum cleaner. One to 2 tablespoons of vacuumed debris was collected over a 7 to 15 m2 surface, making 2 passes of the entire sampling area using vertical then horizontal S-strokes.
All samples were collected by personnel wearing clean, disposable nitrile gloves and booties. Gloves were changed after collection of each sample. Sample data were recorded on log sheets and in an electronic database.
The collection efficiencies of the sampling media were not characterized, as wide variations in collection efficiencies are reported in the literature (between 5% and 89%) depending on the study parameters (eg, the surface sampled, the individual collecting the sample, and the amount of material present on the surface), and these variables could not be characterized in the field environment.18,19 Instead, standardized protocols were applied, and it was presumed that collection efficiencies were less than 100%, with sample processing further reducing the overall process efficiency.
Viability Analysis
Samples were received, washed, and analyzed as previously described in Van Cuyk et al. 15 The entire swipe sample, one-quarter of a Trace Evidence filter, and entire vacuum sock samples were washed in 10 mL PBST, centrifuged, 6.5 mL of buffer was removed, leaving 3.5 mL remaining, from which a 100 μL portion of the wash was plated on selective media and incubated overnight. Btk growth was confirmed using PCR. In studies conducted using samples spiked with known concentrations of Btk, it was determined that 100 CFU of Btk spiked onto samples prior to washing was the lowest concentration that could be detected.
Field blanks (5% of the total samples) consisted of each type of sample media and were processed as described above. Viable Btk was not found in any field blank. Due to limited access to buildings, background samples could not be collected. It was instead assumed that all Btk originated outside the buildings, rather than inside, and was therefore present in the buildings due to infiltration, with the dominant source being the kg quantities of agent released in the adjacent spray blocks.
Buildings Sampled
Since the purpose of this experiment was to develop a method to rapidly identify contaminated buildings, all buildings sampled were in close proximity to spray blocks and therefore likely to be contaminated by the Btk release. All buildings sampled were occupied office buildings. Six buildings were sampled in Reston, VA, in very close proximity to Fairfax County spray blocks 15 and 16. Spray block 15 comprised 74 acres; spray block 16 comprised 40 acres (Figure 1, Table 1).
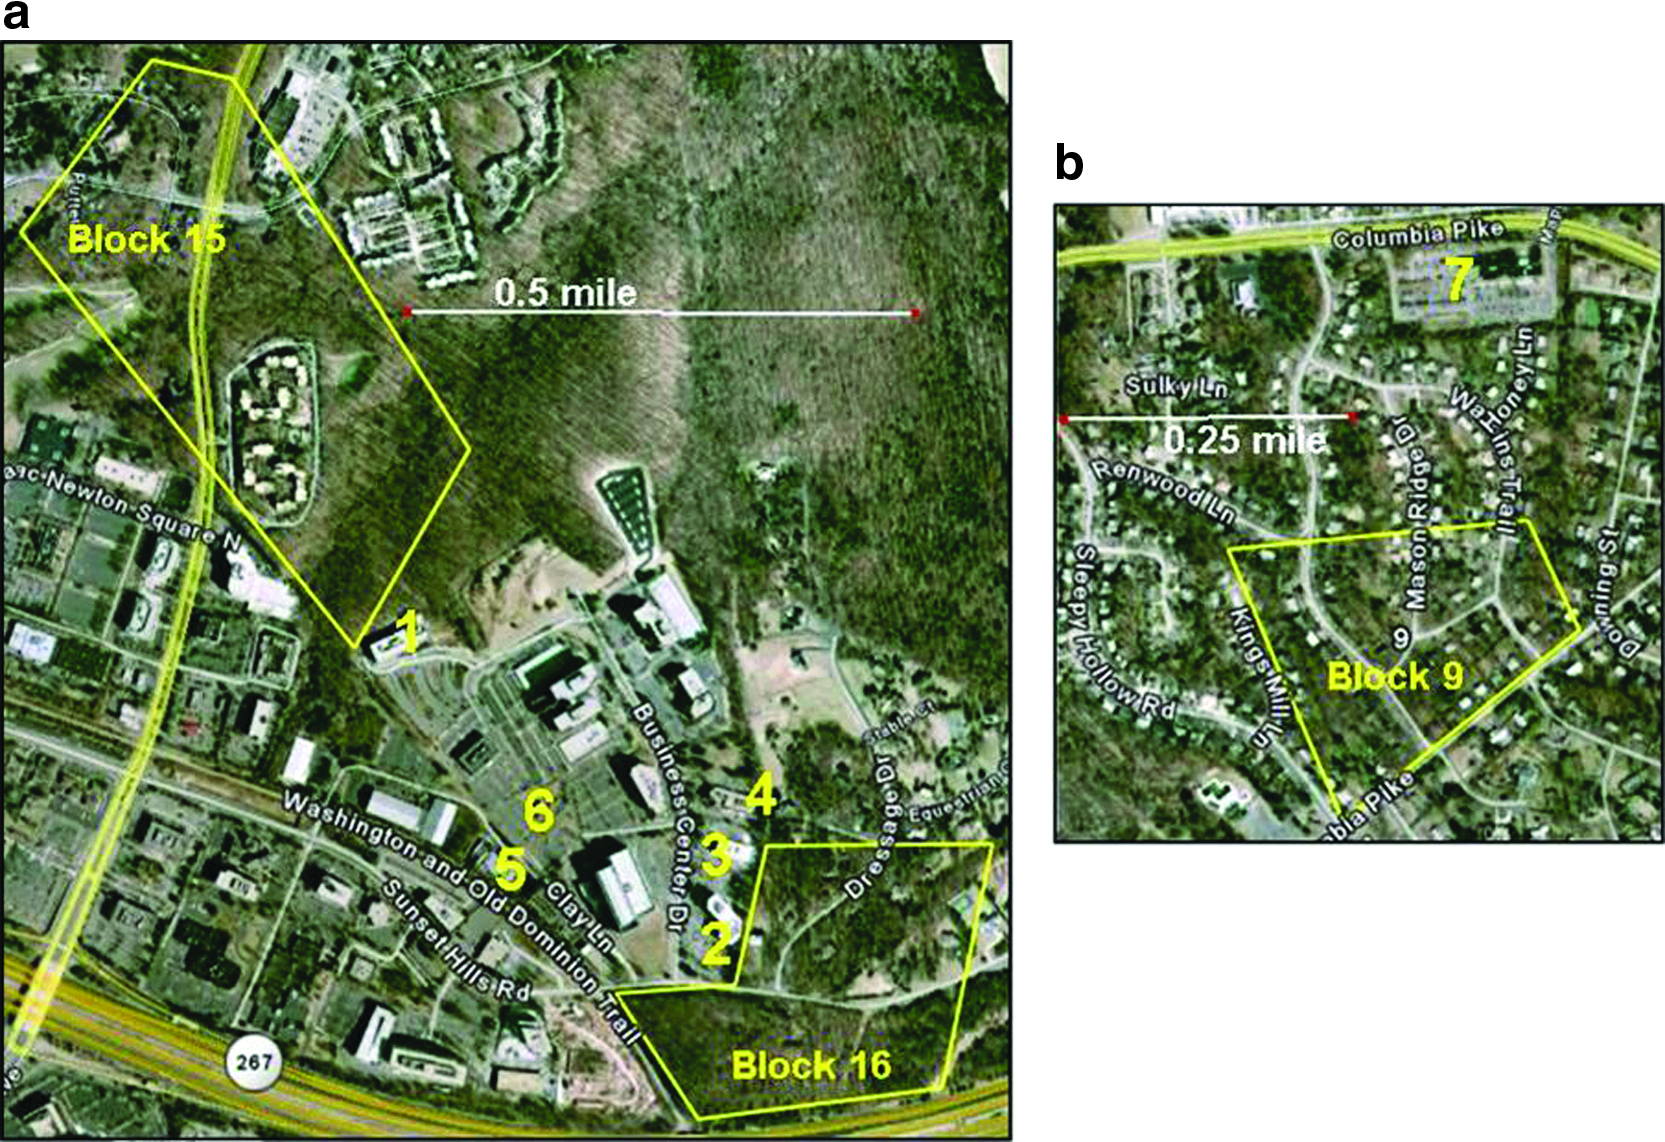
Location of Fairfax County 2009 spray blocks and buildings sampled: (a) blocks 15 and 16 and Buildings 1-6, and (b) block 9 and Building 7. Color images available online at www.liebertonline.com/bsp
All the buildings sampled in Reston (except building 5) were of similar use type; they were generally office buildings with a population in-flow in the morning and an out-flow in the afternoon. Building 5 houses large computer servers and had limited occupancy (typically 2 people) and no HVAC.
To evaluate whether there were differences between office-type buildings and other types of buildings, Building 7 in Annandale, VA, was also sampled. Building 7 houses a branch of the Fairfax County Police Department as well as county offices, so it has a 24-hour population flow. Building 7 was in close proximity to spray block 9, which was 28 acres (Figure 1a).
Spraying occurred on a Friday morning. The first 2 buildings (Buildings 1 and 4) were sampled on the following Tuesday. All other buildings were sampled on Wednesday or Thursday. This allowed at least 1 day of normal activity prior to sampling. Building managers were asked to postpone rigorous cleaning between spraying and sampling, and all building managers except Building 4 complied.
Modeling
Los Alamos National Laboratory's Quick Urban and Industrial Complex (QUIC) dispersion modeling system was used to model the outdoor transport, dispersion, and deposition of the Btk slurry mixture after its release from the helicopter over spray blocks 15 and 16.20-22 Airborne concentrations were computed around the buildings sampled, and this information was used as inputs (source terms) for indoor simulations.
Building modeling and simulation were conducted with the aid of Sandia National Laboratories' Facilities Weapons of Mass Destruction Decision Analysis Center (FacDAC) capability. 23 FacDAC enables the simulation of indoor and outdoor chemical and biological incidents and responses. It has been evaluated using tracer particle and gas tests; in these studies, 35% of the particle prediction/measurement ratios were within a factor of 2, and 81% were within an order of magnitude. When FacDAC predictions differed from experimental measurements, FacDAC tended to under-predict the mass of particles collected. 24 This under-prediction (as opposed to over-prediction) is preferred when developing sampling recommendations because it provides a conservative estimate of the amount of material expected in a particular location. Building 4 was modeled using the National Institute of Standards and Technology (NIST) CONTAM® software, an indoor airflow modeling and simulation tool. The FacDAC model was then used to isolate individual infiltration mechanisms to accurately evaluate each mechanism's potential contribution to building contamination via the following process. Figure 2 schematically shows the 3 mechanisms studied via indoor modeling: entryways, windows, and HVAC flow paths.
Schematic of Various Infiltration Mechanisms Included in the FacDAC Models (blue circles represent Btk “particles”). Color images available online at www.liebertonline.com/bsp
Each infiltration mechanism was isolated by implementing “perfect” filters that allowed for air to pass through unaffected, but retained all contaminant particles. The result was to maintain a consistent airflow representation while limiting pathways for particle transport. Simulations were run using Monte Carlo techniques, and the Btk surface deposition was characterized in each model zone by the extent of contamination and integrated deposition. Next, simulations were run without isolating specific infiltration mechanisms, limiting the building operating conditions and flow path parameter ranges to closely match experimental Btk release conditions. Finally, the results from the isolated mechanism analysis, experiment-simulation Btk release analysis, and information about the building operational “state” were used to correlate infiltration mechanism with the experimental results. These results were generated for the Btk release scenario but may be extrapolated to a broader range of release types (eg, amount, mechanism). However, some characteristics (eg, particle size) will influence these correlations; the effects of particle size on modeling results will be discussed in more detail in the Results section.
Previous studies have demonstrated the appropriateness of accounting for detailed geometric and flow path information when modeling airflow in residential and commercial structures. 25 Thus, detailed architectural and mechanical drawings were acquired for the building and used in the model development. To account for the variability and uncertainty in experimental building operating and environmental conditions, simulation input parameter distributions were used. For example, a range of particle size distributions was used, and a modified Latin Hyper-Cube method employed to ensure an appropriate sampling of the input parameter range. These parameter values/ranges were used for both the isolation study and the experimental validation study. Wherever possible, experimental measurements and QUIC-generated plume maps were used to set ranges or define key parameter values, which include the values shown in Table 2. Values for HVAC filter performance were obtained from the literature. 26 Some release characteristics are results generated from the QUIC model, as noted.
In particular, the QUIC model was used to generate the expected initial distribution of particle sizes; this was not measured during calibration of the sprayer but can be estimated based on calibration results and the known performance of the Micronair AU5000 rotary atomizer. As shown in Figure 3, the initial water droplet size distribution was lognormal, with volume median diameter (VMD) of 200 microns and standard deviation of 2. The VMD estimate was based on information from Virginia Department of Agriculture personnel involved in the calibration of the sprayer, and the initial droplet size distribution was based on a large experimental droplet size database contained in the AGDISP spray model specifically for the Micronair AU5000 rotary atomizer at the recorded flight speeds. 27 Following droplet evaporation, the final size of the remaining dry agglomerates can be calculated using the percent solids in the original material. Since the suspension sprayed contained 3.3% solids, the final dry agglomerate particle diameter should be roughly one-third the size of the initial droplet diameter (assuming 0.8% packing density).
QUIC Simulations for Initial Droplet Size Distribution Matching Conditions of Btk Spraying in Fairfax County. Color images available online at www.liebertonline.com/bsp
Experimental Results
Table 3 shows the number of samples collected and the number of positive samples by sample type for all buildings. Of 224 samples collected, more than 67% were positive. The 3M Trace Evidence Samples collected from HVAC filters exhibited the highest percentage of positive samples (more than 88%). More than 68% of vacuum sock samples were positive. These 2 sample types also yielded the largest average amount of viable agent. In general, this is not surprising. Vacuum methods (3M Trace Evidence Filters and socks) were specifically favored for this effort because of their ability to sample large areas. With local deposition patterns in the buildings largely unknown at the time of sampling, sampling larger areas was presumed to be the most effective means of obtaining a positive.
Table 4 lists the percent of samples positive by type and building. For all buildings sampled, more than 45% of the total samples were positive. This was expected, as buildings were chosen for their proximity to the spray blocks. The lowest percentage of viable samples was obtained in Building 4. This is interesting to note, since that building had been cleaned between spraying and sampling. However, the percentage of positive samples was still 46%.
One sample taken.
The results from 3M Trace Evidence samples collected from HVAC filters are shown in Figure 4. HVAC filters are difficult to vacuum because of their large surface area, and deposition may not be uniform across the filter. Positive samples were collected from the outside-air side of all HVAC filters sampled. The inside-air samples from 2 buildings (Buildings 4 and 6) were negative. Figure 4 also includes positive results from 2 filters obtained from a building adjacent to Building 6, denoted as Building 8.

Positive Samples Collected from the Outside-air and Inside Area Sides of Separate HVAC Filters Located in the Same Air Handling Unit (AHU) on Each Building. Building 8 and Building 8 (20%) are filter samples taken from 2 separate AHUs in a building located adjacent to Building 6.
Building 1
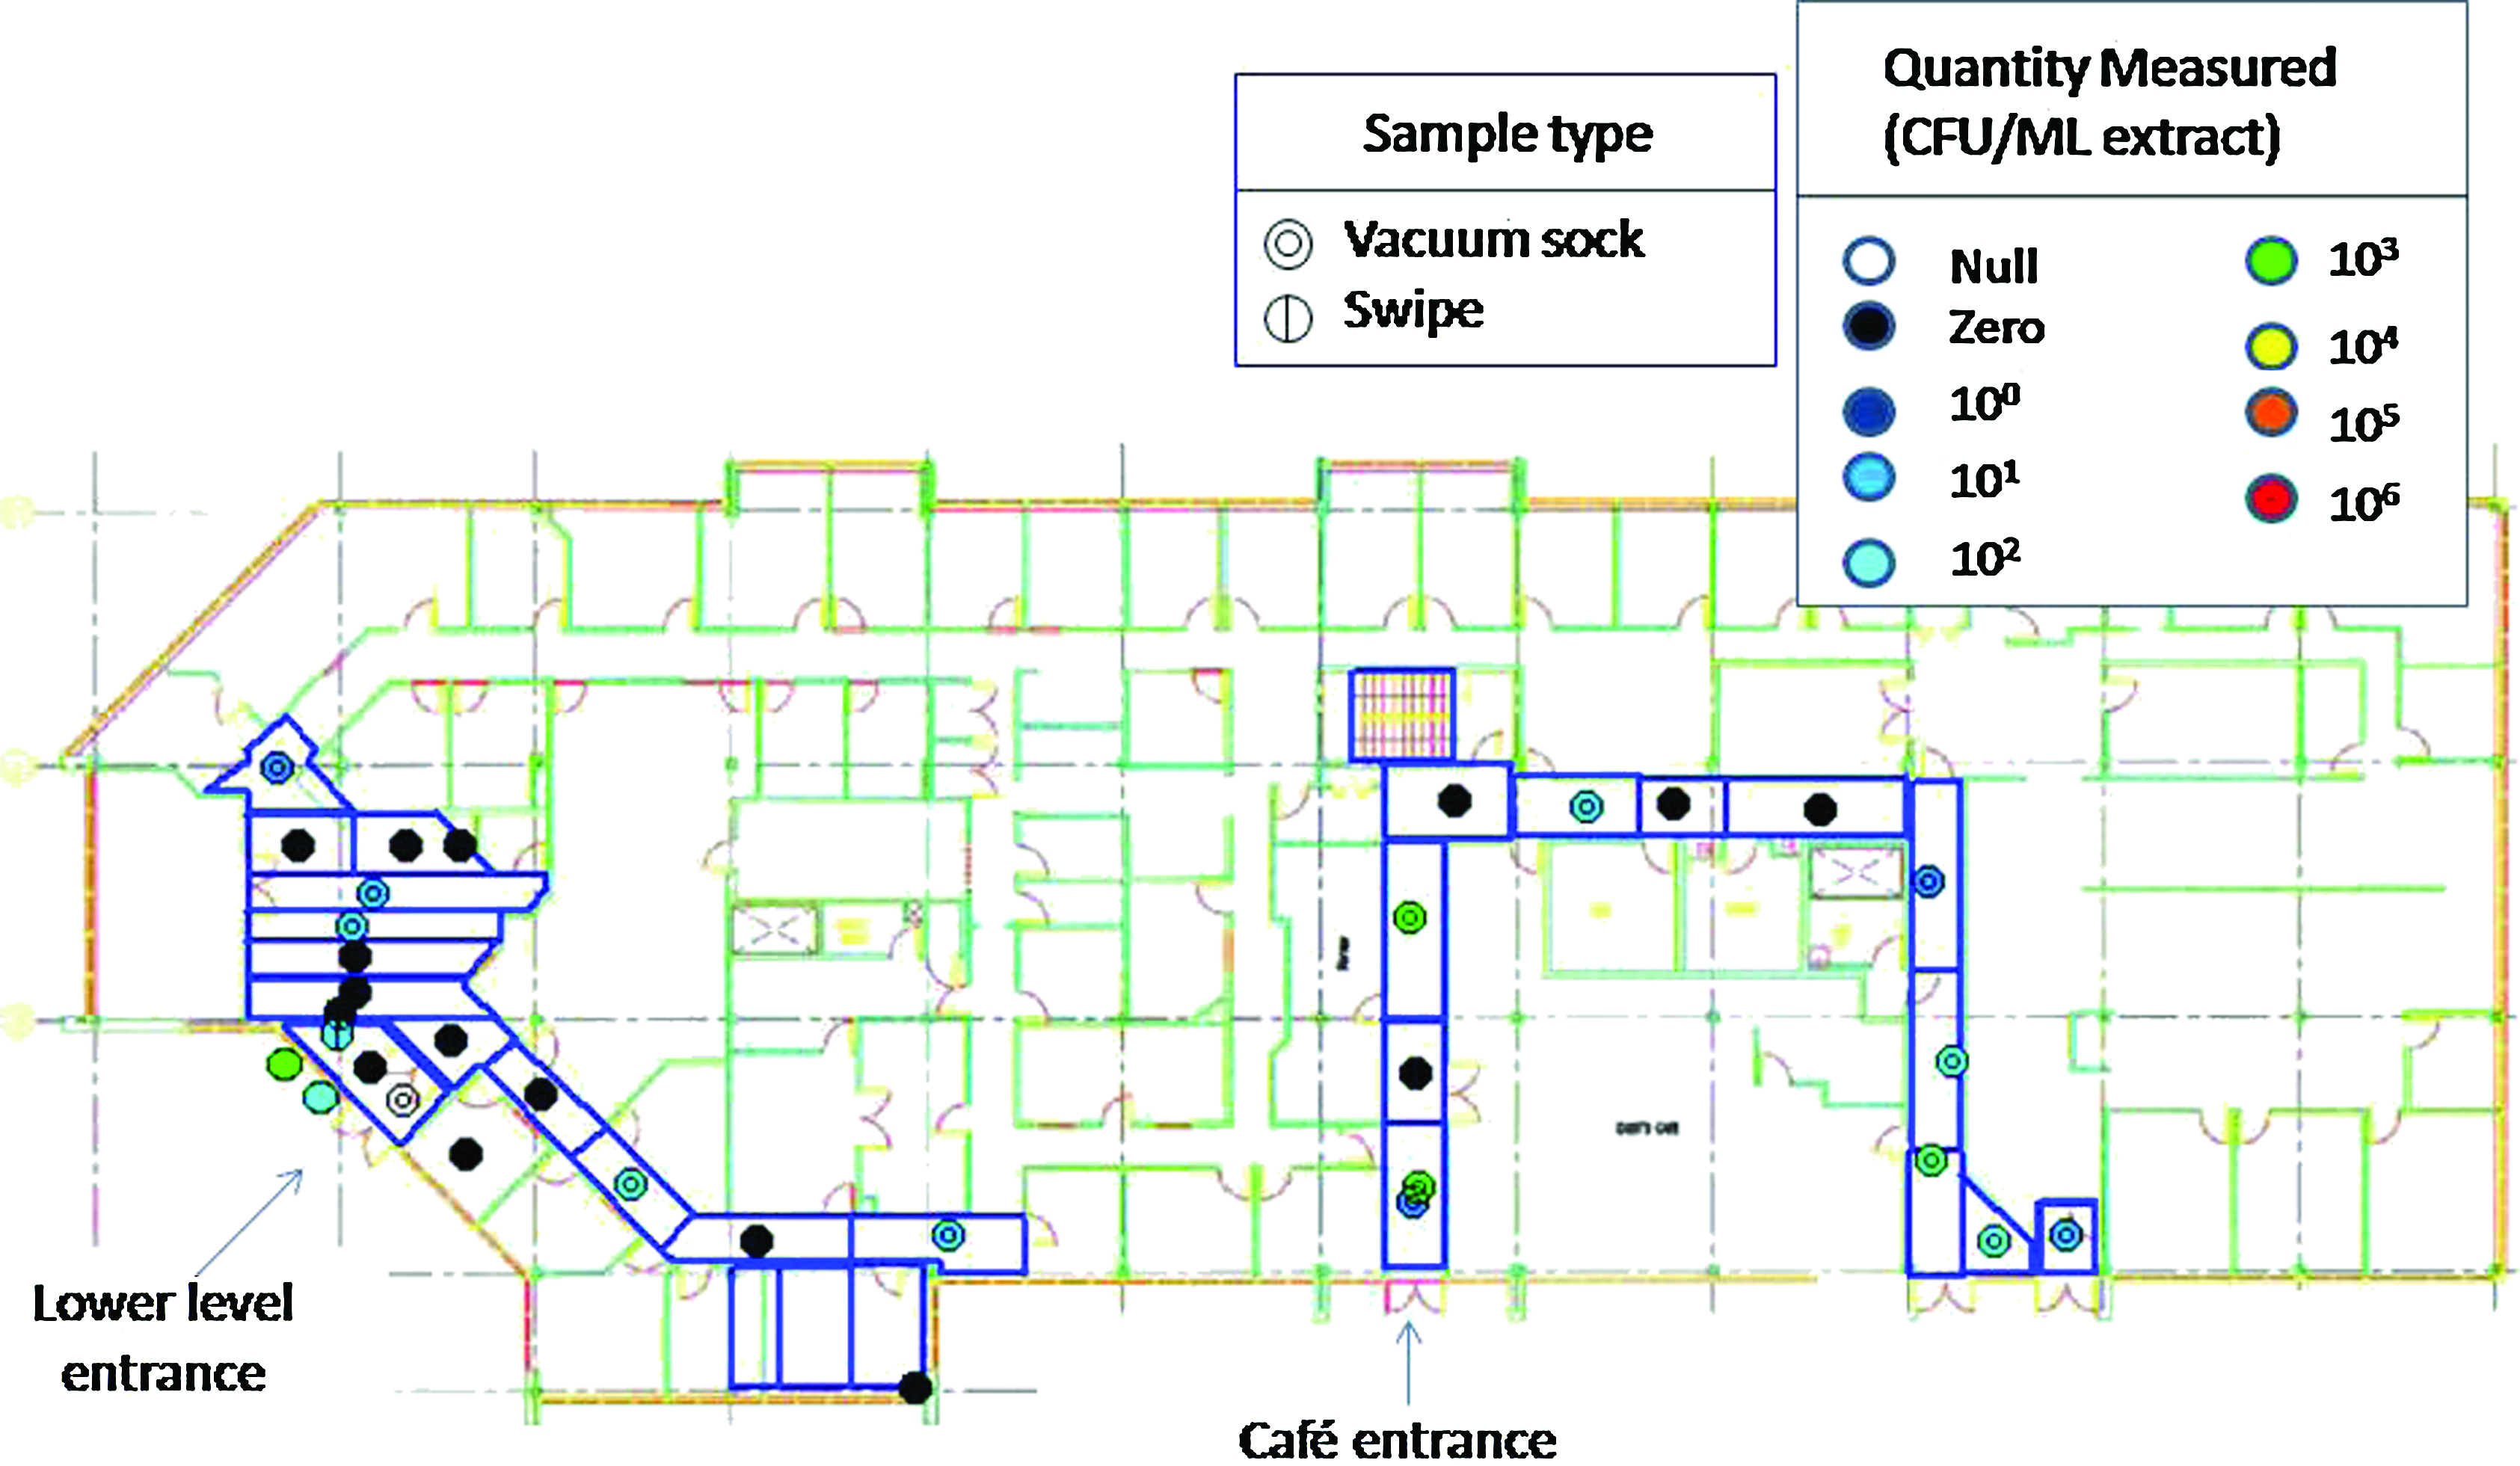
A total of 44 samples were collected from Building 1 (Table 5); 84% were found to have viable Btk. The majority of these were vacuum socks from areas near the main entrance and loading dock of the building (Figure 5). Both 3M Trace Evidence samples, one taken from the outside-air side of the HVAC filter and the other from the inside-air side of a second filter, were found to have viable Btk.
Results for Building 1 Samples. Color images available online at www.liebertonline.com/bsp
Samples Collected from Building 1
Building 4
Forty-eight total samples were collected from Building 4 (Table 6); 46% were found to contain viable Btk. The majority of these samples were collected near building entrances (Figure 6). The 3M Trace Evidence Samples found viable Btk on the outside-air side of the HVAC filter but not on the inside-air portion sampled. This could be due to lack of presence of viable Btk or ineffective sampling methods. Average CFU/mL concentrations were consistently low, as indicated in Figure 6; however, the building had been cleaned between spraying and sampling.
Results for Building 4 Samples from the Upper Level. Color images available online at www.liebertonline.com/bsp
Samples Collected from Building 4
Building 5
A total of 16 samples were taken from Building 5 (Table 1); more than 64% of these samples contained viable Btk. The majority of these were vacuum samples taken near the loading dock, though 1 swipe taken from the soda machine was also positive (Figure 7). No 3M Trace Evidence Samples were collected from Building 5 since this building lacks an HVAC system. One vacuum sock blank and 1 swipe blank were collected during sampling of Building 5. Both of these samples were negative for Btk. Since this building lacks an HVAC system, Btk is entering the building through entryways.
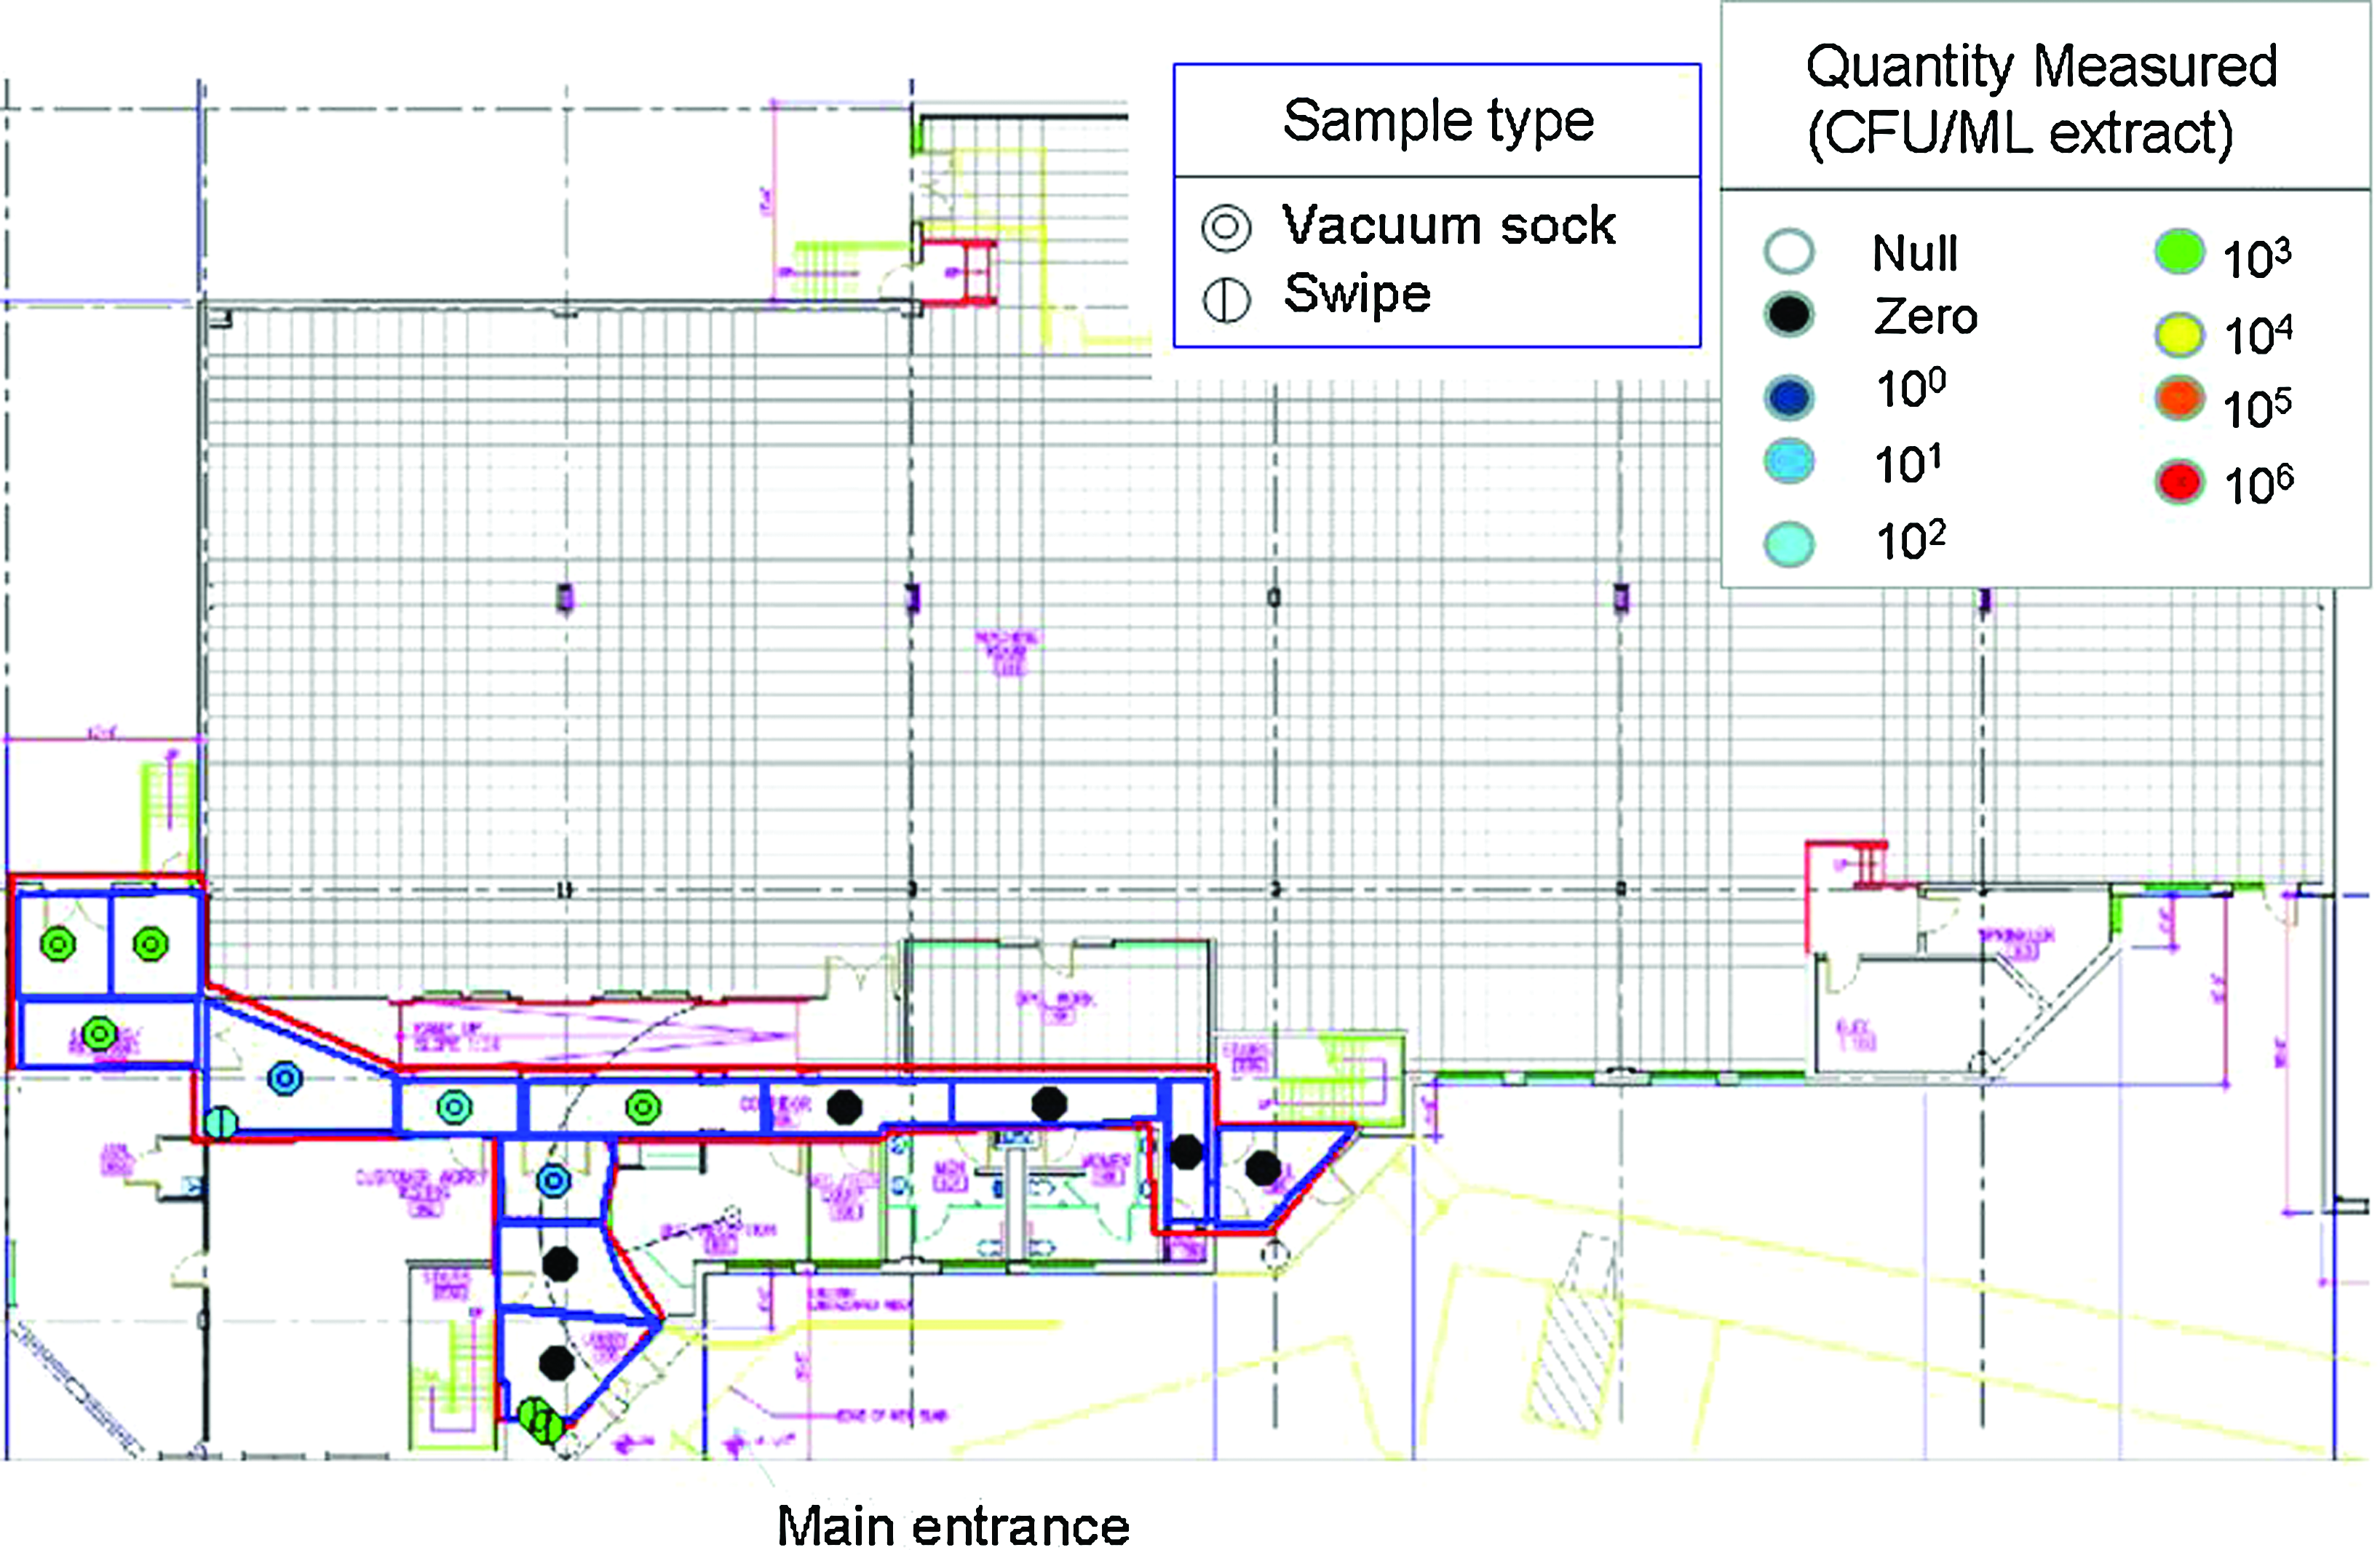
Results for Building 5 Samples from the Upper Level. Color images available online at www.liebertonline.com/bsp
The 3 buildings presented here are representative of all 7 buildings sampled, demonstrating a gradual trend of decreasing numbers of positive with distance from entryways. Results for Building 5, a building that lacks an HVAC system, support entryways as an important mechanism of building infiltration.
Modeling Results
Simulations of Infiltration Pathways
To investigate the predominant mechanism of building infiltration, isolation studies were performed on 3 infiltration pathways: windows, entryways, and the HVAC system. The model parameters were adjusted to selectively allow particle infiltration only through the path under evaluation and to prohibit infiltration through the remaining paths by incorporating impenetrable filters, which collect agent with 100% efficiency but allow unobstructed airflow. All cases were based on initial release only and assumed no infiltration from reaerosolization.
The results of an isolation study examining the extent and intensity of indoor contamination by HVAC infiltration are presented in Figure 8. Examination of the results shows a facility-average deposition concentration of 690 spores/m2. The relatively low level of surface contamination in this simulation is driven by the removal of large Btk particles by the HVAC filters. Assuming a mean particle size of a dry particle of 60 μm and using standard filter efficiency curves generated for the types of filters (MERV-9), the HVAC filter efficiency is approximately 99.9%. Even with 5-μm particles, the efficiency of the filters is approximately 90%. 26 Widespread contamination is still observed throughout the facility, indicating that the HVAC is likely an effective distribution system once particles are inside the building.
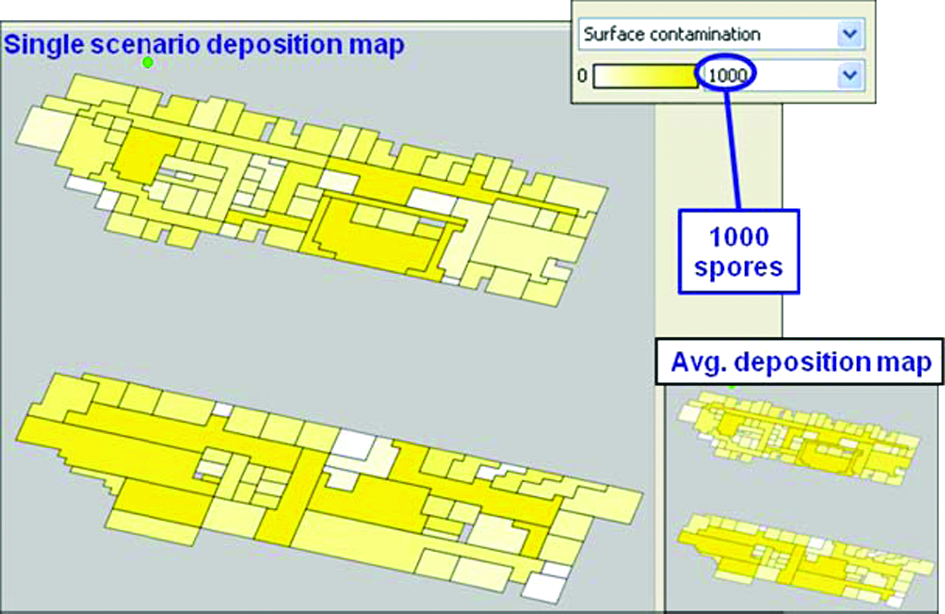
Representative Deposition Map of Building 4 for Infiltration via the HVAC System. Color images available online at www.liebertonline.com/bsp
The results of the isolation study examining the extent and intensity of indoor contamination by window infiltration are presented in Figure 9, resulting in a facility-average deposition concentration of 50 spores/m2. The low levels of surface contamination are driven by the removal of large particles by the inoperable windows (windows that do not open). Experiments have shown that infiltration via windows is effective only when the particle size of the penetrating agent is below 10 μm. 28 In simulation scenarios in which the agent is able to penetrate the windows, the agent typically remains localized around the point of infiltration.
Representative Deposition Map of Building 4 for Infiltration via Windows. Color images available online at www.liebertonline.com/bsp
The results of the isolation study examining the extent and intensity of indoor contamination by entryway infiltration are presented in Figure 10 and show a facility-average deposition concentration of 330,000 spores/m2. It is important to note that the simulation used a Monte Carlo approach, which randomly assigned values of 0% to 20% open for the entryways. At this high level of deposition, vacuum samples are likely to produce positives, as was seen in the experimental results. The high levels of deposition are the result of multiple entryways, each with minimal filtration; the simulation indicates nearly all the agent that challenges an open entryway is allowed to enter the building. The surface concentration levels calculated in the simulations are 3 orders of magnitude greater than the HVAC or window infiltration isolation analyses, indicating that infiltration via entryways is likely the predominant mode of contamination.
Representative Deposition Map of Building 4 for Infiltration via Entryways (the arrows indicate the locations of the entrances to the building). Color images available online at www.liebertonline.com/bsp
Simulations of Experimental Conditions
Simulations of infiltration were run using the Btk experimental building operating conditions. The building HVAC filter efficiencies were adjusted based on facility owner comments, and inoperable window particle filter efficiency was determined from the literature. 29 Results show the indoor contamination levels based on operating conditions at the time of the Btk spraying with a facility-average deposition of 330,000 spores/m2 (Figure 11). This result is not surprising given the 3 order-of-magnitude difference between deposition via the entryways and via the HVAC system and windows.
Scenario Library-Averaged Deposition Levels for Building 4 Using Simulation Input Parameters Matching Experimental Release Conditions. Color images available online at www.liebertonline.com/bsp
As noted previously, the Btk used for this experiment was applied as crude slurry with most of the initially released particles outside the respirable range. To determine whether the results from this experiment would have been substantially different if a dry, weaponized powder had been released, a simulation was also performed using weaponized agent. Condition parameters were similar to those presented in Table 2, except the particles had a mean size of 2 μm, with a log-normal distribution of sizes ranging from 1 to 9 μm. The results, shown in Figure 12, indicate that the size distribution of the particles has a significant impact on the amount of indoor surface contamination deposited. Compared to the slurry, the weaponized release produces a significantly lower average surface contamination but with similar locations of high deposition concentration relative to the rest of the building (ie, similar targeted sampling locations could be used). The reduction in overall surface contamination can be explained by the smaller particles passing more efficiently into and back outside the building before they have sufficient time to settle; smaller particles have a significantly longer settling time than larger ones. However, although fewer particles deposit, when they do deposit, they deposit in the same general areas, which implies that the sampling strategy to “rule in” buildings following a weaponized or slurry release would be similar—a fortunate conclusion since it is not clear the release type will be easily identifiable in the aftermath of an attack.
Weaponized Particle Size Release Scenario Library-Averaged Deposition Levels for Building 4. Color images available online at www.liebertonline.com/bsp
Method for “Ruling In” a Building as Contaminated
Together, the experiments and modeling simulations indicate that infiltration into buildings following a wide-area biological release may be significant and that entryways may be the dominant pathways for infiltration. Isolated modeling and modeling using experimental data both resulted in the highest deposition in entryways, and the experimental sampling indicated that large-area vacuum samples are a reasonable method for collecting agent. Based on these results, it is recommended that a limited number of large-area vacuum samples be collected from the main entryways of buildings as the first step to rapidly identify contaminated buildings.
Vacuum samples (3M Trace Evidence Collection Filters) collected from HVAC filters were also an effective method of collecting viable sample. Additional vacuum samples may therefore be collected from HVAC filters if time and resources allow. Before additional samples are collected, an assessment should be made of whether or not spatial resolution within an individual building is important in determining remediation methods. If the deposition pattern in the building will not affect the remediation method (eg, if the building will be fumigated regardless), samples from an individual building may be pooled to reduce laboratory analysis time.
In most cases, a correlation was observed between viable agent on the outside-air side of the filters and on the inside-air side of the filters. In this experiment, no comparison was made between more sophisticated filtration systems (eg, HEPA filters, filters with high MERV) and less sophisticated filters. If more sophisticated filters are employed, it is possible that agent will be retained on the outside of the filter but will not pass into the building. In these cases, it might be prudent to sample the inside-air side of the filter, which may be more representative of building contamination. In buildings with less sophisticated filtration systems, or where filter characteristics are unknown, either side of the filter may be sampled, depending on ease of access.
Sampling HVAC filters can be a time-consuming effort if a building has a large number of HVAC filters spanning different floors. If it is not feasible to sample all HVAC filters, prioritization may be easily accomplished by checking operating conditions. If a particular HVAC was not operational during the release period, there may be little value in sampling it. For cases in which operational information is not readily available, a representative set of HVAC filters spanning the building should be collected (eg, the highest and lowest filter, filters on every 10th floor, or filters with multiple compass directions of exposure).
Footnotes
Acknowledgments
LANL acknowledges the Defense Threat Reduction Agency, Chemical and Biological Defense Applied Technologies Division, which supported this study under the Interagency Biological Restoration Demonstration (IBRD). LANL is grateful for the support and peer review provided by members of the IBRD team. Lisa Hendricks and Laura Castro (LANL) assisted in environmental sample analysis, and Scott White (LANL) provided additional support. Jason Gans (LANL) designed the Btk assays. Nate Gleason, Bob Knowlton, Brad Melton, and Jonathan Leonard (SNL) provided additional support during sampling and data analysis. Troy Shaw and Frank Finch in Fairfax County and Larry Nichols at the State of Virginia Department of Agriculture and Consumer Services provided critical information and coordination on spraying in Fairfax County. We thank Steve Johnsen, Dan Ayed, David Maroni, Pamela Anderson, Bobby Lambert, and Frank Rodriguez for their assistance.
This document has been authored by employees of the Los Alamos National Security, LLC (LANS), operator of the Los Alamos National Laboratory under Contract No. DE-AC52-06NA25396 to the U.S. Department of Energy. The U.S. Department of Homeland Security provided funding for this study. The U.S. government has rights to use, reproduce, and distribute this information. Neither the U.S. government nor LANS makes any warranty, express or implied, or assumes any liability or responsibility for the use of this information. Reference herein to any specific commercial product, process, or service by trade name, trademark, manufacturer, or otherwise does not necessarily constitute or imply its endorsement, recommendation, or favoring by the Los Alamos National Security, LLC, the U.S. government, or any agency thereof.