
Abstract
Considerable effort has gone into making mathematical and computer models of smallpox spread and control measures, typically consisting of vaccination and quarantine. The orally available antiorthopoxvirus drug tecovirimat has recently completed Phase 2 clinical trials and shows promise as a smallpox control agent. We constructed 2 computer simulations to explore the use of tecovirimat in combination with vaccination and social cooperativity to control an outbreak. Two scenarios were considered: (1) a homogenously mixed, deterministic simulation of a single metropolitan area; and (2) a stochastic network of the 50 largest US metropolitan areas connected by commercial air traffic. Metropolitan-level mass vaccination coupled with drug treatment for all individuals who develop a fever considerably outperforms treating only those who develop smallpox's distinctive rash. Incorporating mass chemoprophylaxis represents another large improvement. More aggressive responses are more robust to low cooperation of the population with public health efforts and to faster disease spread. However, even with the most aggressive public health intervention, an attack that initially infects hundreds or thousands of individuals will need to be fought in multiple cities across the country.
Considerable effort has gone into making models of smallpox spread and control measures, typically consisting of vaccination and quarantine. The orally available antiorthopoxvirus drug tecovirimat has recently completed Phase 2 clinical trials and shows promise as a smallpox control agent. The authors constructed 2 computer simulations to explore the use of tecovirimat in combination with vaccination and social cooperativity to control an outbreak. Two scenarios were considered: (1) a homogenously mixed, deterministic simulation of a single metropolitan area; and (2) a stochastic network of the 50 largest US metropolitan areas connected by commercial air traffic. Metropolitan-level mass vaccination coupled with drug treatment for all individuals who develop a fever considerably outperforms treating only those who develop smallpox's distinctive rash. Incorporating mass chemoprophylaxis represents another large improvement. More aggressive responses are more robust to low cooperation of the population with public health efforts and to faster disease spread. However, even with the most aggressive public health intervention, an attack that initially infects hundreds or thousands of individuals will need to be fought in multiple cities across the country.
Many mathematical models and computer simulations have been constructed to understand the spread of smallpox and the efficacy of vaccination and quarantine as a response,3-8 but the uses of an effective antiviral drug have not yet been well explored. The addition of a shelf-stable, orally available 9 antiorthopoxvirus drug to the Strategic National Stockpile suggests reconsideration of control strategies. Obviously, the nature of the disease prevents generating the necessary clinical experience that traditionally accompanies recommendations for antimicrobial use. Under these circumstances, mathematical models become an indispensable analytical tool.
A great deal of excellent work has been done building computer and mathematical models of smallpox spread and control. 10 Modeling techniques have included homogenously mixed populations, 3 metapopulation models,5,8 and individual-based models,4,7 simulated either deterministically 3 or in some way stochastically.4,5,7,8 All models are by necessity an abstract representation of reality and hence fail to perfectly capture all the details of the real world. Tradeoffs in modeling decisions abound. Adding complexity to a model may make it more realistic in some ways but also increases the number of parameters for which reliable values may be difficult or impossible to find. Many authors choose a model such that individuals move through each of several disease states with exponentially distributed waiting times,3,5,6,8 allowing the population of each state to be simply lumped together, but at the cost of allowing a fraction of individuals to move through their disease course at speeds arbitrarily faster or slower than has been observed in real life. Other models move individuals through disease stages on other timetables,4,7 gaining some realism at the cost of extra computational complexity. Time may be continuous, typically with an implicit assumption that the 24 hours of the day feature the same activities and risks of transmission, or happen in discrete steps.
The scenarios and interventions of interest also suggest certain modeling choices. It is easier to explore ring vaccination with a metapopulation model, and contact tracing with an individual-based model, while mass responses can be captured in almost any type of model. A stochastic model can capture the importance of randomness when the number of infected people, and hence the number of new infection events, is small. A deterministic model is likely to be less computationally intensive and more tractable to formal mathematical analysis but less accurately describes small outbreaks.
Modeling choices may bias results in a particular direction. Homogenous mixing has been said to exaggerate the rate of spread because it does not capture local saturation, and thus to favor mass vaccination over contact tracing and isolation. 11 Many models5,6,8 spread the infectivity of individuals with a rash over the full length of the 8- to 9-day rash period, whereas infectivity appears to be heavily front-loaded toward the first 3 days of the rash. 12 This makes isolation appear more effective, as there is a longer window in which it is worthwhile to find and isolate an individual, and a lower marginal cost in each day's delay in doing so.
Few models explicitly consider limited manpower and other resources needed to carry out contact tracing 3 or isolation, a labor- and resource-intensive task that must be carried out quickly to be effective. Inclusion of this consideration suggests that, while an outbreak started by a small initial number of infected individuals is controllable through contact tracing, the “race to trace” contacts of infected cases will be lost if there is a large number of initial infections.
Most authors have concluded that some sort of ring vaccination or regional mass vaccination is superior to contact tracing and isolation under at least some sets of plausible conditions and parameters.3-5,8 The most notable exception to this 7 relies on a low prodromal infectivity 13 that has since been estimated at a considerably higher value by the same author, 12 a high rate of vaccine-related deaths 14 that appears to not be greater than would be expected in nonvaccinated age-matched controls, 15 and to also consider only small initial numbers of infected people.
We were interested in developing a model to explore a large deliberate release of smallpox and how an effective antiviral drug could be used in combating it. Many other authors have found that a large number of infected people puts contact tracing at a disadvantage compared to mass responses,3-5,8 and the CDC recommends broad vaccination in such cases. 16 Our interest in large outbreaks and mass responses allowed us to choose a relatively simple deterministic, homogenously mixed model. We wanted to capture long-distance geographic spread, which is likely to be driven by rare events even for an epidemic numbering in the thousands.17,18 This motivated a stochastic model for disease spread.
Model
Our model calculates the fraction of the population in each state on a daily basis. States consist of all combinations of immune status, vaccination status, drug status, infection status, and, for those infected, the expected outcome of their disease (recovery or death). We use separate states for each day in the infection sequence. Each day, the infected population moves through its disease progression (summarized in Figure 1), new infections are spawned by the infectious population, and the public health intervention takes effect. We first modeled a single metropolitan area of population 10 million using the parameters (see Table 1) and dynamics described in the following sections. See the Supplemental information for a more detailed discussion of the model (www.liebertonline.com/bsp).
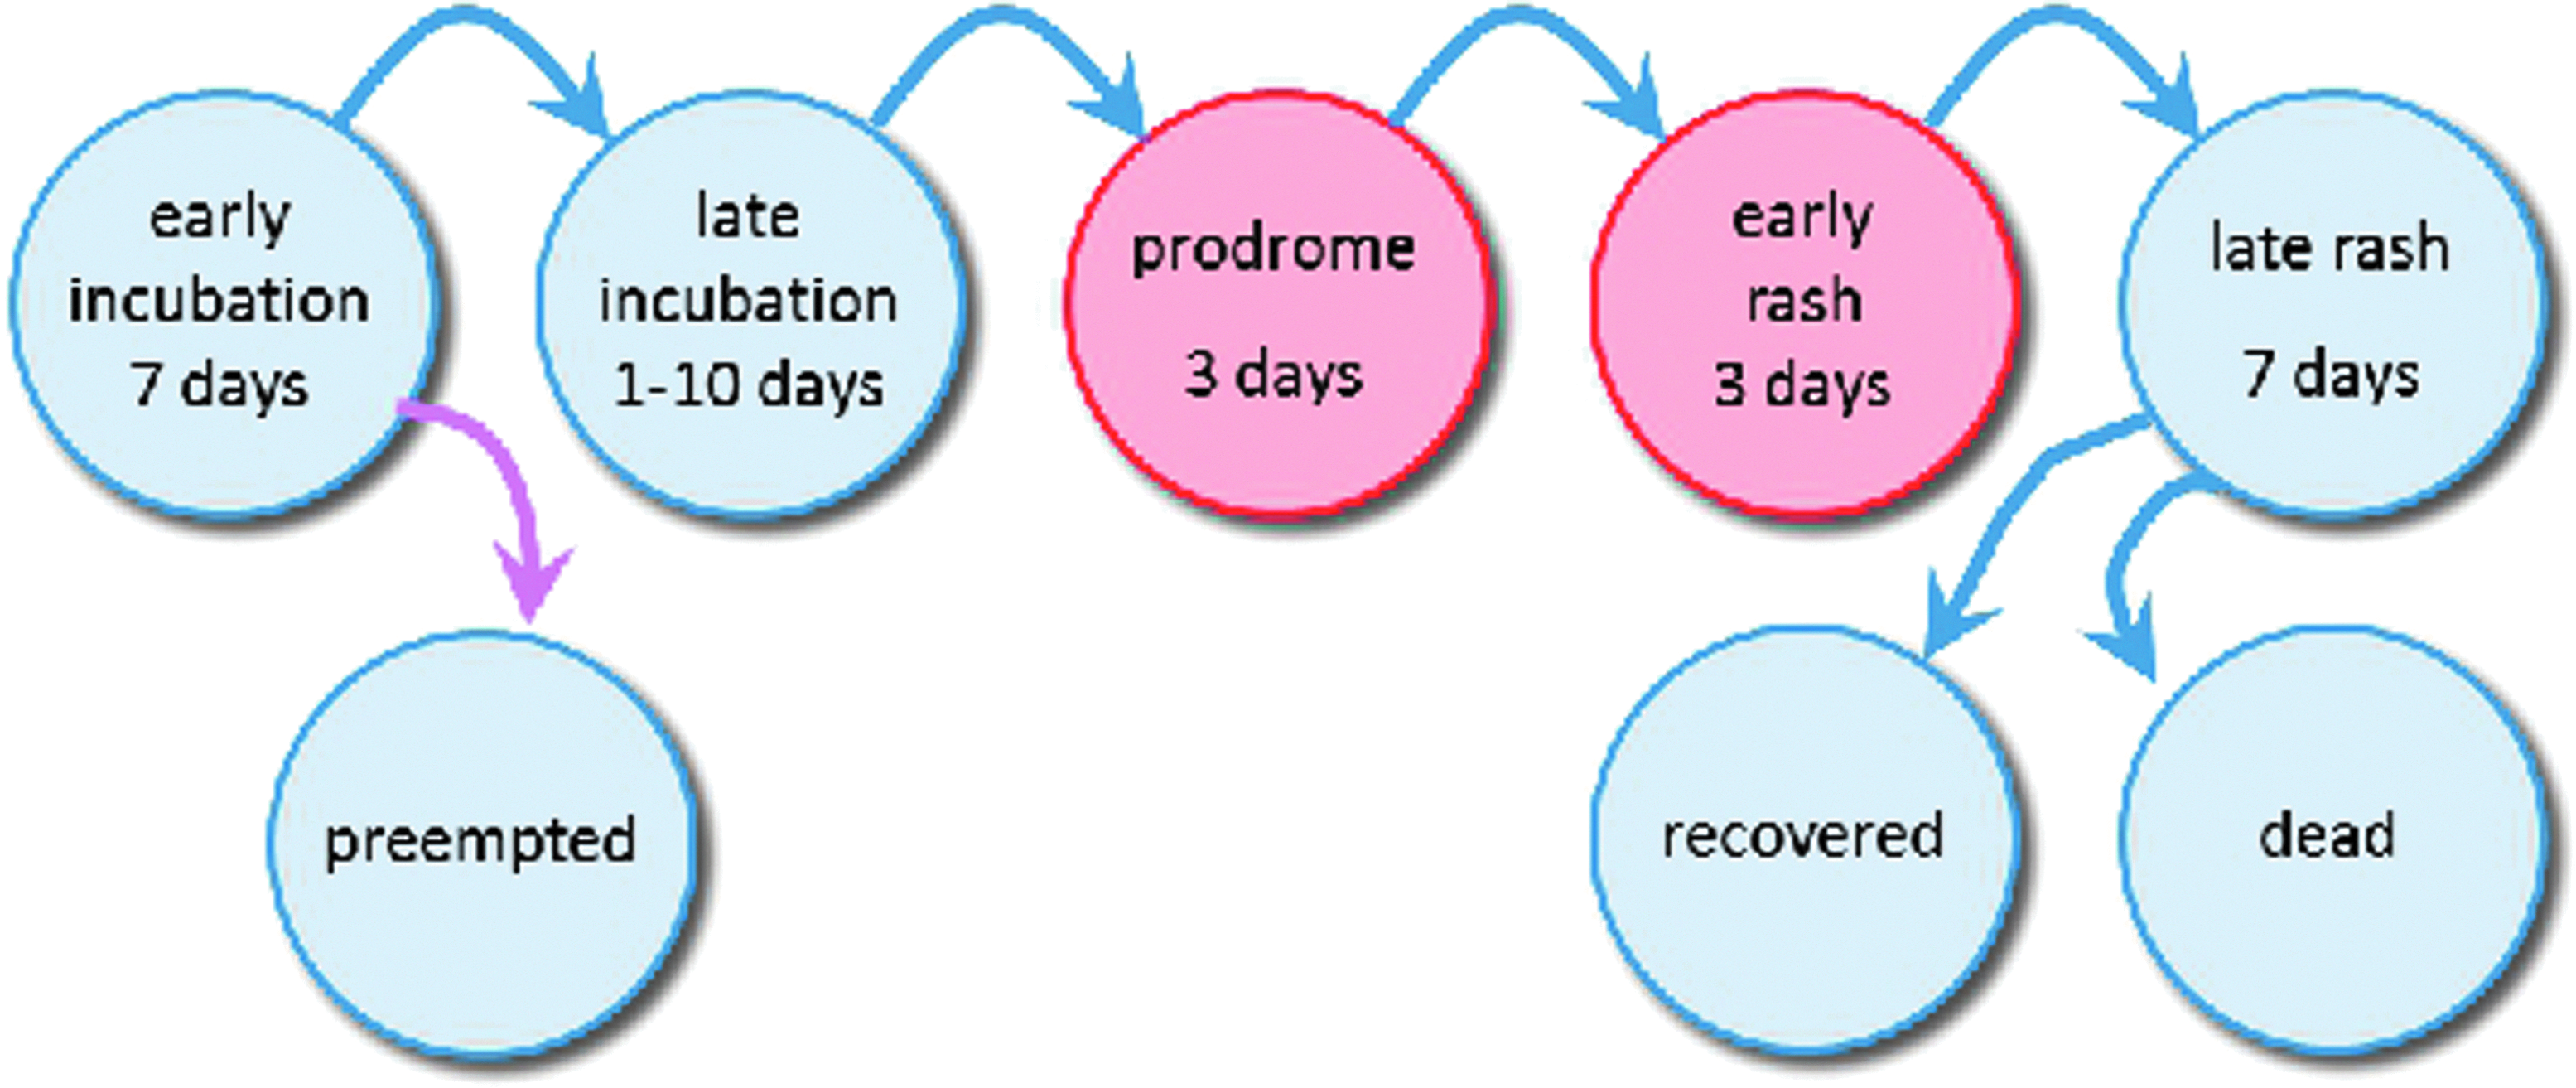
Disease Progression Overview. Infected people move through the shown stages as their disease progresses. Blue arrows indicate the natural progression of the disease. The prodromal and early rash stages shown in red are both infectious. The violet arrow indicates the possibility of vaccination or drug treatment of early incubators to preempt the disease, removing them from the disease progression. The amount of time spent in the late incubation stage is uniformly distributed from 1 to 10 days; all other stages last for a fixed length of time.
Disease Parameters
We subsequently expanded the model to a multicity network consisting of the 50 largest Metropolitan Statistical Areas (MSAs) in the United States, taken from the 2010 census. 17 The total population of these MSAs was approximately 166 million. We calculated the average number of commercial air passengers traveling between each pair of MSAs using the Q1 2010 Airline Origin and Destination Survey from the Bureau of Transportation Statistics. 18 The low rate of air traffic (about 3 people per thousand fly out of New York to another major metropolitan area daily) means that even with a large infected population, the number of infected individuals flying between pairs of cities is small enough for there to be strong stochastic effects. We thus modeled intercity spread in a stochastic fashion.
Each day, each city in the network is simulated, and then travel by infected individuals is calculated. Individuals with a rash are never able to fly. Individuals with a fever are able to fly only if their departure city has not yet detected an outbreak. (See the Supplemental material for a more detailed discussion of this calculation.)
The multicity model captures only domestic commercial air travel. For close pairs of cities that are well connected by roads or rail (eg, Philadelphia and New York), this substantially underestimates the total number of passengers moving between the cities and thus provides a lower bound on the spread of the disease from one metropolitan area to another. Air travel serves only to transport infected individuals from one city to another in this model; the possibility of the infection spreading on an airplane itself is not explicitly considered. The model assumes that air traffic is not substantially altered because of the disease.
Disease Course and Spread Dynamics
Parameters for smallpox's spread and its interaction with vaccination are drawn from work by several authors.1,12,13,19,20 In our model, smallpox has an asymptomatic incubation period of length uniformly distributed from 8 to 17 days 12 (which we subdivide into a 7-day “early incubation” period followed by a “late incubation” period of 1 to 10 days), followed by a slightly infectious febrile prodrome period of 3 days, 19 followed by a highly infectious early rash period of 3 days, 19 followed by a minimally infectious late rash period of 7 days. The single most important parameter for determining the severity of an outbreak and its susceptibility to containment is the basic reproductive number R0, the number of secondary cases a single infected individual will cause in a fully susceptible population. Estimates for R0 vary widely. We consider values of 3.0,3 6.9,13 and 10. 21 The fraction of secondary cases generated in the prodromal period is taken to be 0.21; the remainder are caused in the early rash phase. 12 Within each infectious 3-day period, infectivity is taken to be a constant. At the end of the rash period, infected individuals die with probability 0.3 and recover with probability 0.7.1 Recovered individuals enjoy long-lasting immunity.
Immunocompromised Individuals
People living with HIV/AIDS, cancer chemotherapy patients, and solid organ transplant recipients all have reduced immune function and might be expected to be particularly vulnerable to smallpox. Kemper estimates the current number of immunocompromised individuals as 3.6% of the US population. 22 These groups were all much smaller or nonexistent when smallpox was still endemic, so their exact susceptibility can only be approximated. Amorosa and Isaacs suggest that immunocompromised individuals are likely to be more susceptible to smallpox and are more likely to develop the difficult-to-diagnose, highly infectious, and particularly deadly confluent, flat, and hemorrhagic presentations of the disease. 23 Immunocompromised individuals are normally contraindicated for receiving the regular smallpox vaccine, although the Modified Vaccinia Ankara (MVA) vaccine 24 is considered safe for them. 25 We model immunocompromised individuals as twice as susceptible, twice as infectious, and twice as likely to die if infected.
Vaccination Dynamics
Successful recent vaccination provides almost complete protection against contracting smallpox. Prompt postexposure vaccination can preempt the course of the disease or attenuate its severity. We use Massoudi's 26 estimates of postexposure vaccine effectiveness: vaccination within 1 day postexposure provides a 90% chance of preventing disease and, failing that, a 90% chance of preventing mortality; vaccination within 3 days postexposure provides an 80% chance of disease prevention and 80% mortality prevention; and vaccination within 7 days postexposure provides a 25% chance of disease prevention and 50% mortality prevention. These values are summarized in Table 2. Our model assumes a 95% take rate for vaccination.14,27 Those vaccinations that take provide complete protection; those that do not take provide none.
Postexposure and Treatment Parameters
Protection due to vaccination in the distant past is considerably attenuated. In pre-eradication times, smallpox outbreaks often claimed the lives of large numbers of individuals who had been vaccinated 10 or more years previously. 1 We assume that routine vaccinations carried out before 1972 offer no residual protection and that the fraction of the population that has been recently vaccinated is negligible.
Drug Dynamics
Tecovirimat's efficacy against different orthopoxviruses has been explored in a variety of animal models. Experiments have shown that it can rescue animals from lethal pox disease after the onset of symptoms.28-30 The drug can rescue some, but not all, immunocompromised mice from lethal pox disease. 31 The drug can be offered in conjunction with vaccination, and animals enjoy the benefit of both treatments. 32 Infected animals receiving tecovirimat treatment have greatly reduced viral shedding in their nasal passages and lungs, suggesting reduced infectivity. 33
Based on the animal experiments, our model assumes that prophylactic drug treatment provides protection from infection, treatment within 7 days of infection prevents disease, treatment before the onset of rash offers 99% protection from mortality, and treatment within the first 3 days of rash offers 80% protection of mortality. We further assume that infectious individuals who are receiving drug treatment are 0.25 times as infectious as untreated individuals, effective the day after the start of treatment.
Attack Size
Each simulation begins with a certain number of initially infected people, which we term the attack size. We consider attack sizes ranging from 1 to 100,000 by powers of 10. An attack size of 1 or 10 could represent an accidental release. Larger attacks would represent a well-executed bioterrorism attack.
Responses
Our model assumes that a smallpox outbreak is detected when 10 individuals have developed a rash. There is then a 3-day confirmation and preparation period, after which the public health intervention begins. We considered the following interventions: (1) mass vaccination of the entire metropolitan area, assuming that use of the MVA vaccine means no one is contraindicated; (2) mass vaccination plus drug treatment of individuals after their first day of rash; (3) mass vaccination plus treatment of individuals after their first day of fever; (4) mass vaccination plus mass chemoprophylaxis; and (5) mass vaccination, mass chemoprophylaxis, and drug treatment of individuals after their first day of rash (Table 3). When individuals begin chemoprophylaxis, they are assumed to continue for the duration of the model. Symptomatic individuals who begin treatment and recover are assumed to enjoy long-lasting immunity.
Interventions
When simulating the multicity model, after the outbreak is detected in one city, other cities will detect an outbreak as soon as a single individual develops a rash.
Kaplan et al estimate that a mass vaccination campaign could be carried out in 10 days. 3 The 1947 vaccination campaign in New York, which did not screen vaccinees, peaked at a rate of 500,000 per day. 34 Given a population of 7.9 million, 35 this suggests a timetable of no less than 15 days. We consider vaccination timetables of 10 and 21 days.
The CDC's Cities Readiness Initiative sets as a goal that cities should be able to distribute antibiotics to their entire population within 48 hours. 36 It is uncertain how many cities are prepared to meet this goal. Our model considers mass chemoprophylaxis distribution timetables of 2 and 4 days.
Cooperativity
Public health measures may miss some individuals because of logistical failures, and some individuals may opt out of participation because of various beliefs or preferences. Our model consolidates these factors into a single “cooperativity” parameter. The fraction of individuals who will be vaccinated is equal to the cooperativity. Under mass chemoprophylaxis interventions, the fraction of individuals who will receive the chemoprophylaxis is equal to the cooperativity. Under fever- or rash-based treatment interventions, the fraction of people eligible to begin treatment who do so each day is equal to the cooperativity. Individuals decide to cooperate with vaccination and drug treatment independently. For low cooperativity scenarios, while many healthy people may skip prophylactic measures entirely, symptomatic sick people will often delay but seldom completely skip treatment.
A recent meta-analysis of 37 studies on the factors that determine an individual's intention to receive the H1N1 vaccine, or actual vaccination, showed a range of cooperativity that depended on beliefs in vulnerability to H1N1 infection, concerns over safety and efficacy of the vaccine, previous experience with vaccinations, and sources of information about the disease and the vaccine. Intention to receive the vaccine ranged between 5% in Hong Kong if cost and safety were considered, to 11% in one study in the general population in France, to 80% in the general population in Mexico. Vaccination rates were lower, ranging from 13% in one study of healthcare workers in Turkey to 51% in workers in a cancer hospital in France, to 76% in pregnant women in Canada. 37 Studies with mothers who make choices for their daughters to receive the HPV vaccine are in the same range, with one group reporting “probably yes, 48%; definitely yes, 27%; unsure, 19%; and probably or definitely not, 6%.” 38 We do detailed analyses with cooperativities of 1.0, 0.9, and 0.8 in combination with other varied parameters. In our sensitivity analysis, we also smoothly vary cooperativity from 0.1 to 1.0, with a fixed R0=6.9, 10-day mass vaccination timetable, and 2-day mass chemoprophylaxis timetable, in order to explore in greater detail the relationship between cooperation and outcomes.
Results
Single-City Model
Figure 2 shows the results of selected simulations of the single-city model. As expected, more aggressive interventions contain the outbreak faster and with fewer infections and deaths. Beginning drug treatment at the rash stage provides strong protection from mortality to infected individuals, but generally has a small effect on the duration or magnitude of the outbreak. Treating all individuals who develop a fever substantially outperforms treating after the appearance of a rash, eliminating the outbreak faster and with substantially lower morbidity and mortality. Both mass chemoprophylaxis interventions shown contain the outbreak under all tested parameters and do so faster and with a lower morbidity than any other intervention.
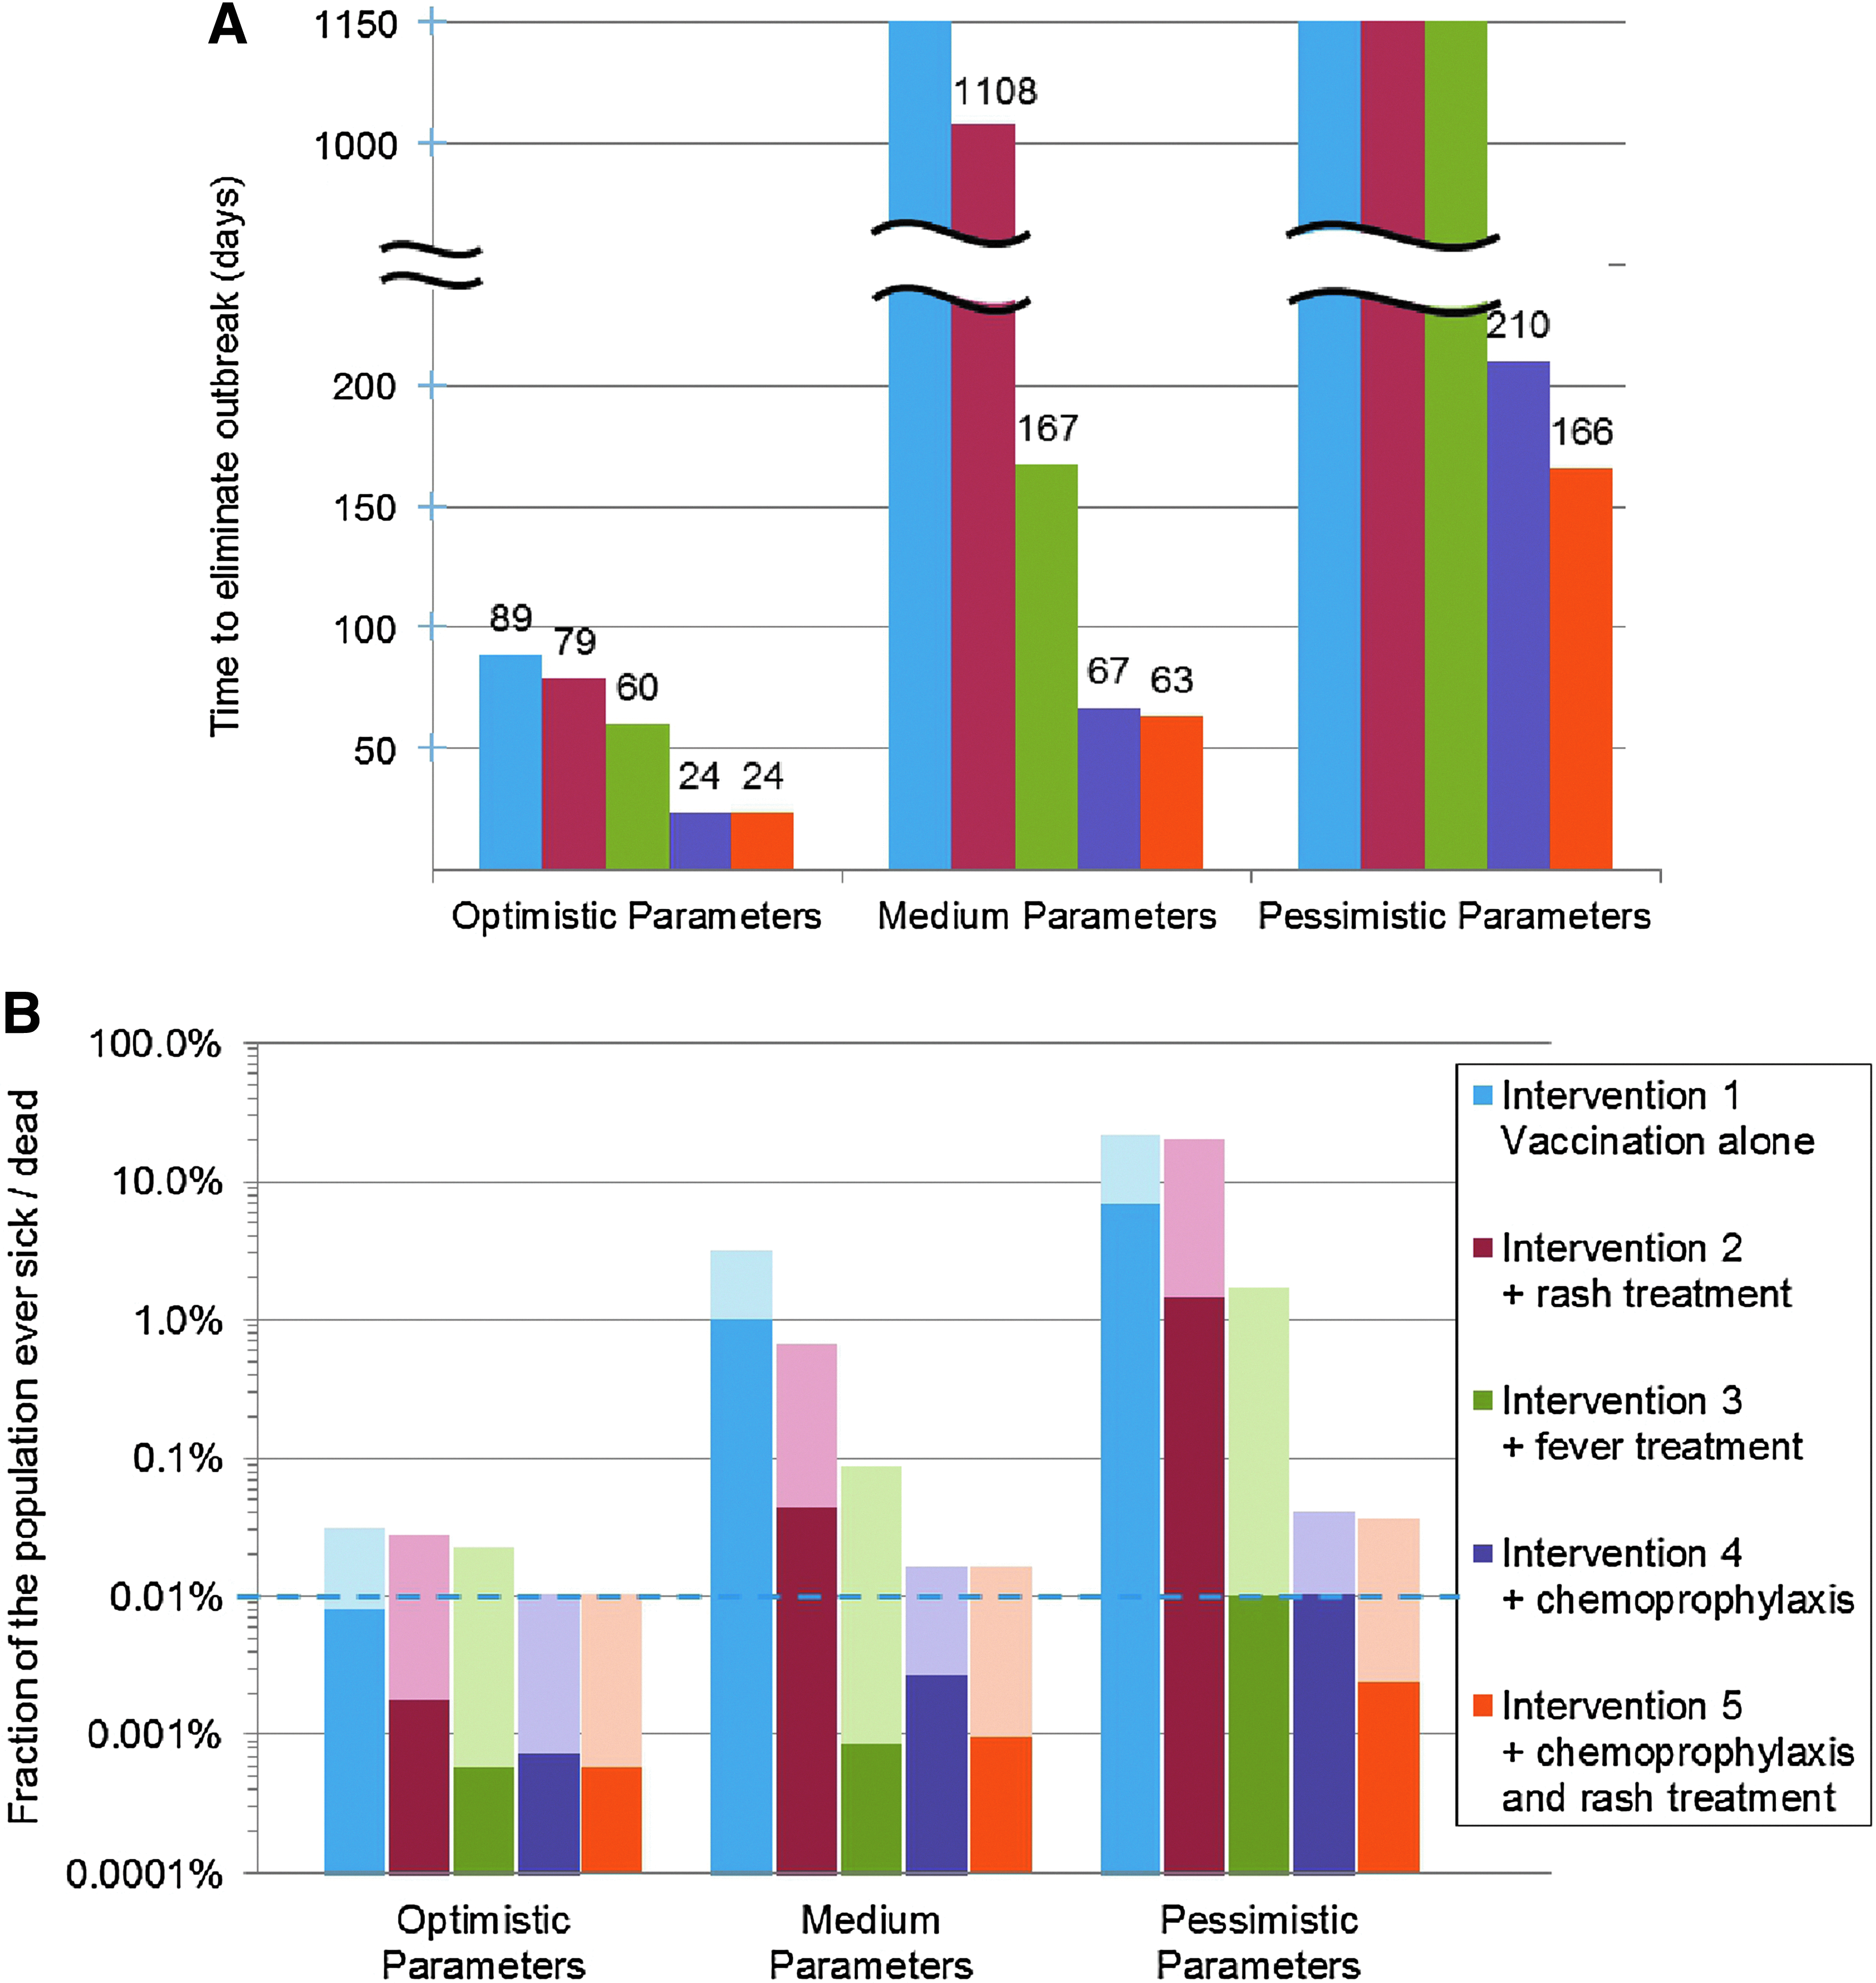
Selected Results of Single-City Simulation with Attack Size of 1,000 People. Results for interventions 1 through 5 are shown. Optimistic parameters consist of R0=3.0, cooperativity=1.0, vaccination time=10 days, chemoprophylaxis time=2 days. Medium parameters consist of R0=6.9, cooperativity=0.9, vaccination time=21 days, chemoprophylaxis time=4 days. Pessimistic parameters consist of R0=10.0, cooperativity=0.8, vaccination time=21 days, chemoprophylaxis time=4 days. Figure 2(A) shows the number of days required for the intervention to eliminate the disease; interventions that do not control the spread of the disease are shown as infinite. Figure 2(B) shows morbidity and mortality as fractions of the populations. Morbidity is shown in light colors; mortality is shown in dark colors. The dotted horizontal line indicates the initial attack size.
Full vaccination plus mass chemoprophylaxis (intervention 4) has surprisingly high mortality, higher than under full vaccination plus rash treatment (intervention 2). Several factors contribute to this. When cooperativity is less than 1.0, some individuals will neither be vaccinated nor receive chemoprophylaxis. Some of them will become infected. Under intervention 4, they do not receive any treatment. Additionally, intervention 4 does not prioritize infected individuals for chemoprophylaxis. Individuals who are infected when the outbreak is detected may have to wait as long as 4 days to receive their drugs, during which time they may progress to a less treatable state. Intervention 5, which incorporates treatment for individuals with a rash, greatly ameliorates both of these problems.
Even under the most pessimistic parameters we consider, for attack sizes of at least 100, intervention 5 eliminates the outbreak with morbidity less than 4 times the initial attack size, and mortality less than a quarter of the original attack size.
Figure 3 shows sensitivity analysis of cooperativity and R0, while Figure 4 shows sensitivity analysis of drug effectiveness parameters. Figures 3 (A), (C), and (E) vary cooperativity, while Figures 3(B), (D), and (F) vary R0. All other parameters are held constant. With a high cooperativity or low R0, all interventions will eliminate the outbreak in less than a year, with fewer than 8 people ultimately infected per initial infection and with more aggressive responses performing better than less aggressive ones. With progressively more adverse parameters, the performance of each intervention decays gradually at first, with most of those nonprotected individuals still benefiting from a degree of herd immunity. With sufficiently difficult parameters, each intervention eventually ceases to be able to contain the outbreak, resulting in most nonprotected individuals contracting the disease. More aggressive interventions are more robust to low cooperativity and high R0; for example, intervention 1 fails to contain the outbreak when cooperativity drops below 93%, while intervention 2 fails below 90%, 3 below 72%, 4 below 67%, and 5 below 64%, all using an R0 of 6.9.

Sensitivity Analysis for Cooperativity and R0 in Single-City Model. For (A), (C), and (E), cooperativity is allowed to vary from 0.10 to 1.0, while R0=6.9.


Sensitivity Analysis for Drug Effectiveness Parameters.
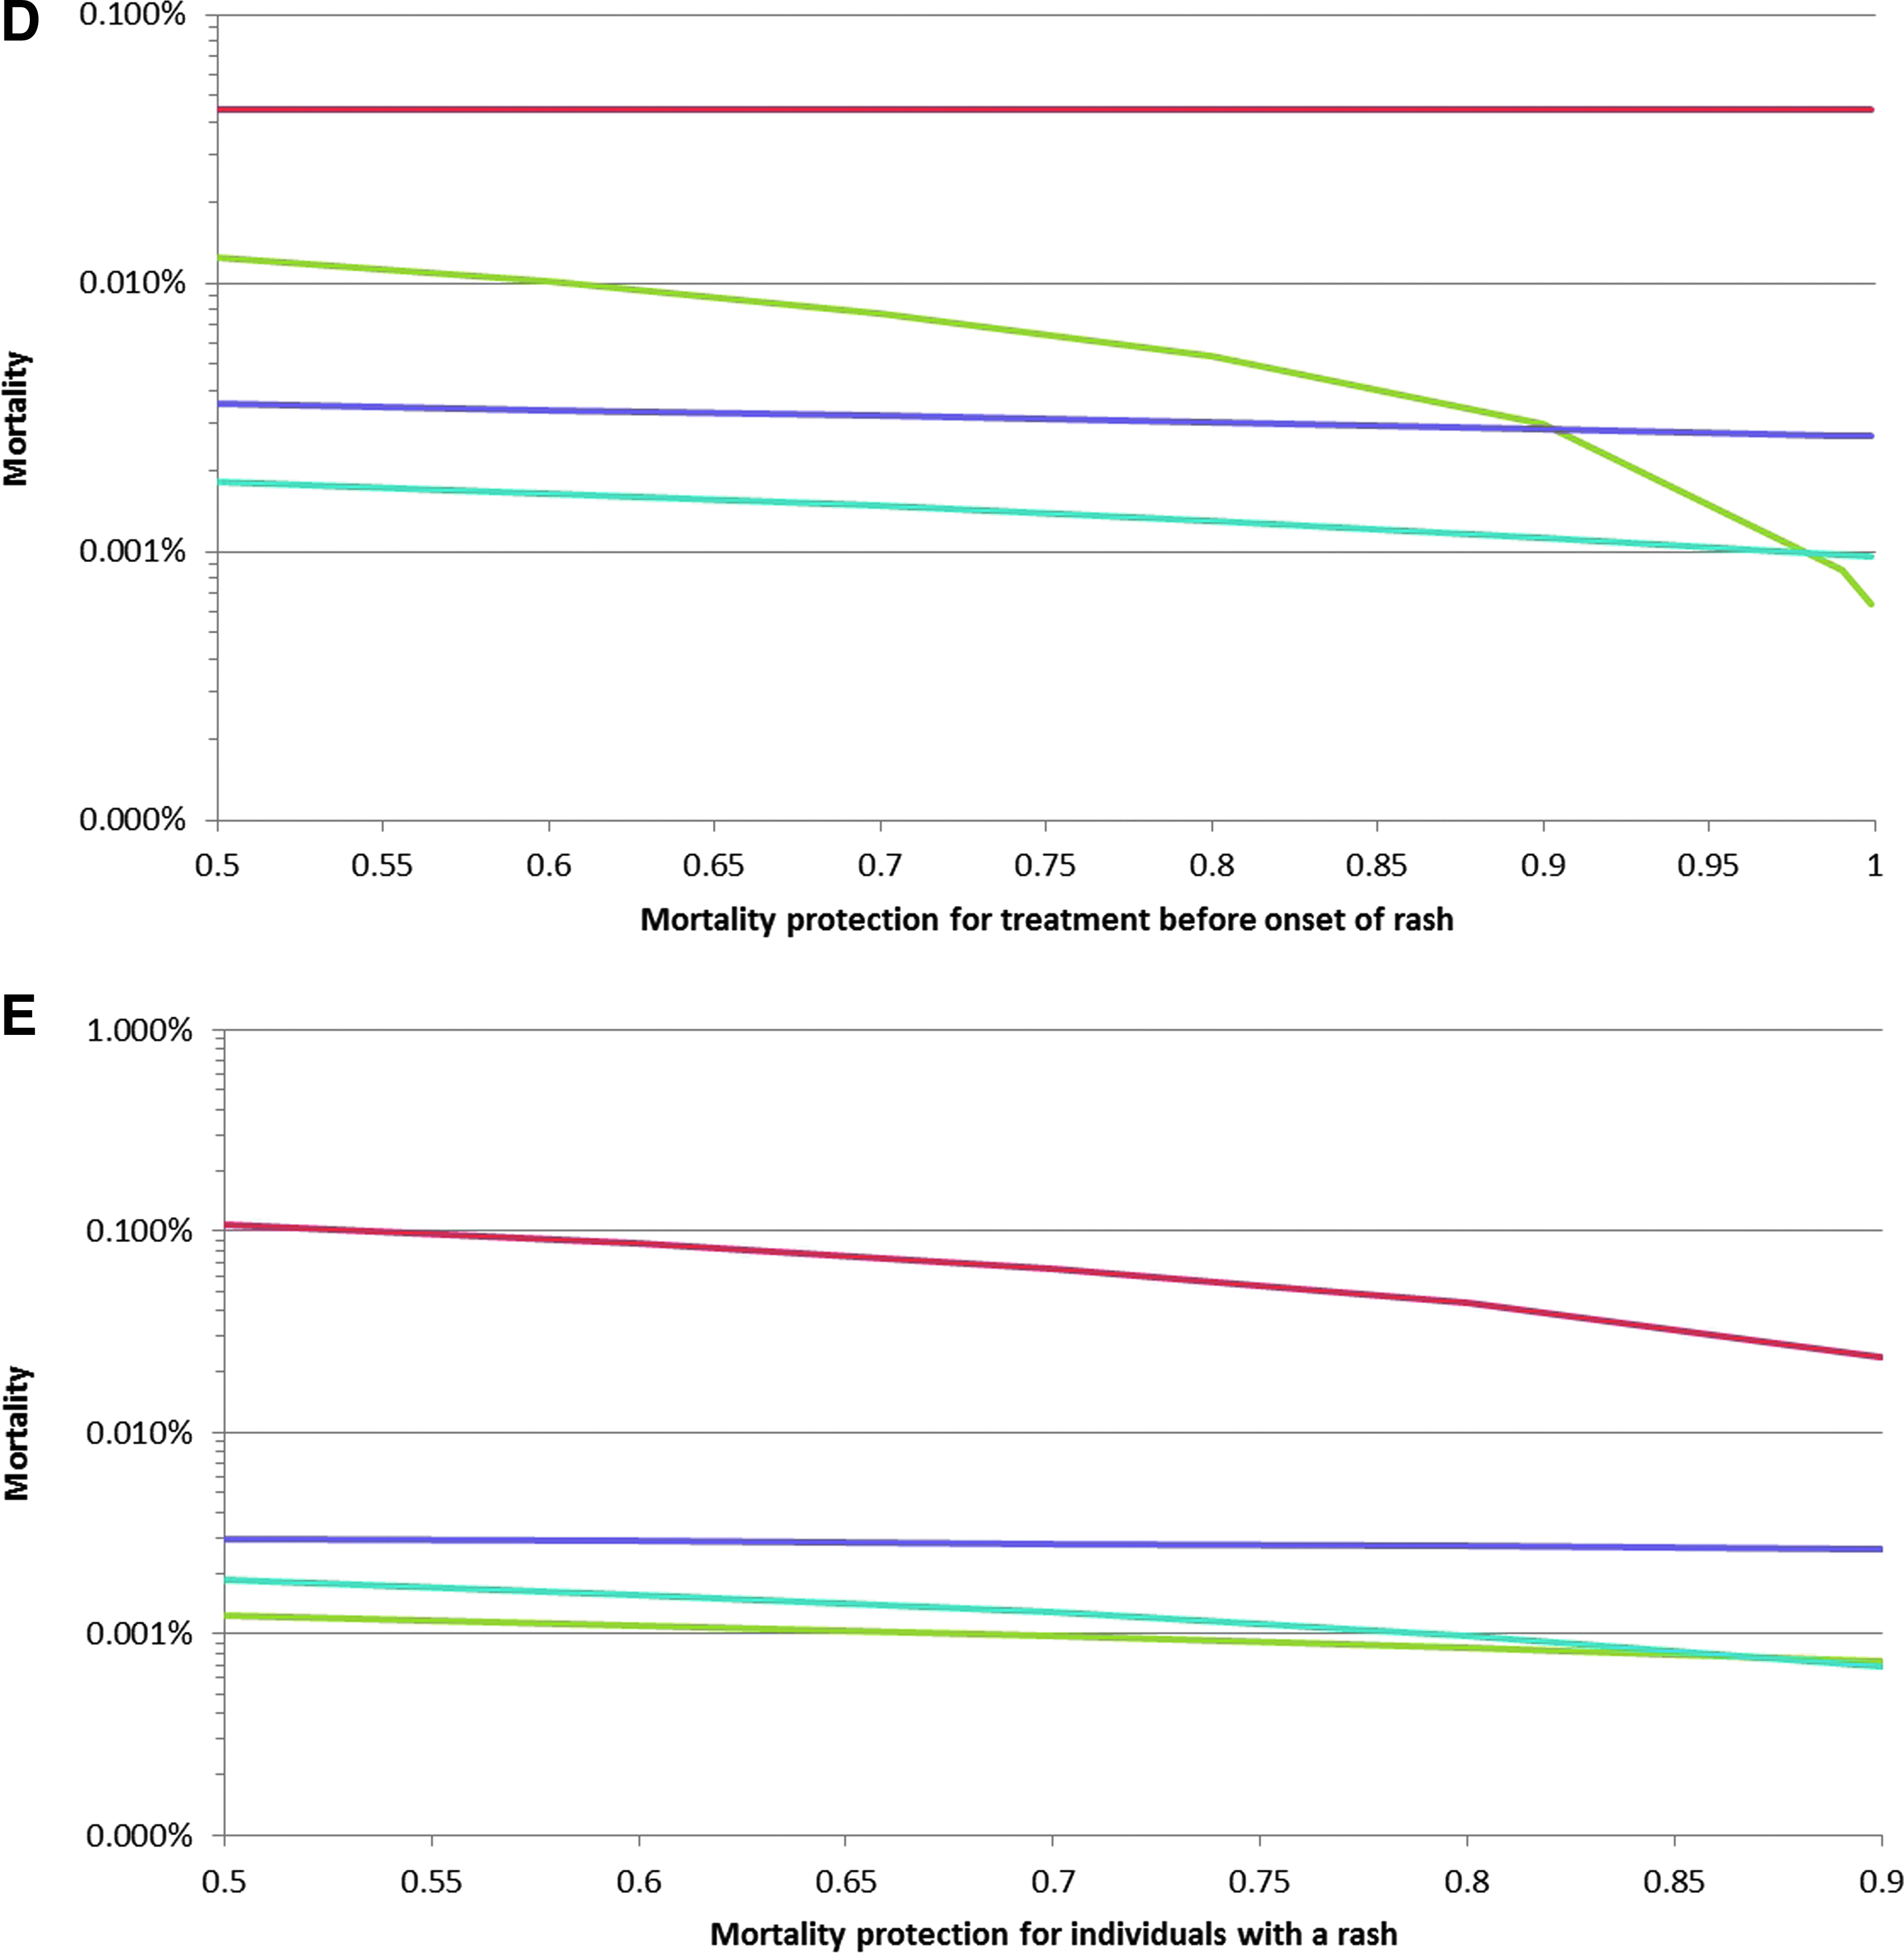
Figures 4(A), (B), and (C) vary the infectivity multiplier that captures the reduced viral shedding of individuals treated with the drug, while Figures 4(D) and (E) vary the reduction in mortality for infected individuals who begin drug treatment. Changing the infectivity multiplier has its largest effect on interventions 2 and 3, only a small effect on interventions 4 and 5, and, unsurprisingly, no effect on intervention 1. Changing the mortality reduction parameters has no effect on elimination time or morbidity. Changing the mortality reduction parameter for pre-rash treatment primarily affects intervention 3, with total mortality varying by about a factor of 20 between a protection of 50% and 99%. Interventions 4 and 5 are weakly sensitive to this change, and interventions 1 and 2 not at all. Changing the mortality reduction parameter for post-rash treatment unsurprisingly affects intervention 2 most strongly, with smaller effects on interventions 3 through 5.
We also set our parameters to mirror as closely as possible Kaplan and colleagues' model. 39 Changing our parameters cannot perfectly mimic Kaplan's exponentially distributed waiting times, which allow arbitrarily fast and slow disease progression. However, our model's results are in general agreement with Kaplan's. Figure 5 shows these results.

Results of Simulations Carried Out with Parameters Designed to Approximate Kaplan's Model. The incubation time is 4 to 18 days. All infections are spawned during the 3-day prodromal period, followed by 7 days of quarantined, and thus noninfectious, rash. The full population is immunocompetent. R0 is 3, vaccine is 100% effective, and cooperativity is 1. Figure 5(A) shows the time course of the total number of infected people following a 1,000-person attack on a 10,000,000-person metropolitan area. Mass vaccination begins on day 0, defined to be the day of the first appearance of a rash. Figure 5(B) shows the dependence of mortality on R0 under this scenario. These graphs are generally similar to Figures 7(a) and 7(b) in Kaplan's 2003 paper. 39
Multicity Model
An initial attack on 1 or 10 people will likely not spread to another city before it can be detected. An attack on 100 people will likely spread to several other cities, and larger attacks will almost certainly be widely spread by the time the first rashes develop. Figure 6 summarizes these data.

The Number of Cities Containing at Least 1 of the Inital Cohort of Infected Individuals at the Time when the First Rash Develops, as a Function of Attack Size. Figures shown are the average and standard deviation of 100 independent stochastic simulations.
Figure 7 shows the results of selected simulations of the multicity network. All numbers are the average of 7 independent runs. The standard deviations of this data are shown for number of cities infected and control time. Standard deviations of morbidity and mortality are too small to be shown on a log scale graph. The results are broadly similar to those of the single-city model. Initiating treatment at the fever stage substantially outperforms waiting until the rash stage. Particularly for medium and pessimistic parameter sets, interventions including mass chemoprophylaxis are able to control the outbreak substantially faster and with far fewer infections.

Selected Results of Multicity Simulation with Attack Size of 1,000 People in New York City. Results for interventions 1 through 5 are shown. Reported numbers are the average of 7 independent stochastic simulations. Error bars indicate the standard deviation of these values. Where error bars are not drawn, standard deviations are too small to show on this scale. Parameter sets are the same as in Figure 2. Figure 7(A) shows the number of days required for the intervention to eliminate the disease; interventions that do not control the spread of the disease are shown as infinite; interventions that have not eliminated the disease by the end of the simulation are reported as 1,095. Figure 7(B) shows morbidity and mortality as fractions of the populations. Morbidity is shown in light colors; mortality is shown in dark colors. The dotted horizontal line indicates the initial attack size. Figure 7(C) shows the number of cities that have been infected by day 1,095. The dotted line indicates the expected number of cities to already be infected when the first case of rash develops.
Discussion
We constructed a computer model of smallpox spread and mass responses for both a single metropolitan area and a network of metropolitan areas linked by commercial air traffic. The availability of an effective, easily distributable antiorthopoxvirus drug substantially improves the ability of public health measures to control a smallpox outbreak. Treating individuals as soon as they develop a fever is much more effective than waiting until they develop smallpox's distinctive rash. Incorporating mass chemoprophylaxis into the response represents an additional large improvement, enabling the control of the outbreak under even worst-case conditions. Because tecovirimat treatment appears to reduce viral shedding substantially, treatment of infectious individuals before their infectious peak is especially effective at reducing the spread of the disease and allowing it to come under control.
If smallpox control plans are expected to be able to respond to a bioterrorist attack on the scale of hundreds or thousands of initially infected people, authorities should plan for the simultaneous development of outbreaks in multiple cities.
The sensitivity of key outcomes to parameters is very important. Near the boundary between an effective and ineffective intervention, outcomes can be extremely sensitive to cooperativity: A single percentage difference in cooperativity can correspond to more than a tenfold difference in morbidity under interventions 1 and 2 (see Supplemental data). The locations of the boundaries depend on the values of other parameters and the intervention in question. For R0=6.9, morbidity under intervention 1 features the highest sensitivity to cooperativity when coop=0.92, under intervention 2 at a value of 0.89, and for interventions 3 through 5 below 0.70. Conversely, for a cooperativity of 0.90, morbidity under intervention 1 features the highest sensitivity to R0 when R0=6.0, under intervention 2 at a value of 7.2, and under interventions 3 through 5 above 10. In the face of considerable uncertainty regarding the basic reproductive number that could be expected of smallpox and the cooperativity that could be achieved in the public health response, it is highly attractive to have interventions that are not keenly sensitive to these parameters within reasonable expected ranges of values.
At the same time, the sometimes sharp dependence of outcomes on the cooperativity parameter emphasizes the need for the public to understand and comply with response plans. This was a clear lesson learned from the response of the public to the recent pandemic novel H1N1,40-42 during which the public was often slow and reluctant to follow public health advice.
Further modeling work would help to better prepare for an attack. In the simulations described here, the outbreak is detected only when symptomatic cases begin to develop. A bioterrorist attack might be detected by law enforcement at the time of the attack, allowing for a substantially earlier response. Models should explore the effect of these early responses. For early detections or low attack sizes, targeted or traced responses may compare favorably to the mass responses described here. Models exploring these scenarios should also be built.
Conflict of Interest
Dr. Kosaraju and Dr. Rose are employees of SIGA Technology, which owns the rights to tecovirimat. Mr. Finin and Dr. Rubin have received consulting fees from SIGA.
References
Supplementary Material
Please find the following supplemental material available below.
For Open Access articles published under a Creative Commons License, all supplemental material carries the same license as the article it is associated with.
For non-Open Access articles published, all supplemental material carries a non-exclusive license, and permission requests for re-use of supplemental material or any part of supplemental material shall be sent directly to the copyright owner as specified in the copyright notice associated with the article.