
Abstract
Computational models describing bacterial kinetics were developed for inhalational anthrax in New Zealand white (NZW) rabbits following inhalation of Ames strain B. anthracis. The data used to parameterize the models included bacterial numbers in the airways, lung tissue, draining lymph nodes, and blood. Initial bacterial numbers were deposited spore dose. The first model was a single exponential ordinary differential equation (ODE) with 3 rate parameters that described mucociliated (physical) clearance, immune clearance (bacterial killing), and bacterial growth. At 36 hours postexposure, the ODE model predicted 1.7×10⁷ bacteria in the rabbit, which agreed well with data from actual experiments (4.0×10⁷ bacteria at 36 hours). Next, building on the single ODE model, a physiological-based biokinetic (PBBK) compartmentalized model was developed in which 1 physiological compartment was the lumen of the airways and the other was the rabbit body (lung tissue, lymph nodes, blood). The 2 compartments were connected with a parameter describing transport of bacteria from the airways into the body. The PBBK model predicted 4.9×10⁷ bacteria in the body at 36 hours, and by 45 hours the model showed all clearance mechanisms were saturated, suggesting the rabbit would quickly succumb to the infection. As with the ODE model, the PBBK model results agreed well with laboratory observations. These data are discussed along with the need for and potential application of the models in risk assessment, drug development, and as a general aid to the experimentalist studying inhalational anthrax.
Computational models describing bacterial kinetics were developed for inhalational anthrax in New Zealand white (NZW) rabbits following inhalation of Ames strain B. anthracis. The data used to parameterize the models included bacterial numbers in the airways, lung tissue, draining lymph nodes, and blood. These data are discussed along with the need for and potential application of the models in risk assessment, drug development, and as a general aid to the experimentalist studying inhalational anthrax.
I
For these reasons, the aim of the current work was to develop a computational model of inhalational anthrax specific for the rabbit, which is an animal model that has been used extensively to study inhalational anthrax.20-23 Although there are some theoretical inhalational anthrax models in the literature (discussed below), the work presented here represents the first attempt at coupling novel data collection and computational model development that is specific for a laboratory animal. If successful, such models could be used to help address many aspects of inhalational anthrax disease, and, importantly, the model could be rigorously evaluated and advanced by collecting data from additional rabbit exposures. If the rabbit inhalational anthrax computational model becomes robust enough to capture key host-pathogen interactions and disease outcome in the rabbit, then the model could be modified (ie, re-parameterized) for man and could greatly aid in our understanding of the disease in humans.
Because inhalational anthrax requires spore deposition in the lung and both quantity and location of lung deposition are specific for a given animal,24-28 the first step in developing any computational model specific for a given host is to consider deposition. For host-pathogen interactions following deposition, it is useful to view the lungs in 2 parts: the lower alveolar region and the upper conducting airway region (trachea and bronchia). In the alveolar region, it is generally accepted that phagocytic immune cells interact with spores and initiate a sequence of host-pathogen events that lead to either bacterial removal (host survival) or bacterial growth (disease).1,2,4,29-30 These events are referred to as the Trojan Horse model, because after phagocytosis immune cells can migrate across the lung lining and transport spores into the body. 31 Spores germinate inside the immune cell at some point following phagocytosis. Once germinated, vegetative bacterial cells could be killed or they could escape, replicate, and cause disease. Although the Trojan Horse model is generally accepted, the fraction of deposited spores that germinate, the time of germination, and the fraction of newly germinated spores that are killed, or escape and replicate, are all unknown. Spores can also be deposited in the tracheal-bronchial lung region.
Detection of B. anthracis in the draining tracheal-bronchial lymph nodes (TBLNs), prior to detection in the circulation or other tissues, has been a long-standing hallmark of inhalational anthrax in guinea pigs,32,33 nonhuman primates (NHP),34-36 rabbits,20,23 and possibly humans as well.37-39 The primary mechanism of spore clearance from this region is through ciliated epithelial cells that beat and propel material up the airways to be expelled. This mechanism is generally referred to as mucociliated clearance, and as much as 70% of lung spores can be cleared through this mechanism. 26 However, it is possible that some unknown fraction of spores in this region will not be cleared and will contribute to disease. The mechanisms are not well understood, but some have recently suggested a “jailbreak” model of infection may be responsible.40,41 Here, spores germinate on the epithelial cell surface and secrete toxins that disrupt epithelial cell function. In doing so, bacteria gain entrance to the lung tissue and are transported to the draining TBLNs and blood through bulk lymph flow.
To date, several types of computational models have been developed to study inhalational anthrax. One type are stochastic models aimed at fitting dose-response data.42-49 The models are derived from probability theory and are used to describe the response of populations, not individuals. Although useful, these models are limited because they fit observable animal lethality data, and the equivalent data for humans do not exist. In addition, these models provide limited information on disease mechanisms. Extrapolating model results to humans involves numerous assumptions. Another type of stochastic model is the competing risks model of inhalational anthrax.42,50-53 Here, spore clearance and germination probabilities are estimated and used to model dose-response, disease incubation period, and medical intervention strategies.54-57 Again, although useful, it is unlikely that germination and clearance data will ever be collected directly from humans, and so these models also require numerous assumptions when extrapolating to humans.
In contrast to stochastic models, a limited number of deterministic models have been developed for inhalational anthrax.49,58,59 In this work, deterministic models are differential equations that have no randomness. Deterministic modeling has the advantage of potentially capturing and quantifying key host-specific biological mechanisms, which could clearly aid in extrapolating animal data to humans. 60 However, deterministic models also have disadvantages. They typically require more data and are often more complex mathematically. Some deterministic models are so complex they aim to provide a qualitative description of disease, and, in addition, many of the model parameters have no basis in actual data.58,59 Furthermore, all deterministic models developed to date (to our knowledge) are theoretical models of human anthrax, and as a result they cannot be rigorously tested. For these reasons, the objective of the current work was to begin to develop a deterministic laboratory animal model of inhalational anthrax. The approach used here was a “bottom-up” approach focusing on what data could actually be collected and used rather than trying to account for every potential biological mechanism. As a result, the models are far less complex than previous work,58,59 but, if successful, the models could be advanced in future work.
The work presented here is an example of this type of bottom-up approach in which the first model was a simple exponential model with 3 parameters, and, building off that model, a second model was developed that was slightly more advanced (a physiologically based 2D linear system). Physiologically based models can offer several advantages to investigators studying disease progression, including the ability to model/study where events happen in the host (because the models take into account host physiology) as well as when key host pathogen interactions can occur because these models are also kinetic models. For example, spore germination is a key step in pathogenesis that is not well understood but could be studied using physiologically based kinetic models.
The aim of the current work was to develop deterministic models of inhalational anthrax specific for the rabbit. The exposure methods and preliminary data have been published,20,42 as has the preliminary concept of the model. 60
Material and Methods
Detailed animal use protocols, exposure methods, and data collection methods for this work have been published.20,42 This information is summarized below.
Rabbits and B. anthracis
In conducting this research, investigators adhered to the Guide for the Care and Use of Laboratory Animals (NIH publication 86-23). Male certified Pasteurella-free NZW rabbits weighed 2-4 kg. Ames strain bacteria were grown in TSB supplemented with manganese sulfate for approximately 96 hours. Thereafter, spores were washed by centrifugation, resuspended in sterile phosphate-buffered saline (PBS), and stored at 4-6°C.
Anthrax Vaccine Adsorbed (AVA) Vaccination
All rabbits were vaccinated intramuscular (IM) with the human anthrax vaccine or were sham-vaccinated. The vaccination protocol used provided 100% protection against a lethal dose of Ames spores.61,62 Sham-vaccinated rabbits received vehicle injections (IM) and were considered naïve. As discussed in our previous publications, AVA was 100% protective in the current work.20,42
Bioaerosol Challenge
Spores were aerosolized in PBS plus 0.01% Triton-X using a 3-jet collison nebulizer. The spore mean mass aerodynamic diameter (MMAD) was estimated at 1.0±0.3 μm. Dose was measured using all glass impingers and a plethysmography system.
Data Collection Postexposure
All rabbits received a lethal dose of spores. Thereafter, rabbits were sacrificed at predetermined time points, 0-36 hours. At 36 hours, 2 of 10 naïve rabbits had succumbed. Without delay following sacrifice, bacteria were quantified in the airways, lung tissue, TBLN, and blood. All quantification used dilution plate analysis from nonheated samples. All samples were kept on ice during processing. To maximize the data collection and minimize animal numbers, the right lung was processed differently from the left lung. The right 3 lobes were clamped and the left 3 lobes were washed (lavaged). Lavage fluid was collected, sonicated, and quantified. Thereafter, the right (nonwashed) and left (washed) middle lung lobe were homogenized, plated, and quantified based on tissue weight. The intent was to collect data to estimate the rate of bacterial uptake into the lung tissue where left lung data represented bacteria in lung tissue only and right lung data represented bacteria in the lung tissue plus bacteria in the lumen (airways). TBLNs were collected, homogenized, and plated. Aliquots of whole blood were plated and the bacterial numbers were adjusted to account for the entire blood volume (≈56 ml kg−1).
Unless otherwise noted, all models, data, and plots were developed, analyzed, and presented using Mathematica, Version 8 (Wolfram Research, Champaign, IL).
Models and Results
The exponential model-single ordinary differential equation (ODE):
Inspired by previous work,
63
Eq. 1 describes bacterial numbers during a lung infection
where Bt is the number of bacteria at time t; B0 is the initial bacterial number; kmc is mucocilliary clearance; kk is immune-mediated killing; and kg is bacterial growth. The initial aim of the current work was to estimate these parameters and determine if Eq. 1 described the disease kinetics observed in the rabbit.
Estimation of the Initial Number of Bacteria, B0
To our knowledge, there are no published data available for spore deposition in the rabbit lung. For this reason, deposition was estimated using a combination of particle deposition data and deposition software. B. anthracis spores have an MMAD of approximately 1 μm. 29 And since deposition is driven in large part by the physical characteristic of the particle, deposition for spore particles can be estimated using data from any rabbit particle deposition study or by using particle deposition software. Given this, spore deposition was estimated using information from a publication 28 and predictions made using Regional Deposited Dose Ratio (RDDR) software.
The objective of Raabe et al 28 was to determine the deposition in several animals, including rabbits. Their work used particles of known sizes (0.18-8.65 μm), but only particles approximating the size of a single spore were used herein (0.97-1.09 μm, which had an average size of 1.03 μm). Their deposition data are shown in Table 1. Pulmonary deposition ranged from 4.0-6.6% (which averaged to 5.13%), with bronchial and tracheal regions estimated at 3.31% and 0.25%, respectively. When these averages were summed, the data suggested 8.7% of the inhaled particle dose was deposited in the rabbit trachea, bronchia, and alveoli.
Regional Percent Deposition of Monodisperse 169Yb Aluminosilicate Aerosol Particles in New Zealand White Rabbits (data from ref. 28)
A second estimate of deposition was obtained using RDDR (Version 2.3) software that was developed by the Environmental Protection Agency using the Raabe et al 28 data. The software is designed to predict regional deposition in several species, including rabbits. Here, the following parameter values were used as model input: 1.0 μm MMAD; 1.30 μm GSD (geometric standard deviation, the default value for monodisperse particles); 3 kg rabbit weight, with all other parameters set to default values (see Table 2). RDDR predicted 4.4% and 5.3% (9.7% total) of the inhaled dose would be deposited in the tracheobronchial (TB) and pulmonary (PUL) regions, respectively (Table 2).
Regional Lung Deposition in New Zealand White Rabbits Calculated Using Regional Deposited Dose Ratio (RDDR) Software (Version 2.3)
RDDR default value if the aerosol is assumed to be monodispersed
RDDR default value for given body weight
Averaging the Raabe et al 28 data (8.7%) and the RDDR prediction (9.7%), it was estimated that 9.2% of the inhaled B. anthracis spore dose would be deposited in the rabbit lung: B0=0.092*inhaled dose.
Estimation of Mucociliated Clearance, kmc
Physical clearance, kmc, was estimated by quantifying the decrease in bacteria over time in the airways (ie, lavage samples) of nonvaccinated rabbits using a least-squares fit of the natural logarithms of the fraction of bacteria remaining.42,52 The data are summarized in Table 3 (where exposure 2 had 2 separate 24-hour groups and 2 separate 36-hour groups). kmc was estimated at 0.0628 hr−1 using the entire pooled data set (Figure 1). To provide an estimate of variability, the clearance rate was 0.0694 hr−1 or 0.0550 hr−1 using only exposure 1 or only exposure 2 data, respectively.
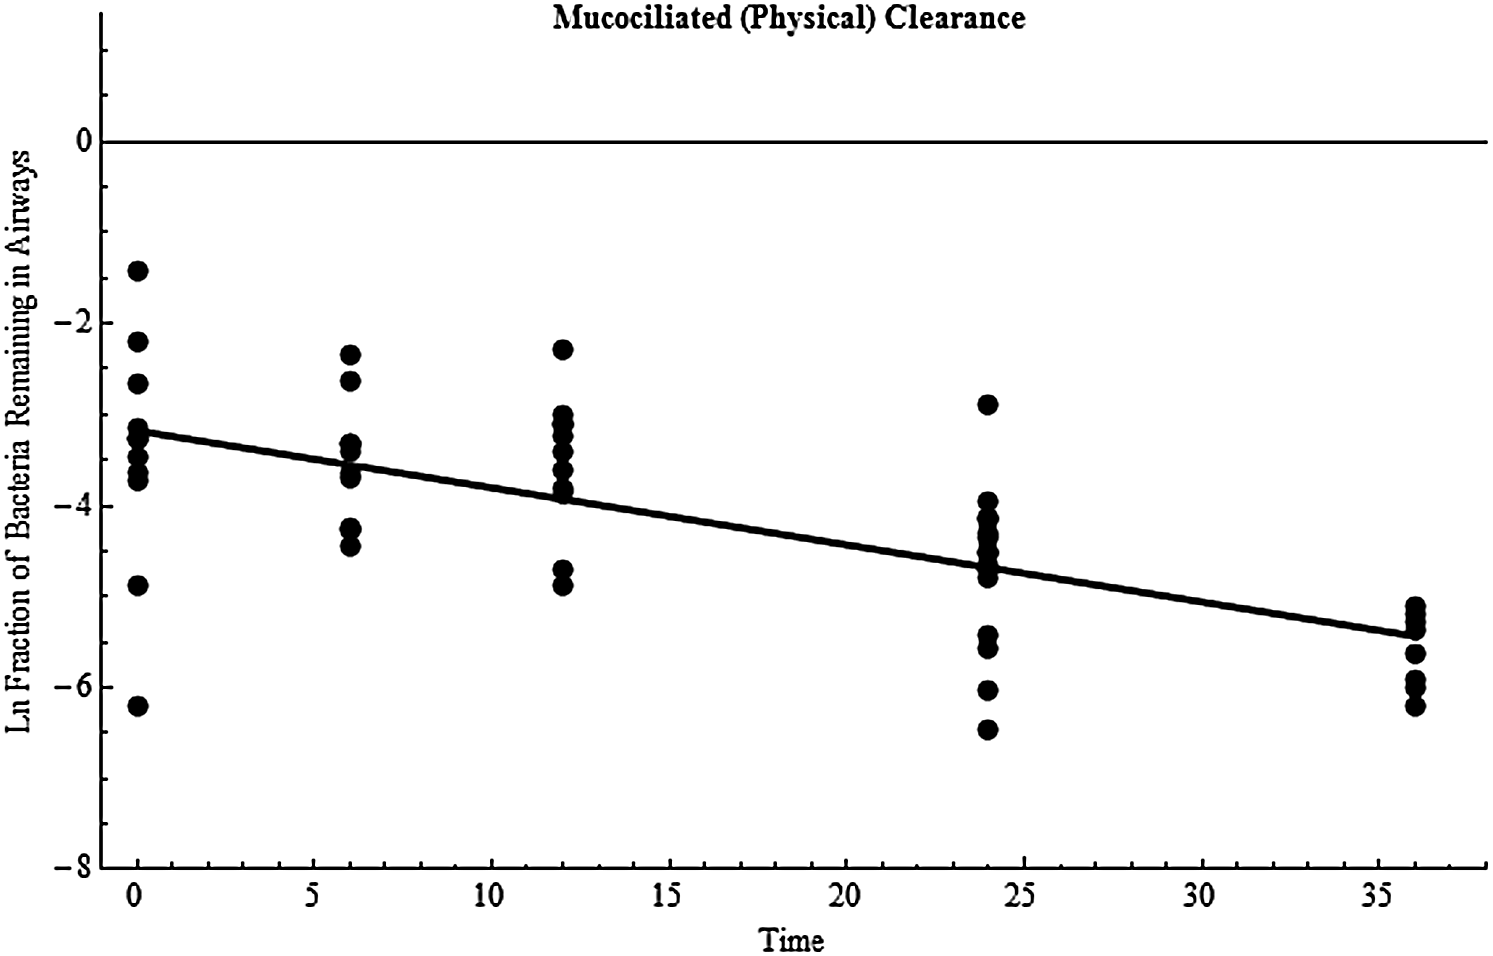
Mucociliated (physical) clearance of B. anthracis bacteria from the airways. Data points are the natural log of the fraction of bacteria remaining in the airways over time (hours) for an individual rabbit, and the line is the least squares best fit estimate (slope=−0.0628 hr−1).
Inhaled Dose, Deposited Dose, and the Number of Bacteria in the Airways 0-36 Hours Postexposure in Rabbits Exposed to B. anthracis aerosols a
All data are mean±standard deviation; all rabbits were nonvaccinated.
By 36 hours, 2 of 5 rabbits on study had succumbed to the infection.
Deposited dose=inhaled dose*0.092.
Estimation of Immune Killing, kk
Immune-mediated killing was estimated using data collected from vaccinated rabbits. Vaccination is 100% protective in rabbits, and bacteria do not grow in vaccinated rabbits (see also Tables 4 and 5).20,62 It is assumed that kg=0 in these animals. As a result, Eq. 1 only contains kk and kmc, and the challenge experimentally was to collect data that allow differentiation between these 2 clearance mechanisms. The most straightforward way was to collect data from vaccinated rabbits under experimental conditions where kmc was, in effect, also equal to zero. This was accomplished by collecting lung data from rabbits whose airways had been lavaged. Under these conditions, any bacteria remaining in the lung post-lavage would most likely reside in the lung tissue (and not the lung lumen), and as a result these bacteria could not be cleared by the mucociliated mechanism (kmc is in effect equal to 0) and therefore must be cleared by the immune system. It is noted, as discussed in previous publications, that lavage probably failed to remove 100% of the luminal spores.20,42 However, the analysis here is most likely not affected by this inefficiency because these time course data are used to estimate a slope (as shown in Figure 2). As an example, if lavage only removed half the luminal spores, then the true number of spores used in Figure 2 would need to be doubled. But multiplying all the data by 2 (a transformation) has no effect on the slope. As a result, Eq. 1 reduces to
Biological (immune-mediated) clearance of B. anthracis bacteria. Data points are the natural log of the fraction of bacteria remaining in the animal body over time (hours) for an individual rabbit, and the line is the least squares best fit estimate (slope=−0.0431 hr−1).
Deposited Dose and the Number of Bacteria in the Washed Lung Tissue, TBLN, and Blood 0-36 Hours Postexposure in AVA-Vaccinated Rabbits a
All data are mean±standard deviation.
Comparison of the Number of Bacteria in the Whole Rabbit 0-36 Hours Postexposure in Nonvaccinated and AVA-Vaccinated Rabbits Exposed to B. anthracis Spore Aerosols a
All data are mean±standard deviation.
Data represent the sum of bacterial numbers in airways, lung tissue, TBLN, and blood.
Bacterial numbers were quantified in vaccinated rabbit lavaged lung tissue, TBLNs, and blood. The data were summed for each individual rabbit, and the immune-killing rate was estimated using the same regression method described above for mucociliary clearance. The data are shown in Table 4 and the best fit plot in Figure 2. As shown, all data were from exposure 2, which had 2 separate 24-hour and 2 separate 36-hour groups of rabbits (note: TBLN data were not collected during exposure 1, so these data were not available for use in this part of the analysis). The rate of kk was estimated at 0.0431 hr−1 when all data were used. To help estimate variability, the analysis was run using the 0-, 6-, 12-, 24- (set 1), and 36-hour (set 1) data where kk was 0.0291 hr−1. When using the 0-, 6-, 12-, 24- (set 2), and 36- (set 2) hour data, kk was 0.0590 hr−1.
Estimation of Bacterial Growth Rate, kg
Because kg=0 in vaccinated rabbits, Eq. 1 reduced to
where BAVA, is the number of bacteria at time t in vaccinated rabbits, and
where
All parameter values are summarized in Table 6. For the initial model run, the inhaled dose was 6.9×10⁷ spores, which was the average inhaled dose for rabbits sacrificed at 36 hours (see Table 3). Here, Eq. 1 predicted 1.9×10⁸ bacteria in the animal 36 hours postinfection, which is an order of magnitude higher than what was observed (Table 5). However, under these conditions bacterial growth began immediately and did not account for the lag phase. To account for lag, kg is
Summary of Model Parameters
The best estimate of lag time based on data was 12 hours (Table 5), and when this was considered, the model predicted 1.7×10⁷ bacteria at 36 hours, which is in excellent agreement with observations (4.0×10⁷ bacteria at 36 hours, see Table 5). It is noted that when lag phase time is 7.70 hours, Eq. 1 predicts exactly 4.0×10⁷ bacteria at 36 hours postinfection.
The PBBK Model
Building off the results above, a physiological-based biokinetic compartmentalized (PBBK) model was developed that consisted of 2 physiological compartments (Figure 3): the airways (lung lumen) and the body (lung tissue, TBLNs, and blood). As shown, deposited bacteria are removed by mucociliated clearance, kmc, or transported across the lung into the body, ktran. It is noted that uptake does not represent a specific mechanism of uptake (ie, Trojan Horse versus jailbreak). Once in the body, bacteria can grow, kg, or be killed, kk, by the immune system. Finally, bacteria could be transported back into the airways, krev, but this is generally observed only during the late stages of disease (see below). B0, kmc, kk, and kg have been determined (see above). The remaining 2 parameters were estimated as described below.
Schematic of the 2-compartment rabbit PBBK inhalational anthrax model
Estimation of Bacterial Transport Across Lung Epithelium, ktran
The rate of spore uptake was estimated by quantifying the increase in bacteria in the lung tissue (lavaged lung homogenate) in nonvaccinated rabbits. Here, the 0-, 6-, and 12-hour data, and not the 24- or 36-hour data, were used. The primary reasons for excluding later time points was because clear signs of bacterial growth were observed at 24 and 36 hours (Table 5), and the increase in bacteria at these time points could be from replication in the lung or reseeding the lung from the circulation. The 0-12-hour data (shown in Table 7) were regressed using a linear fit model, and results suggested bacteria were transported across the lung epithelium at 6.7×10³ bacteria hr−1. When divided by the average number of bacteria deposited in the lung for the rabbits used to collect these data (6.2×10⁵ deposited bacteria, 18 rabbits), ktran was estimated at 0.0107 hr−1.
Summary of Data Used to Estimate Bacterial Transport from the Airways into the Body, ktran
Lungs were washed prior to bacterial enumeration to remove bacteria in the airways.
Estimation of Bacterial Transport from Lung Tissue to Airways, krev
Movement of bacteria from lung tissue back into the conducting airways is not thought to occur except toward the later stages of disease when the lungs are leaking and there is an overwhelming number of bacteria in the blood. The number of bacteria in the blood at the time of death is as high as 1012 per ml of blood, and there is significant lung hemorrhage in rabbits at the time of death (see Discussion). As a result, krev was set at 0.0001 hr−1.
Now that all of the parameters have been estimated (summarized in Table 6), the following system can be analyzed:
where a is the airway compartment and b is the body compartment. In matrix form, this system is governed by:
The eigenvalues for matrix A are {0.1487, −0.0735} with the following eigenvectors: {−0.000045, −1} and {−0.9988, 0.0480}. Trajectories will not oscillate, which is in line with disease kinetics for inhalational anthrax where there is no chronic or recurring disease. However, because 1 eigenvalue is positive and 1 is negative, the trajectory will head toward the origin prior to going to infinity. A biological interpretation of this would be that immediately following exposure the total number of bacteria will initially decrease, presumably because physical clearance begins immediately whereas bacterial growth has a lag period, but eventually bacterial growth will overcome clearance and total bacterial numbers will monotonically increase to infinity (Figure 4), which also makes sense conceptually because the data were collected from rabbits that received a 100% lethal dose. The next step was to compare model predictions and data during the course of disease (Table 8). As shown, the model predicted 6.5×10⁷ bacteria at 36 hours, which agreed well with actual experimental data (4.0×10⁷ bacteria). There was also good agreement with the other time points.
Trajectories from the 2D PBBK model. 4A and 4C are trajectories in the airways. 4B is the body compartment trajectory. The black circle is the bacterial starter value (ie, the deposited dose of bacterial spores).
Comparison of Experimental Data and 2D PBBK Model Results at All Time Points for Which Data Were Collected
On a final note, the model shows bacteria numbers decreasing in the airways through 36 hours, and then shortly thereafter they increase (see Figure 4C). By setting the first derivative of the solution to a(t) in Eq. 5 equal to 0 and solving, the model suggested bacteria stop decreasing and start increasing in the airways 45 hours following exposure. An interpretation of this model result would be to suggest that at 45 hours all clearance mechanisms become saturated, in which case bacterial accumulation increases sharply at 45 hours. This observation is relevant for inhalational anthrax because a hallmark of the disease in all animal models, and even humans, is an extremely rapid progression from a clinically normal state to death. It can occur within a few hours in all animal models of disease, and the speed of disease progression once a threshold number of bacteria is reached in the body is faster in rabbits than any other animal model. 23 The model suggests the animal will succumb to the infection very quickly beyond 45 hours, and it is noted that the mean time to death for NZW rabbits exposed to lethal doses of Ames spores is 46.9 hours. 22
In summary, an exponential ODE model and a 2D PBBK model were developed. Both models agreed well with the laboratory data. The data and model results are summarized in Figure 5. Figure 5A shows the experimental data for nonvaccinated rabbits exposed to lethal doses of spores (black circles) with the exponential ODE model results when a 12-hour lag phase was used (dashed line) along with the 2D PBBK model results (solid line). Figure 5B shows the same PBBK model results overlaid with the exponential ODE model results when the lag phase was set to 7.7 hours.
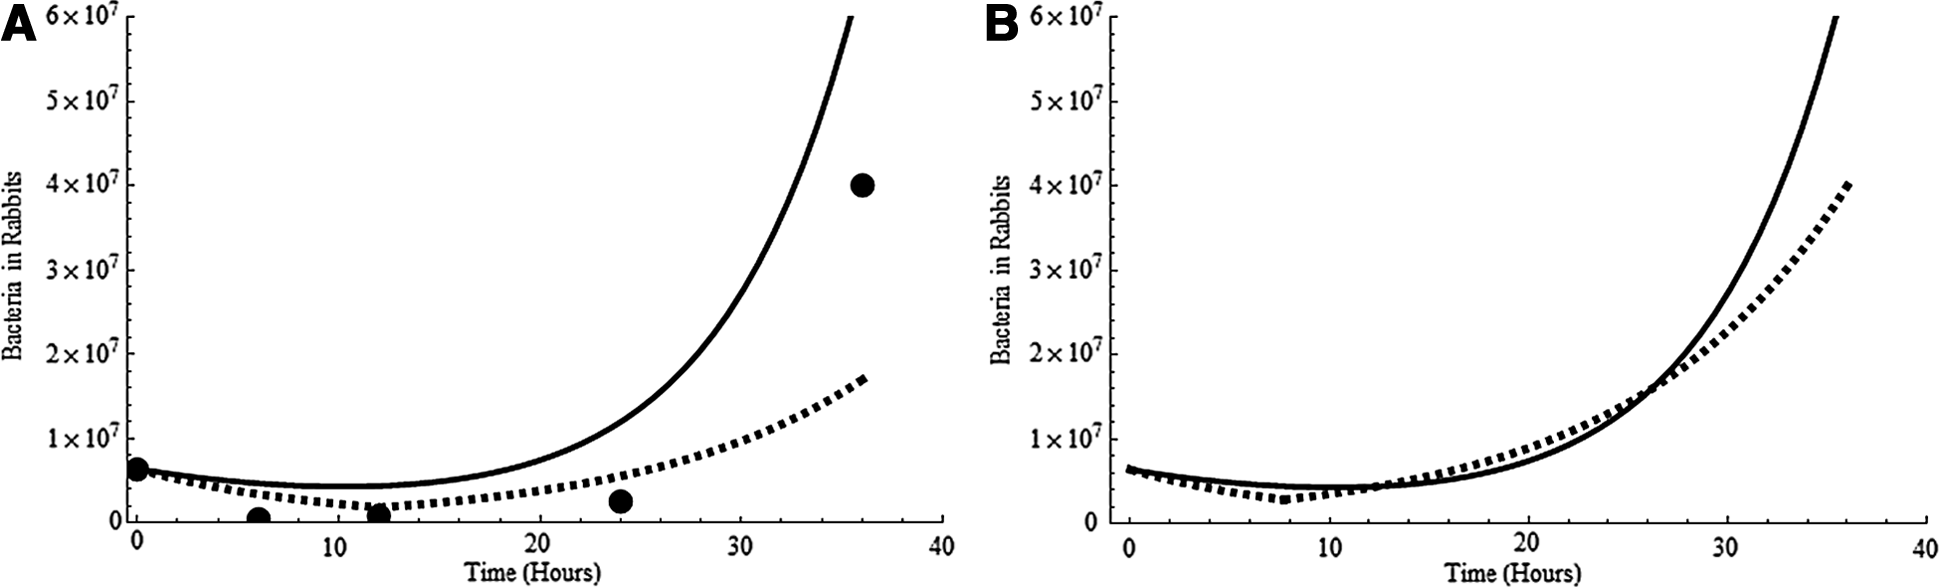
Summary of bacteremia for rabbit inhalational anthrax. 5A shows experimental data (circles), results from the exponential ODE model when lag phase time was set to 12 hours (dashed line), and results from the 2D PBBK model (solid line). 5B shows the same model result from the 2D PBBK model (solid line) and model results when the exponential ODE model was run using a 7.7-hour lag phase time.
Discussion
Since deposition is required for disease and the quantity of spores deposited is species-specific,24-26 quantifying rabbit deposition was a critical first step. This could be especially important for risk assessment where biologically relevant doses (deposited dose) are preferred rather than administered doses (inhaled dose). 64 Rabbit lung deposition was estimated at 9.2%. To our knowledge, there are no B. anthracis data available for comparison. However, 1 study estimated 4.63% of Ames spores were deposited in the rabbit right middle lobe. 20 In that work, the authors cut a portion of the right middle lobe for analysis, and the data therefore do not include trachea or larger bronchial airway deposition information. That data (4.63% deposition) is more reflective of deposition only in the pulmonary region. Given this, the Raabe et al 28 rabbit data showed 4.0-6.6% pulmonary deposition (Table 1) and RDDR predicted 5.3% pulmonary deposition (Table 2), which is in excellent agreement with the spore deposition data of 4.63%. 20 This adds confidence to the 9.2% deposition estimate for the entire lung.
It made biological sense that the mucociliated clearance rate was faster than immune killing because mucociliated clearance of Bacillus spores is thought to be rapid (as much as 2 cm/min), and as much as 70% of spores are thought to be cleared through this mechanism in a very short time period. 26 In contrast, immune killing is a complex biological process that requires time for phagocytosis and possibly germination/outgrowth.65-67 However, the model prediction of 1.7×10⁷ bacteria at 36 hours (which was slightly lower than actual observations) assumed immune killing began immediately following exposure. If a delay in bacterial killing were introduced into the model, the net effect would be higher bacterial numbers at 36 hours. This delay was not introduced because it is not known how long it takes the rabbit immune system to kill a spore and what exact mechanisms are involved, but future work could use the models to help derive hypotheses on these events. Also, there is additional uncertainty in the immune killing rate because the parameter was estimated using vaccinated rabbits, and this rate may be higher than that from naïve rabbits. For example, anti-protective antigen (anti-PA) antibody is present in vaccinated rabbits, and studies have shown that anti-PA can opsonize spores and promote phagocytosis, germination, and bacterial killing.62,65,68-70 For this reason, the immune killing rate estimated in the current work could be viewed as a maximal killing rate.
Bacterial growth (0.1996 hr−1) was estimated using data from nonvaccinated and vaccinated rabbits, which suggested a bacterial doubling time of 5.01 hr. This agrees well with the bacterial doubling time obtained when only nonvaccinated rabbits were examined and only vegetative bacteria data were considered: 4.41 hr. 42 Because the growth rate is faster than the combined clearance rates, bacteria will increase to infinity regardless of the exposure dose. These results make biological sense considering all animals used in this work received a 100% lethal spore dose. 23 However, the results may not be useful for analyzing dose-response because in the models bacterial numbers will go to infinity regardless of the starter dose, whereas observations in rabbits suggest they can be exposed to thousands of inhaled spores with no observed lethality. 12 One potential way to start addressing dose-response using the models could be to sample parameter distributions, rather than defining specific parameter values, and then randomly sampling from those distributions during a model run. In doing so, it is possible the sum of both clearance mechanisms will be larger than bacterial growth for a particular model run, in which case bacterial numbers would go to zero with time (suggesting the animal survived the exposure). Repeating this process many times would produce a stochastic survival response rate as a function of the dose, which may be informative on dose-response. Because of this potential application, estimates of variance for all 3 parameters, as well as the inhaled dose estimates, were provided in the model/results section of this article. Our preliminary analysis (1,000 runs where parameter values were randomly sampled from the defined distributions for a given run) showed growth exceeded clearance 74% of the time, suggesting approximately one quarter of the exposed rabbits would survive the given doses. Whether or not this type of analysis can be advanced and used to assess dose-response remains to be determined but is currently being examined.
Another potential way to address dose-response using the exponential model could be to argue that even though Eq. 1 is deterministic and therefore bacterial numbers go to infinity regardless of dose, the time required to reach high threshold numbers of bacteria is clearly affected by the initial dose, with lower exposure doses associated with long time periods. For example, according to the model a deposited dose of 1 spore yields 735 or 6,966 bacteria 4 or 5 days postexposure, respectively. In this context, it is possible that a rabbit could contain the low-level infection long enough to allow its acquired immune system to become fully activated, which could lead to survival. This concept is supported by previous work that noted that if mice, guinea pigs, or rabbits survived at least 7 days following inhalation of a lethal dose of spores, they apparently survived indefinitely. 71
Germination and outgrowth are required for disease, but where and when these processes occur remains one of the least understood and most debated aspects of inhalational anthrax.2,29,40 As with all animals, germination in rabbits is not well understood.20,42 Given this, one of the main applications of kinetic models could be to help inform investigators on the time of germination. For example, the exponential model predicted 1.9×10⁸ bacteria at 36 hours, which was too high if germination and outgrowth occurred immediately. When bacterial growth was turned on at 12 hours, the model predicted 1.7×10⁷ bacteria at 36 hours, which compared well to actual data. When growth was set at 7.7 hours, the model predicted exactly 4.0×10⁷ bacteria at 36 hours. Although the exponential model predictions are biologically plausible and potentially informative on disease kinetics, the model does not directly address where germination is occurring. One approach to addressing spatial events is to view the animal as a series of physiological compartments. This type of computational approach, referred to herein as PBBK modeling, is based on pharmacokinetic modeling that is widely used to aid in quantitative risk assessment for chemicals and could be adapted and used for inhalational anthrax.60,72,73
In the PBBK model, bacterial kinetics were driven primarily by physical location rather than by time. Once transported into the body (ktran), bacteria could immediately replicate or be killed according to kg or kk and were no longer available for mucociliated clearance. Transport from the body back into the conducting airways was generally considered nonexistent except toward the end stage of disease when the lungs become leaky and flooding of the alveolar spaces occurs with pulmonary hemorrhage, which allows bacteria to flow back into the airways.23,34,74 When run using the same deposited dose as for the exponential model, the PBBK model predicted 6.49×10⁷ bacteria in the body at 36 hours, which agreed well with actual data but was slightly higher. One plausible explanation for the higher model predictions is that the model was developed using blood, TBLNs, and lung tissue data, and it is known that by 36 hours circulating bacteria are seeding other tissue, such as the spleen, kidneys, and bone marrow (which reduces the number detected in the animals). 23 Another interesting observation is that the PBBK model predicted the number of bacteria in the airways would be at their lowest value 45.1 hours following exposure and thereafter bacteria would rapidly increase in the airways and the body, suggesting all clearance mechanisms become saturated and the animal will quickly succumb. These model results correlate well with observations showing the mean time to death in NZW rabbits exposed to lethal doses of Ames spores is 46.9 hours. 20
The results presented here suggest the models are able to describe bacterial kinetics in rabbits following inhalation of virulent spores and show how they can be used to provide insight into mechanistic processes like spore germination, which is difficult to measure in vivo. As a result, these models could serve as a foundation for the development of more detailed rabbit models that help to further our understanding of the disease. One potential next step could be to add more physiological/spatial compartments to the PBBK model, which could include individual compartments for lung tissue, TBLNs, and blood. Some rabbit data exist on lymph flow rates, lymph volume, and passage of bacteria through the thoracic duct.75-79 In addition, some data have been collected on bacterial growth in rabbit serum. 77 Since most of this type of data already exists for humans, this type of rabbit model could be reparameterized for humans and provide useful information on human disease. One example would be to use the human model to provide information on the time it takes bacteria to move from the lung to the circulation, which could help to better define the therapeutic window or be used to backtrack and identify the time (and location) of exposure. Another next step could be adding stochasticity to the PBPK model in order to examine response distributions rather than individual responses.
Additionally, another important next step could be to add in parameters that capture host immune function. Examples would be including variables for immune cells, and the models could address phagocytosis, germination, and migration.
Finally, advancing the models described in this work by combining in vivo models/data with in vitro models/data collection (eg, tissue culture models specific for rabbit) 78 could greatly aid in extrapolating rabbit inhalational anthrax to humans.
In summary, significant information gaps still exist for inhalational anthrax in humans. Given the fact that naturally occurring human inhalational anthrax is exceptionally rare, filling these gaps will require advanced biological and computational animal models. The rabbit models described herein are a step toward meeting those goals.
Footnotes
Acknowledgments
A portion of this work was conducted as part of the University of Illinois NetMath Certificate of Professional Development in Applied Mathematics program. The author is grateful to Dr. Bruce Carpenter and the entire NetMath team at the University of Illinois. This work was funded by the Naval Surface Warfare Center, Dahlgren Division, Workforce Development Program. The author is also grateful to Dr. Brandolyn Thran of the US Army Public Health Command for helpful discussions on spore deposition.