
Abstract
Abstract
Introduction:
There is a large disparity between the “cultural” language used by patients using cannabis for self-medication and the “chemical” language applied by scientists to get a deeper understanding of cannabis effects in laboratory and clinical studies. The distinction between Sativa and Indica types of cannabis, and the different biological effects associated with them, is a major example of this. Despite the widespread use of cannabis by self-medicating patients, scientific studies are yet to identify the biochemical markers that can sufficiently explain differences between cannabis varieties.
Methods:
A metabolomics approach, combining detailed chemical composition data with cultural information available for a wide range of cannabis samples, can help to bridge the existing gap between scientists and patients. Such an approach could be helpful for decision-making, for example, when identifying which varieties of cannabis should be made legally available under national medicinal cannabis programs. In our study, we analyzed 460 cannabis accessions obtained from multiple sources in The Netherlands, including hemp- and drug-type cannabis.
Results:
Based on gas chromatography analysis of 44 major terpenes and cannabinoids present in these samples, followed by Multivariate Data Analysis of the resulting chromatographic data, we were able to identify the cannabis constituents that may act as markers for distinction between Indica and Sativa. This information was subsequently used to map the current chemical diversity of cannabis products available within the Dutch medicinal cannabis program, and to introduce a new variety missing from the existing product range.
Conclusion:
This study represents the analysis of the widest range of cannabis constituents published to date. Our results indicate the usefulness of a metabolomics approach for chemotaxonomic mapping of cannabis varieties for medical use.
Introduction
Research into herbal cannabis poses serious challenges to modern medicine, which operates mainly according to the “single compound–single target” paradigm of pharmacology. Although it was once believed that THC (see Table 1 for abbreviations) was the unique active principle found in cannabis, it is becoming clear that a much wider range of cannabis constituents may be involved in its various therapeutic effects. Currently, many different subtypes of cannabis are known to exist, and the high number of (potential) active components significantly complicates a conventional reductionist approach using analytical chemistry, animal studies, and clinical trials, where typically a single active ingredient is identified before development of a final medicine is possible. With the recent growth in medicinal use of cannabis, the need to clearly distinguish between various cannabis plants and their expected (therapeutic) effects has become more important than ever.
(1): beta-phellandrene and R-limonene were combined for analysis because of chromatographic peak overlap. (2): nerolidol may in fact be alpha-gurjunene. (3): delta-8-THC, CBN, and THC were combined for final analysis to one value for “THC total.”
GC, gas chromatography; RT, GC retention time in minutes; RRT, relative retention time compared to beta-caryophyllene.
Medicinal cannabis may have therapeutic effects on various illnesses ranging from chronic pain and multiple sclerosis (MS), to epilepsy and anxiety.1,2 An obvious question is how the chemical composition of cannabis reflects these various medicinal effects, and what types of cannabis should consequently be made available to provide patients with a full spectrum of therapeutic benefits. Already more than 700 different cultivated varieties (cultivars) of cannabis have been cataloged 3 and many more are thought to exist, each one with a potentially different effect on body and mind. Although pharmacopoeia monographs for the chemical analysis of cannabis have been developed in several countries,4–6 these are intended for potency, quality, and adulteration issues only. They are not designed to map out the complex chemical variations found among different cannabis products. A better classification of cannabis varieties, and the chemical differences between them, would certainly promote further implementation of cannabis-based products into (pre)clinical research and modern medicine.
Science-based classification systems
The scientific debate about classification of the cannabis species has been going on for centuries. According to current scientific consensus, Cannabis is monotypic and consists only of a single species Cannabis sativa L., as originally described by Leonard Fuchs in the 16th century. 3 Within this species, two important subdivisions are commonly made. One of them recognizes drug-type versus fiber-type cannabis based on the intended use of the plant, and is mostly relevant for legal purposes. The other subdivision is based on botanical principles and identifies Sativa versus Indica types of cannabis, both regarded as a subspecies of Cannabis sativa L. 7
According to the botanical description of cannabis, Sativa types of cannabis were originally grown in the Western world on an industrial scale for fiber, oil, and animal feedstuff. They are characterized by tall growth with few, widely spaced, branches and long, thin leaves. In contrast, plants of the Indica type originated in South Asia and were known historically as Indian hemp. They are characterized by shorter bushy plants and broader leaves, typically maturing relatively fast. The two groups tend to have a different smell, which may reflect a different profile of fragrant terpenes. Most cannabis plants that are currently commercially available are in fact a hybrid (cross-breed) of Sativa and Indica ancestors. Cannabis-type ruderalis is sometimes also recognized as a separate subspecies. It is a smaller and “weedy” plant originally from Central Russia. 7
Various scientific attempts have been made to classify cannabis plants based on their cannabinoid composition, as outlined in more detail in our previous article. 8 For forensic and legal purposes, the most important classification is that of the drug type (marijuana) versus the fiber type (hemp), with an emphasis on the total THC content in the flowers of the plant. Until recently, cannabis products used for medicinal purposes in official programs all belonged to the drug type, because of their high content of the biologically active THC. However, it is becoming increasingly clear that multiple constituents may be involved in the overall effect of the drug. 9 This includes the cannabinoids CBD,10,11 CBG,12,13 and THCV,14,15 as well as a variety of terpenes. 16
Terpenes are volatile compounds responsible for the typical smell and taste of cannabis. More than 120 different types have been identified in cannabis and their relative composition can vary widely between varieties.17,18 Terpenes present in cannabis have a wide range of known biological effects, and some may be involved in regulating and/or modifying the effects of THC and other cannabinoids. 16 Expanding our scientific understanding of the therapeutic benefits of terpenes is a budding new frontier of medical cannabis research. Nevertheless, no currently used cannabis classification system takes the terpenes into account.
Since the publication of the draft genome of cannabis, 19 various studies have looked into the genetic analysis of cannabis as a means of identifying distinct (sub)groups.20,21 Such studies have been able to clearly differentiate hemp from marijuana-type cannabis, 21 but they find only a moderate correlation between the ancestry of cannabis strains, as reported by breeders, and the ancestry inferred from their DNA. As a result, the genetic identity of cannabis products could not be reliably inferred by its vernacular name or by its reported ancestry as supplied by cannabis growers.
Vernacular classification
Over the years, illicit growers of marijuana have created an enormous range of cultivated varieties, also popularly known as cultivars or strains. These are commonly distinguished, by plant breeders, recreational users, and medical cannabis patients alike, through the use of popularized vernacular names such as White Widow, Northern Lights, AK-47, or Amnesia Haze. The most common way to categorize such strains is based on plant morphology (phenotype), which considers features such as leaf shape, plant height, color, smell, and speed of growth. This has resulted in a vernacular system of distinguishing Sativa from Indica types of cannabis, which developed independent from scientific and taxonomic classification systems. 3 According to the vernacular system, Sativa strains are usually characterized as uplifting and energetic. The effects are mostly cerebral (“head-high”), also described as spacey or hallucinogenic. This type gives a feeling of optimism and well-being. In contrast, Indica strains are primarily described as calming and grounding (“body-high”). This type is said to cause relaxation, stress relief, and an overall sense of serenity. 22
Because of limited guidance and support from the medical community, self-medicating users of cannabis often adopt the vocabulary of cannabis subculture to navigate their search for cannabis medicine. 23 When buying cannabis for recreational as well as for medicinal reasons, consumers use the vernacular Sativa and Indica labels as a means to identify their preferred products. Unfortunately, it is largely unclear how these labels reflect an actual difference in chemical composition, and how they are related to the scientifically accepted botanical classification of cannabis cultivars, as described above. A major issue with vernacular classification is that there are no generally agreed standards or enforced regulations for variety labeling and naming. As a result, the Sativa/Indica distinction made by botanists and taxonomists may be very different from the one applied by consumers of cannabis. 22
Several studies have challenged the usefulness of the current Sativa/Indica classification system. 3 For example, in a recent study, almost 500 cannabis samples available to California patients were analyzed for chemical composition. 24 The study concluded that popular product names as defined by the authoritative Leafly database (www.leafly.com) were no guarantee to obtain a product with a reproducible chemical composition, and that the provided product name was not a reliable indicator of THC potency or chemical profile. In fact, samples collected under the same name often did not even look similar in appearance. Alternative classifications have been proposed, such as Broad Leaflet versus Narrow Leaflet drug types.20,25 Another recent article suggested a complete overhaul of the current botanical classification based on reinterpretation of historical taxonomic records. 26
From cultivar to chemovar
For medicinal users of cannabis, the main challenge is to find a product with a chemical profile that matches their pharmacological need for treatment. The name of the cannabis product serves merely as a means to identify and purchase the desired product. What is needed is a practical manner to more directly visualize the chemical diversity present within the many cannabis products offered, and to make sure that the full range of diversity is accessible through legally available, high-quality products under national programs safeguarding quality and consistency.
A comprehensive overview of chemical diversity can help medicinal users and their physicians to successfully transition from a beneficial cannabis product obtained through illicit markets, to a comparable but high-quality variety that is available through official national programs. It may also help these national programs to narrow down the search for beneficial cannabis cultivars to be legally produced and introduced into healthcare. Such an approach fits exactly within the research field of metabolomics, which is recognized as a scientific methodology to better understand the complex effects of medicinal plants containing multiple active ingredients. A metabolomics approach would simultaneously identify and quantify all major cannabinoids and terpenes present in various cannabis types, and then use powerful statistical tools such as Multivariate Data Analysis to create a “map” of chemical diversity.
This methodology has already been successfully applied to cannabis for differentiation of cannabis products on a small scale as well as for quality control.8,27 With this approach, it may be possible to move away from the current system of cannabis cultivars, with often vague and unsubstantiated characteristics dominated by Sativa/Indica labeling, toward a new classification based on chemical varieties (or “chemovars”) with a complex, but well-defined and reproducible chemical profile.
Goal of our study
In this article, we address the question whether cannabis vernacular product names can be replaced with chemical profiles as a means of classifying cannabis products into distinct groups. A metabolomics approach was used to investigate the chemical variation present within 460 accessions of marijuana as well as hemp collected in The Netherlands. We were particularly interested in the differences in composition between the Indica and Sativa types. Samples were chemically profiled for 44 different major cannabinoids and terpenes using gas chromatography with flame ionization detection (GC/FID), followed by statistical evaluation of the chromatographic data. The study results indicate the usefulness of the chemovar approach (full chemical analysis for chemotaxonomic mapping of cannabis varieties) and may assist in a better identification of cannabis products with a potential for medicinal use.
To highlight the feasibility of our proposed chemovar mapping, we describe an example from the Dutch medicinal cannabis program where the experiences of cannabis-using patients were combined with our chemical profiling approach to introduce a new standardized cannabis variety for Dutch patients.
Materials and Methods
Solvents and chemicals
Authentic standards were available for the following terpenes: alpha-pinene, beta-pinene, beta-caryophyllene, ocimene, alpha-phellandrene, R-(+)-limonene, gamma-terpinene, (+)-borneol, (−) caryophyllene oxide, (−)-trans-caryophyllene, cineole, fenchol, alpha-bisabolol, camphor, myrcene, farnesene (mixture of isomers), S-(−)-limonene, gamma-terpineol, phytol, carvacrol, and (+)-aromadendrene were obtained from Sigma-Aldrich; alpha-humulene, terpineol, (−)-linalool, and trans-nerolidol were from Fluka; beta-eudesmol and geraniol were from Chromadex; delta-3-carene was from Roth.
Calibrated standards were available for the following cannabinoids: delta-9-tetrahydrocannabinol (THC), cannabidiol (CBD), cannabigerol (CBG), cannabichromene (CBC), trans-(−)-delta-9-tetrahydrocannabivarin (THCV), and cannabinol (CBN). They were purified and quantified as previously described.8,28,29 A standard for cannabigerol-monomethylether (CBGM) was not available.
All organic solvents and 1-octanol (used as internal standard [IS]) were of analytical reagent grade or HPLC grade (Sigma-Aldrich).
Sample collection
A total of 460 accessions were collected from three different sources (coffeeshops, Bedrocan, HempFlax) as described below. Vernacular names and presumed botanical type (Sativa, Indica, hybrid, hemp) were recorded as provided by the source. All samples were kept in a freezer at −20°C until analyzed.
Cannabis cultivation and sales are formally illegal under Dutch law. However, through the famous outlets known as “coffeeshops” the sales of small quantities of cannabis are tolerated (condoned) under strict conditions. There are currently about 600 coffeeshops in The Netherlands, with the majority located in the bigger cities. 30 We collected a total of 56 accessions from various coffeeshops present in several Dutch municipalities. One gram of each product was purchased and stored in the package provided (typically a small plastic zip-lock bag). In general, we requested to purchase the most typical Sativa-dominant and Indica-dominant products available in the shop. No verifiable phenotypic information about the original plants is available for these samples.
Bedrocan BV is the official cultivator of pharmaceutical-grade cannabis within the Dutch medicinal cannabis program. A total of 37 different accessions were obtained from its breeding program. Included were six standardized varieties currently available to patients on prescription (official product names: Bedrocan, Bedrobinol, Bediol, Bedica, Bedrolite, and Bedropuur). Voucher specimens have been deposited at the Naturalis National Herbarium in Leiden, The Netherlands (L) under sample codes “Hazekamp 1–6.” All accessions were grown from female clones under strictly standardized indoor conditions. Flowertops were harvested and air-dried for 1 week under controlled temperature and humidity. Final samples were delivered in airtight, triple-laminate aluminum foil bags. Detailed descriptions and pictures of the plants are available.
HempFlax BV produces semi-finished and finished products made from ecologically grown fiber hemp and flax. Under their current research license, the company is propagating a wide range of cannabis varieties, including hemp, Sativa, and Indica types. Seeds of these accessions are sold through the Dutch company Sensi Seed Bank. From this source, we received a total of 367 accessions in the form of dried flowers. Plants were grown under indoor conditions. Samples were delivered in plastic zip-lock bags. Detailed descriptions and pictures of these plants are available.
Sample extraction
Samples were homogenized by manually cutting the plant material in smaller pieces with scissors. Of each sample, 500 mg (accuracy ±5 mg) was weighed and transferred to a 50-mL plastic serum tube. To each tube, 40 mL of ethanol (absolute) was added, and the tube was agitated for 10 min with a mechanical shaker (Yellow Line Orbital Shaker OS 2 Basic; IKA GmbH) at 300 rpm. The tube was then centrifuged and clear supernatant was poured into a 100-mL volumetric flask. For exhaustive extraction, the procedure was repeated twice more with 25 mL of ethanol, and supernatants were combined. At this point, 200 μL of IS, consisting of a 1% solution of 1-octanol in ethanol, was added to each extract, resulting in a final IS concentration of 0.002% (v/v). Finally, volume was adjusted to 100 mL with ethanol and mixed well. The solution was centrifuged to remove solid particles and stored at −20°C until analyzed by GC. All accessions were analyzed in duplicate.
GC analysis
An Agilent GC 6890 series (Agilent Technologies, Inc.) equipped with a 7683 autosampler and an FID was used for simultaneous analysis of monoterpenes, sesquiterpenes, and cannabinoids, as previously described. 8 The instrument was equipped with a DB5 column (30 m length, 0.25 mm internal diameter, film thickness 0.25 μm; J&W Scientific, Inc.). The injector temperature was 230°C, with an injection volume of 1 μL, a split ratio of 1:20, and a carrier gas (N2) flow rate of 1.2 mL/min. The temperature gradient started at 60°C and increased at a rate of 3°C/min until 240°C, which was held for 5 min making a total run time of 65 min/sample. The FID detector temperature was set to 250°C. The GC-FID was controlled by Agilent GC Chemstation software version (rev. B.04.01).
In each sample chromatogram, typically 30–40 chromatographic peaks were visible. All peaks were manually integrated and resulting peak area values were entered into an Excel datasheet. Raw integration data were then corrected for IS (1-octanol) peak area and used for principal component analysis (PCA) as described below. It should be noted that for each sample, the peak areas for CBN, delta-8-THC, and THC, were combined to one single value for “THC total.” Because CBN and delta-8-THC are known degradation products of THC (resulting from long-term storage and aging) and the cannabis plant does not originally produce these degradation products as part of its metabolism, they are considered to be part of the actual (original) content of THC. In general, peak areas of CBN and delta-8-THC were present in trace amounts only.
Peak identification and quantification
To confirm peak identification, selected samples were further analyzed by GC-MS using a single quadrupole MS-detector in total ion count mode as previously described. 27 Compounds were compared based on their mass spectra and retention times with authentic standards as well as literature reports.31–36 In addition, the NIST library was used to assist in compound identification (version 2.0f; Standard Reference Data Program of the National Institute of Standards and Technology, as distributed by Agilent Technologies).
For quantitative analysis, peak area values were quantified (in mg/g of plant material) with the use of calibration curves. Monoterpenes, sesquiterpenes, and cannabinoids present in the samples were quantified by using calibrated standards of beta-pinene, alpha-humulene, and CBD, respectively, comparable to our method previously described. 8 Each calibration curve consisted of four different concentration levels in the range of 0.005–0.1 mg/mL (beta-pinene, alpha-humulene) or 0.25–1.0 mg/mL (CBD) dissolved in ethanol. Calibration curves were regularly prepared throughout the duration of the study. The resulting quantitative data were not corrected for residual moisture content of the samples.
Multivariate data analysis
After correcting for IS and averaging of duplicate analyses, peak integrals from the GC-FID chromatograms were used for Multivariate Data Analysis with the aid of SIMCAP+ version 13.0.3 software (Umetrics AB). All values were scaled with unit variance before modeling, which gives equal weight to all variables.
First, unsupervised analysis was performed by applying PCA to identify clusters of samples that have similar chemical composition. PCA is a statistical way of identifying patterns in complex data sets, by turning the data set into linearly uncorrelated values, which are the principal components (PCs). 37 The resulting plot highlights the major similarities and differences between the analyzed samples. 38 With this method, there is no a-priori expectation of the nature of such clusters, and we leave it up to the computer program to tell us if clusters of data points actually exist. For this analysis, we used GC data of all 460 accessions. The first two principal components (PC1 and PC2) were visualized in a scatter plot, in combination with its accompanying loading plot, to show the contribution of each chemical component to the diversity observed in the sample collection.
Next, a supervised analysis was performed by applying orthogonal projection to latent structure-discriminant analysis (OPLS-DA) on the GC data obtained from the 131 accessions in our data set that were labeled as pure Indica or Sativa. OPLS-DA is a form of partial least-squares regression analysis (a dimensionality reduction technique) combined with discriminant analysis (which is a form of classification). OPLS-DA is a further development from PCA and a method of choice when working with a data set consisting of known distinct classes (in our case, Sativa versus Indica). 39 This method shows which variables are responsible for class discrimination in an easy to interpret 2D visualization. 40
In addition, for a better understanding of the quantitative differences between Sativa, Indica, and hemp types of cannabis, GC data were quantified with the use of calibration curves to determine the absolute content (in milligrams) of each component per gram of plant material. Statistical analysis was done by T-test to identify significant differences in cannabinoid or terpene composition between these three cannabis types. Finally, PCA mapping of the entire cannabinoid and terpene profile was shown to be a useful way to identify missing cannabis types within the Dutch medicinal cannabis program.
Results and Discussion
Cannabis sampling and analysis
In the present study, we chemically analyzed 460 different cannabis accessions from various sources, representing one of the largest cannabis sample sets analyzed to date. Based on information obtained from suppliers, accessions were labeled as Hemp (n=121), Sativa (n=68), Indica (n=63), or Hybrid (n=208). With the use of GC analysis, 44 different compounds could be positively identified with a single chromatographic run, including 17 monoterpenes, 19 sesquiterpenes, and 8 cannabinoids (Table 1). It should be noted that during GC analysis, all acidic cannabinoids (e.g., THC-acid and CBD-acid) are fully converted to their neutral counterparts (THC, CBD, etc.) as a result of the high temperatures (up to 250°C) applied during injection and separation.
Since our previous study, 8 we were able to extend our list of positively identified terpenes from 20 to 36, by more closely studying the compounds previously identified by Ross and ElSohly 33 and Hillig, 34 as well as by the use of newly acquired standards and performing more detailed GC-MS analysis of unresolved peaks. Only one of the newly added compounds could not be unequivocally identified: the compound we putatively identified as nerolidol (in accordance with Ross and ElSohly 33 ) may perhaps be alpha-gurjunene. 34 Unfortunately, we did not have the pure standard for alpha-gurjunene needed to distinguish between these two. Because of lack of resolution between the chromatographic peaks of beta-phellandrene and R-limonene, these two compounds were analyzed as a single peak.
Compared to our previous study on cannabis composition, 8 we made one modification to the extraction and analysis protocol, that is, the addition of an IS in the form of 1-octanol. In each sample, the IS peak area was used to compensate for small deviations in the injection volume of the GC, to obtain more accurate data. The IS did not overlap with other chromatographic peaks present in our samples, as indicated in Table 1.
Unsupervised data analysis: visualizing patterns in the data set
An unsupervised PCA approach was used to visualize any potential clustering in the data set, based on the analysis of a large number of terpenes and cannabinoids. The data set consisted of 460 samples containing up to 44 identifiable compounds each, which equals over 20.000 variables (i.e., 460×44) for evaluation. For the statistical analysis, each analyzed compound represented a variable while its quantity (i.e., peak area compensated for IS) represented the observation. Figure 1a shows an evaluation of the first two principal components (PC1 and PC2) in the form of a score plot. It is clearly shown that the main distinction observed in our data set was between hemp-type samples on the left versus drug-type samples (Sativa+Indica+hybrids) on the right. PC1 (28.3%) and PC2 (8.5%) together explained 36.8% of the total variance found in the sample set; almost twice as high as the model proposed by Hillig 25 (PC1+PC2=19.6%) and equal to the model by Elzinga et al. 24 (PC1+PC2=34.6%). Analysis of PC3 added an additional 7.7% to the total variance explained by our model.
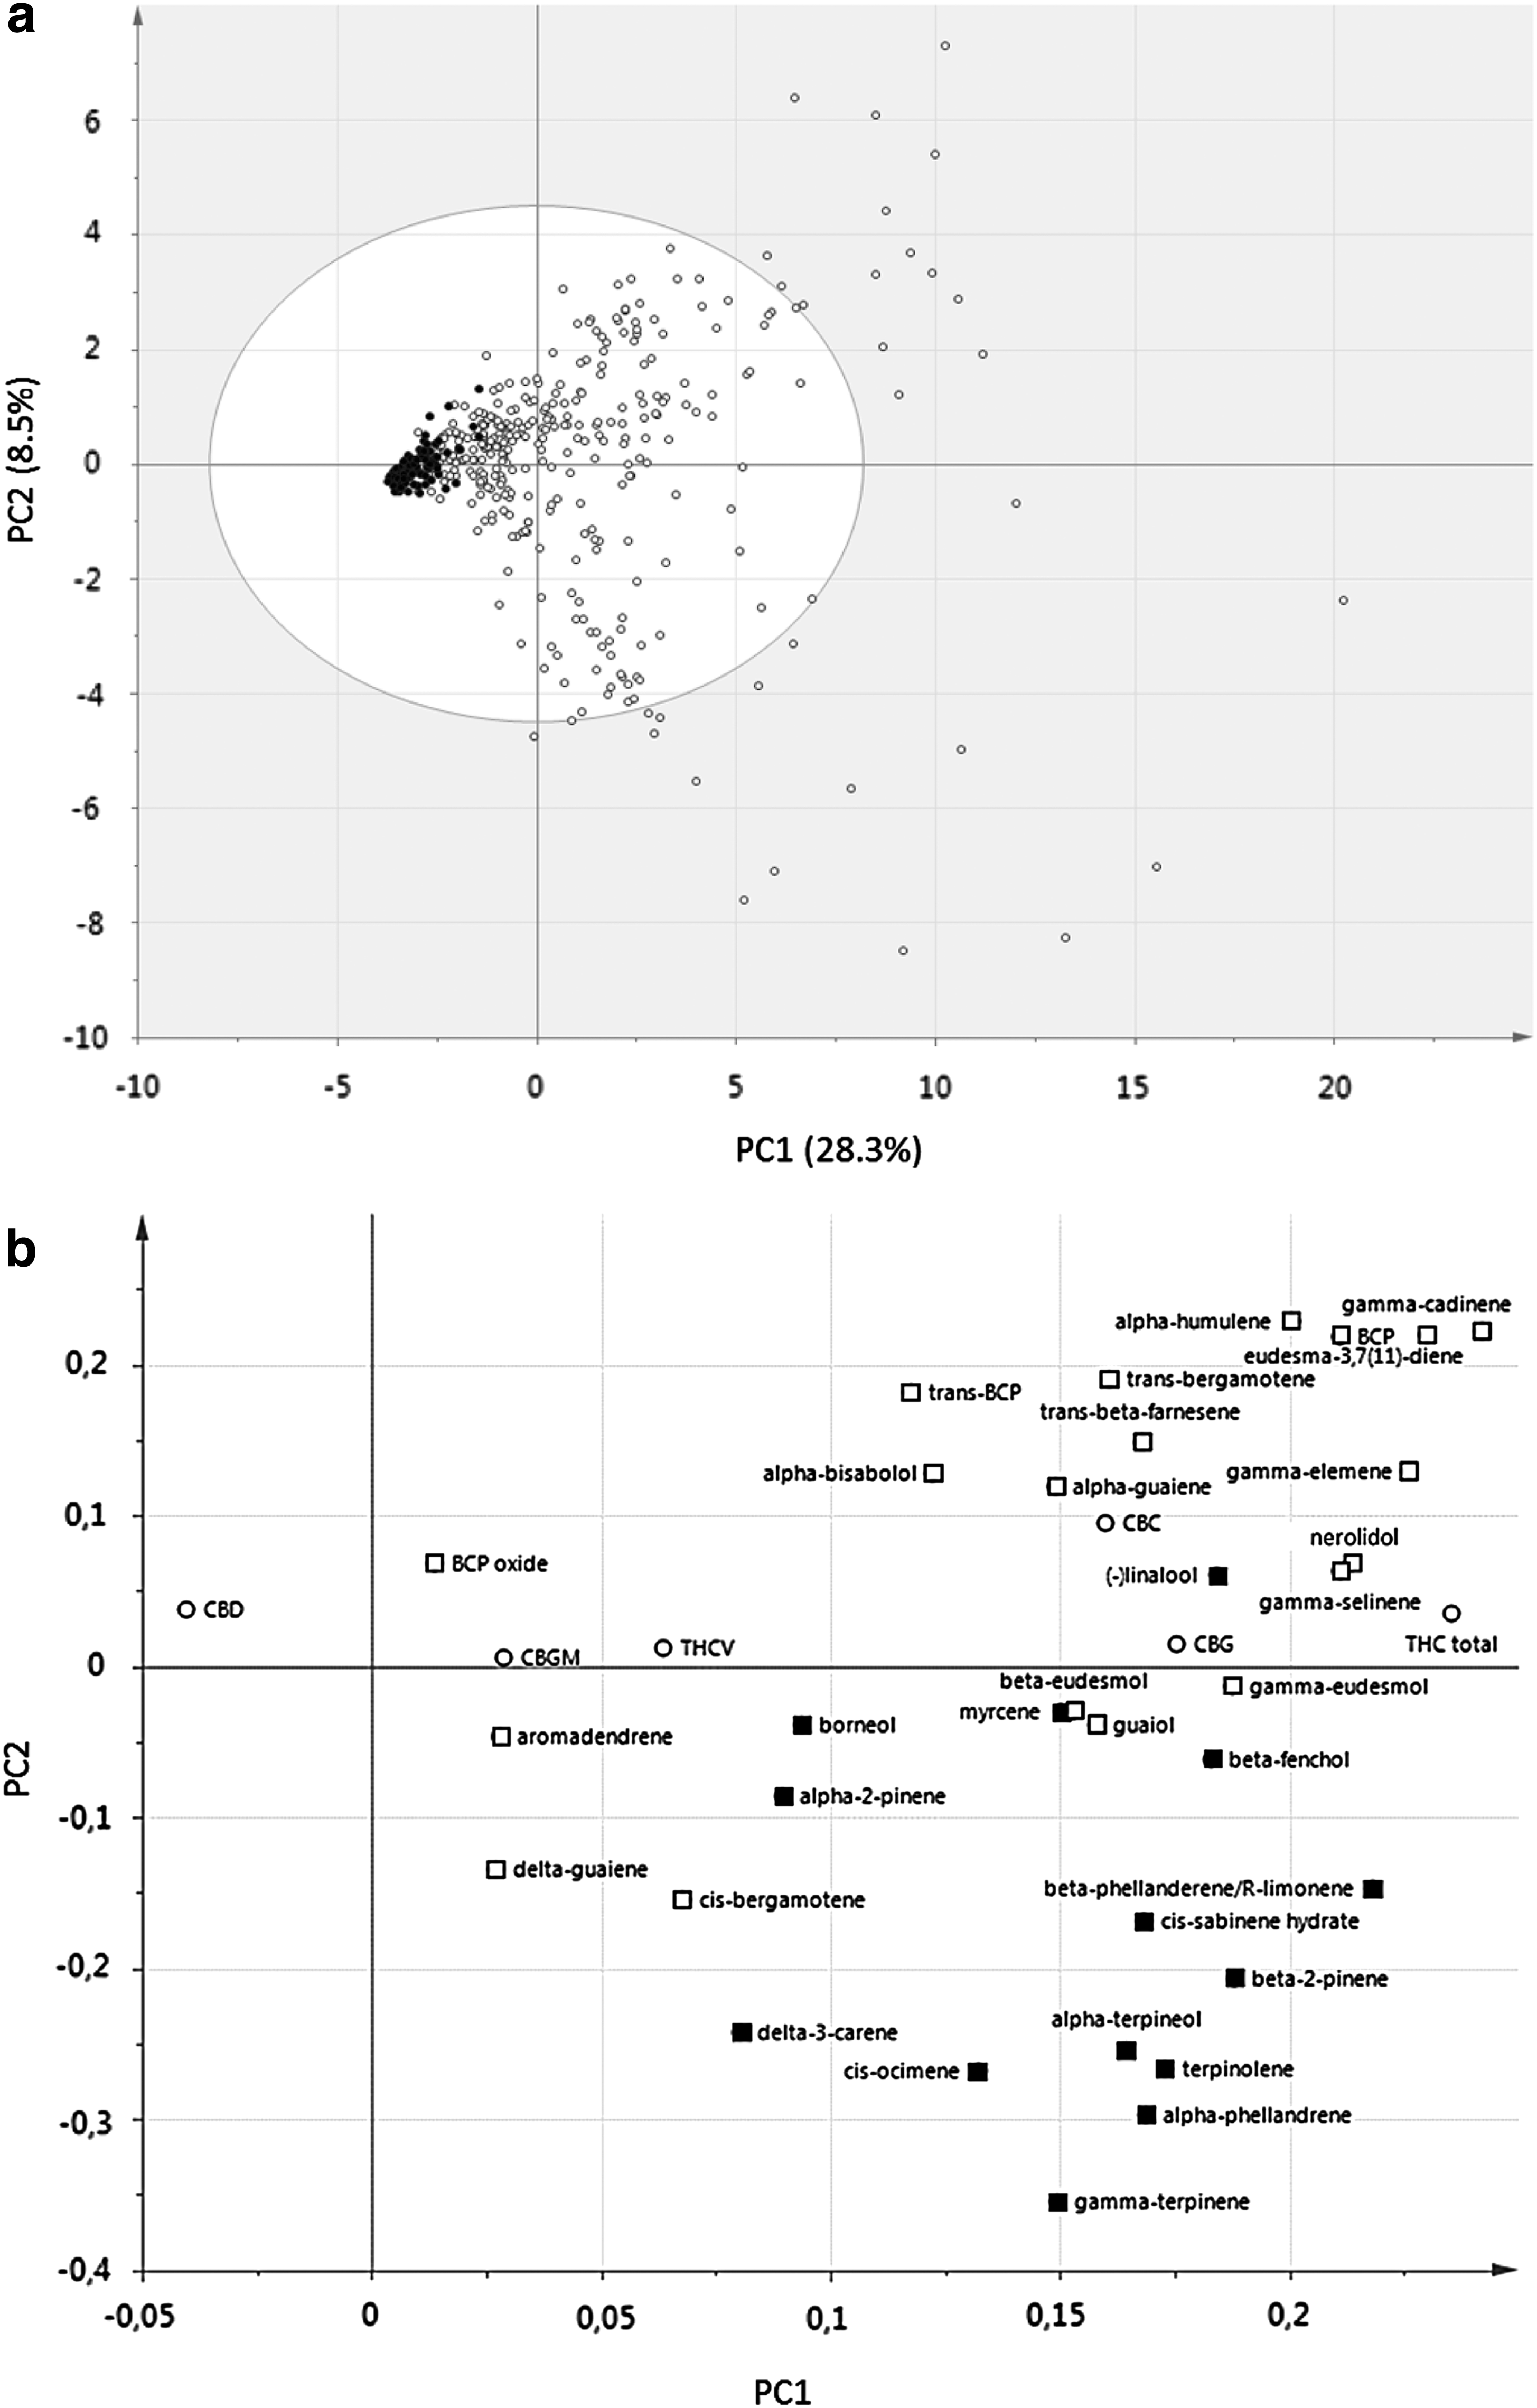
The accompanying loading plot (Fig. 1b) visualizes how samples differ from each other, and which compounds (markers) contribute the most to explaining the observed grouping. The two components showing the largest contribution to PC1 are CBD (far left of the plot) and THC (far right). It is striking that all components, except CBD, in the loading plot appear on the right side of the horizontal (PC1) axis, which means that all are more prominently present in drug cultivars. Although the ratio between THC and CBD is a known marker for the differentiation between hemp- and drug-type cannabis, 41 it may be a surprise that not a single terpene turns out to be a clear marker associated with hemp.
Among the drug-type accessions, a further separation of samples is seen along the vertical (PC2) axis, separating samples with relatively higher content of sesquiterpenes such as alpha-humulene, beta-caryophyllene, gamma-cadinene, and eudesma-3,7(11)-diene (upper half of the plot) versus those typified by relatively higher content of monoterpenes, such as gamma-terpinene, alpha-phellandrene, cis-ocimene, alpha-terpineol, and terpinolene (lower half). Interestingly, cannabinoids only play a limited role in this distinction, as they are mainly aligned along the PC1 axis, between the two groups. The only exception was the minor cannabinoid CBC, which was more strongly associated with the subgroup defined by higher sesquiterpene content.
Supervised data analysis: identifying markers in Sativa versus Indica types
When we applied a supervised (discriminatory) form of Multivariate Data Analysis, we were able to test the hypothesis that certain clusters must exist, based on a-priori knowledge we possess about the sample set. More specifically, we wanted to verify whether clear differences exist between the chemical profiles of Sativa versus Indica samples, assuming these two classes actually exist. In other words, if indeed meaningful chemical differences exist between the vernacular Sativa and Indica types, OPLS-DA modeling must be able to identify the markers that are associated with the two classes. We therefore included only the 68 accessions labeled as pure Sativa and 63 accessions labeled as pure Indica, while hemp varieties and hybrids were excluded from this particular analysis.
Results of the modeling are visualized in the score plot shown in Figure 2a. Using the OPLS-DA method, the horizontal (X) axis visualizes maximum variation between classes (Sativa versus Indica), while the vertical (Y) axis shows maximum variation within these classes. Indeed, the score plots of the OPLS-DA model showed that the Sativa samples were distinguishable from the Indica samples with only very mild overlap. Good model quality was indicated by the values of R2X (0.387) and Q2 (0.582). The coefficient loading plot of the OPLS-DA model was used to identify the components responsible for sample differentiation on the score plot (Fig. 2b).
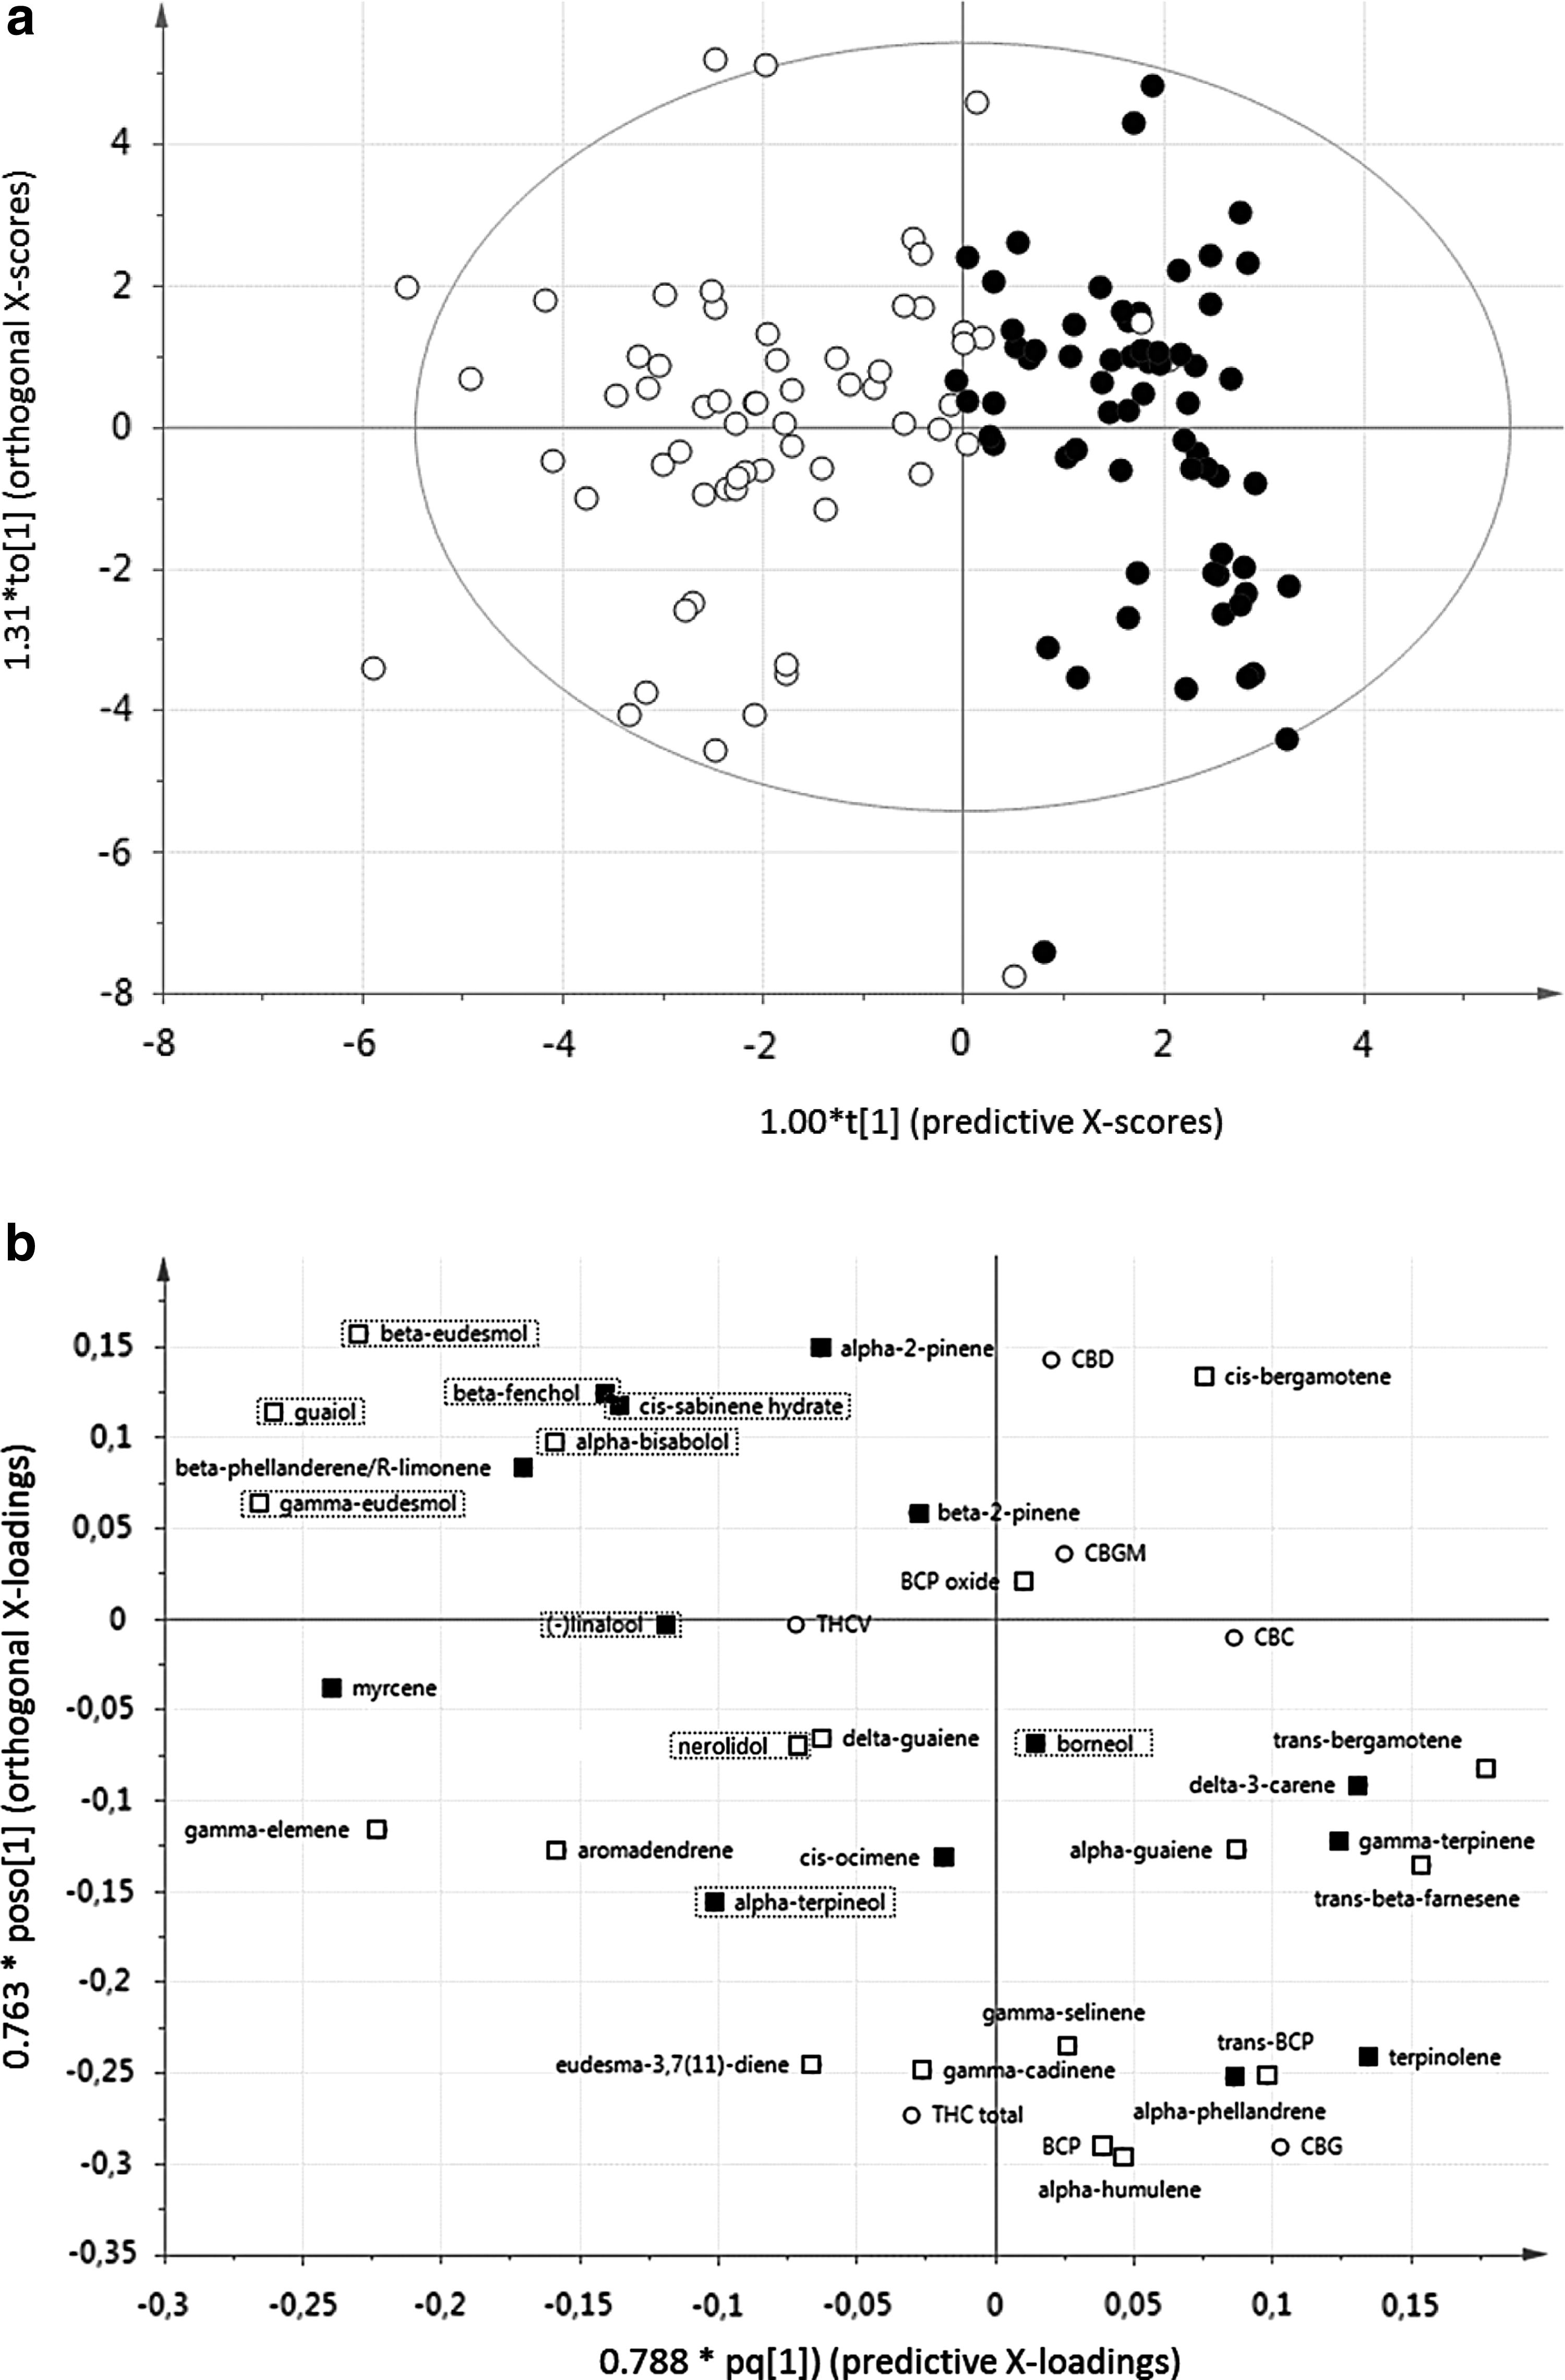
By subsequently constructing an S-plot (figure not shown) based on the OPLS-DA data, the most significant markers associated with our samples could be identified. We found that the presence of the terpenes trans-bergamotene, trans-beta-farnesene, delta-3-carene, and terpinolene was most strongly associated with the Sativa-type samples, while beta- and gamma-eudesmol, guaiol, myrcene, and gamma-elemene were the most prominent markers for the Indica-type samples. Interestingly, we discovered that all hydroxylated terpenes (marked in Fig. 2b) were most strongly associated with the Indica type of samples. This begs the question whether there is a functional correlation between the presence of the hydroxylated forms of terpenes and the plant morphology of the Indica type.
Quantitative analysis of Hemp, Sativa, and Indica
All samples labeled as Hemp (n=121), Sativa (n=68), or Indica (n=63) were quantified with the use of GC calibration curves. The use of only three standards (beta-pinene for monoterpenes, alpha-humulene for sesquiterpenes, and CBD for cannabinoids) for quantification of all sample components greatly facilitated our analysis. This approach was based on the observation that the differences in FID-detector response within the chemical class of the monoterpenes, sesquiterpenes, or cannabinoids, respectively, are relatively small. 27 Because analyzing all 44 sample components by preparing their own standard curves would be an immense and costly task, one representative compound was chosen to quantify the others in the same chemical class. Of course, this approach only works if all observed components have a linear FID response within the analyzed concentration range. Indeed, this was shown to be true by analyzing selected extracts at different dilution levels and plotting GC peak area versus dilution for each observed peak.
The mean calculated content of cannabinoids and terpenes, reported in mg/g of sample weight, is shown in Table 2. When comparing cannabinoid profiles, all analyzed cannabinoids were found to be present in significantly lower quantities in hemp types compared to Sativa or Indica types (p<0.05). The only exception was for CBD, with hemp accessions (mean: 1.1% CBD) showing a significantly higher mean content than Sativa or Indica (drug) accessions (mean: 0.3–0.4% CBD). When comparing Sativa- to Indica-type samples, we found only significant differences for the content of CBC and CBG, both of which tend to be somewhat more prominently present in Sativa types (p<0.05). The mean THC content of both types was found to be comparable, with values of about 127–137 mg/g (or 12.7–13.7%). These values correspond very well with the average content reported for Dutch indoor-grown recreational cannabis offered through coffeeshops. 42
Compounds are listed in order of GC elution according to Table 1. Mean values are shown ± SD. In each row: values marked with different letters (a, b, c) are significantly different at p<0.05. Hydroxylated terpenes are marked with an asterisk (*).
SD, standard deviation.
Quantitative analysis of the terpenes confirmed the observation made by PCA that hydroxylated terpenes (marked with * in Table 2) are significantly more prevalent in Indica than in Sativa accessions. In particular, the sesquiterpenes guaiol, beta- and gamma-eudesmol, and alpha-bisabolol were strongly associated with the Indica type (p<0.001). Indeed, the presence of such sesquiterpene alcohols has previously been reported to be important for the chemotaxonomic discrimination of Indica cannabis varieties originating from Afghanistan. 34
Interestingly, in our study, we found myrcene, on average the most abundant terpene in our samples, to be strongly associated with the Indica type of cannabis (p<0.001). In contrast, Hillig 34 measured relatively higher levels of myrcene in Sativa types, while Lynch et al. 20 found hemp samples to contain significantly more myrcene than drug-type cannabis. These conflicting results indicate that selecting single compounds as markers for specific cannabis types may have its limitations.
Mapping diversity: a practical application of the chemovar approach
The Dutch medicinal cannabis program currently provides six different standardized varieties to patients, with the original one (variety Bedrocan®) having been introduced as early as 2003. All six products were analyzed in the current study, together with another 31 experimental, nonstandardized accessions. Occasionally, Dutch patients have claimed that the current product range does not cover the full spectrum of varieties needed to treat all medical indications. Such opinions are commonly based on trial-and-error experiences by individual patients using cannabis obtained from a variety of sources, including coffeeshops and other illicit sources, or home-grown cannabis. Although new varieties have been introduced regularly over the years (most recently the CBD-rich variety Bedrolite® in 2014), the discussion about the need for new varieties regularly reappears. A clear and practical chemovar approach to this discussion may be useful to identify cannabis varieties that could be added to the current choice of products.
In this study, the analysis of a large number of samples available in The Netherlands has provided us with a sort of “chemical diversity map.” In Figure 3, the PCA plot already shown in Figure 1a is repeated, but now with the six standardized pharmacy products (varieties Bedrocan, Bedrobinol, Bediol, Bedica, Bedrolite, and Bedropuur) highlighted to indicate their position on the map. This visualization makes it clear that two major sections of the map are not covered, marked as regions A and B. Based on the sample information obtained from the original source, we know that region A corresponds with a cluster of samples popularly labeled as Amnesia.
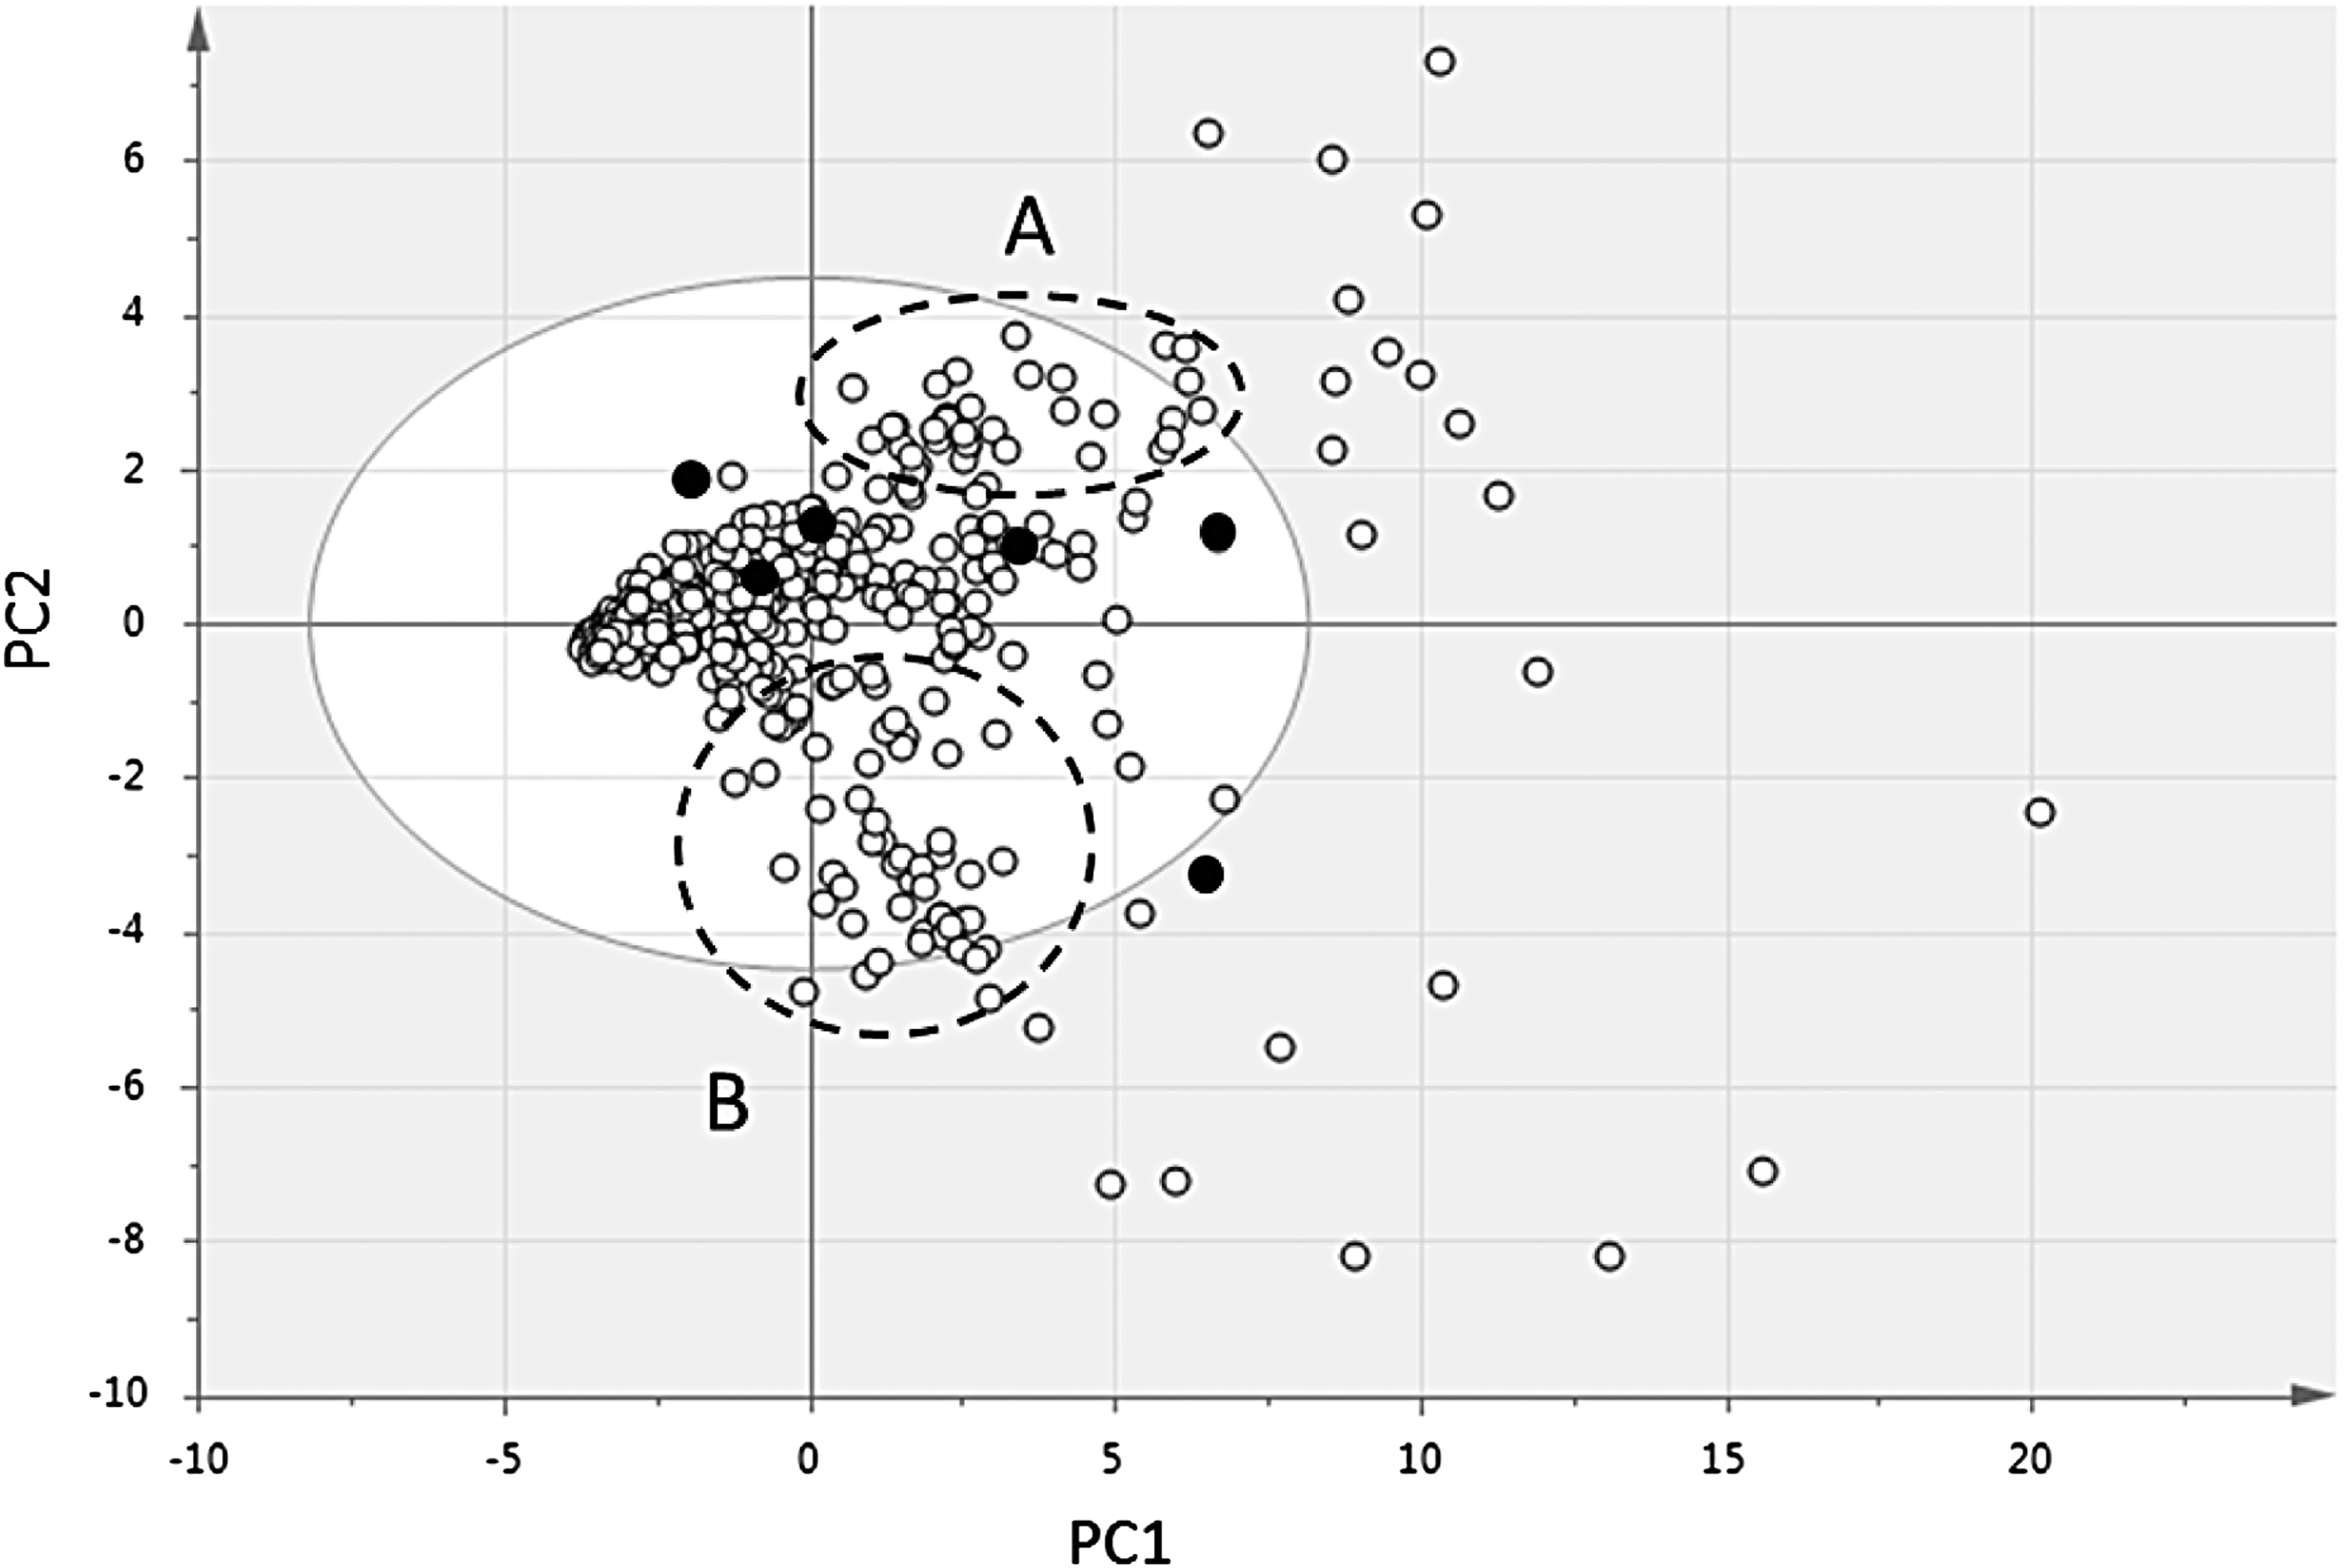
Same plot as Figure 1, but indicating currently available Dutch pharmacy products (•). Two regions not covered by currently available products are indicated by dotted circles
Parallel to this development, a Dutch patient activist group (Foundation PGMCG, Tilburg, The Netherlands) was campaigning for the introduction of a new cannabis type into the national cannabis program. Based on their personal experiences with the effects of various types of cannabis, they independently identified an Amnesia-type of cannabis to be missing from the spectrum of currently available varieties. Interestingly, this group was not aware of this study we were performing at the same time, which means that our own chemical testing and independent patient experiences both pointed toward Amnesia as a missing variety, simultaneously. This example indicates how real-life experience with medicinal cannabis can be fully compatible with the chemical analysis highlighted in our study, indicating the practical use of the chemovar approach. Together with the patient group, we were able to identify a cannabis variety that displayed the desired chemical profile. The variety is currently being prepared for standardized cultivation and is intended to be introduced as a new medicinal product on prescription later this year.
We are currently working on identifying a cannabis variety that has the proper chemical content of terpenes and cannabinoids to match with region B (Fig. 3). Such a variety would simultaneously need to display the desired botanical characteristics to be cultivated on a large scale (e.g., yield of flowers per plant, pest resistance, growth speed, and maximum size).
Conclusion
With modern analytical techniques, the rapid and comprehensive analysis of all cannabinoids and terpenes present in cannabis products has become a feasible option. This opens up the way to move from a confusing system of using vernacular cultivar names for the identification of cannabis products toward a more reliable and informative system of science-based chemovar classification. In our study, we successfully applied this approach for cannabis differentiation. By analyzing 44 major cannabinoids and terpenes, hemp types of cannabis could be efficiently distinguished from drug-type cannabis based on PCA of the resulting GC data. Hemp accessions showed a relatively conserved chemical profile characterized by the presence of relatively more CBD. In contrast, drug accessions showed a much wider chemical diversity with all cannabinoids (except CBD) as well as terpenes present in much higher concentrations than in hemp. An additional distinction was found between drug accessions characterized by higher content of monoterpenes, versus a group that contained significantly higher content of sesquiterpenes. Potentially, this difference may be caused by evaporation of the relatively more volatile monoterpenes during drying and storage of some of the analyzed cannabis accessions. 33
Using a supervised PCA methodology, vernacularly labeled Sativa and Indica accessions could be well separated into two distinct groups, which means that true differences seem to exist in chemical composition between these two types of cannabis. In contrast to popular belief, the Sativa and Indica types did not differ in their average content of the major cannabinoids THC or CBD. Instead, only CBC and CBG content was slightly but significantly higher in the Sativa group (p<0.05). More prominent differences between the two groups were found in the terpene composition, specifically in the presence of hydroxylated terpenes associated with the Indica group. Interestingly, several other studies have associated the Indica type of cannabis with such terpenes, including guaiol and eudesmol, 34 fenchol, alpha-terpineol, linalool, geraniol, and camphor, 24 and linalool. 20 Based on these results, we believe that hydroxylated terpenes are good chemical markers for the identification of (vernacular) Indica cannabis types.
We speculate that the functional link between cannabis phenotype and hydroxylated forms of terpenes may be found in gibberellic acid (GA); a pentacyclic diterpene acid, and therefore, a hydroxylated terpene itself. It should be noted that many subtypes of GA exist. These hormones promote growth and elongation of cells, and their effect on cannabis development has been observed by scientists43–45 as well as cannabis breeders. 46 Possibly the biosynthetic pathways for GAs and for hydroxylated terpenes share a common precursor in cannabis. Alternatively, the same catalytic enzymes may be involved in their biosynthesis, such as a cytochrome P450 monoxygenase 47 or terpene hydroxylase. 48 Human selection over centuries of cannabis use may have led to a coevolution of plant morphology (plant shape and size) and terpene profile (reflected in smell, taste, and medicinal effects) with GAs as the connecting factor. Further research in live cannabis plants should be performed to further test this hypothesis.
As a major limitation, we should note that our study was based on the analysis of cannabis accessions collected specifically in The Netherlands. The obtained results may be different when samples from other regions are analyzed for chemical content. Although in total, more than 120 terpenes have been identified in various cannabis products so far, 16 our data suggest that most of these are only present in trace amounts. The 36 terpenes analyzed in our study (Table 1) seem to cover the whole range of terpenes found in significant quantities, at least in the samples obtained from our sources in The Netherlands. Nevertheless, it is possible that samples from other regions would contain other terpenes as prominent constituents. As a result, the mapping of cannabis diversity may be a constantly evolving effort. New accessions added will make the current map more complete but could also open up new chemical “territories” that are currently unknown.
Of course, the basis for any evaluation system based on chemical profiling is that all cannabis constituents of interest are unambiguously identified. Because of the large number of terpenes that exist (currently >20.000 are known) and the large overlap in their chemical structures and molecular weight, there is a risk that reported compounds may not be properly identified. For example, despite earlier reports of their presence in cannabis samples, the terpenes gamma-terpineol, 8 phytol,16,20 carvacrol, 49 and geraniol24,49 could not be detected in any of our samples. Furthermore, a recent article by Aizpurua-Olaizola et al. 50 used a GC method almost identical to ours, but reported multiple terpenes that were not found or identified in our study. To address such discrepancies, there is a need for a widely accepted and unified method for terpene analysis in cannabis, to make comparison between different studies more reliable.
To conclude, it is essential that future cannabis commerce allows complete and accurate cannabinoid and terpene profiles to be available. 51 When the emerging cannabis industry adopts a common chemical language across producers, processors, and retailers, the winners will be the patients. Based on our study, it may be concluded that GC-FID-based metabolomics is a comprehensive and effective method to monitor chemical diversity in cannabis. Achieving a practical, accurate, and reliable classification system for cannabis, including a variety registration system, will require significant scientific investment and a legal framework that accepts both licit and illicit forms of this plant. Such a system is essential to realize the enormous potential of cannabis as a multiuse agricultural crop and medicinal plant. Chemovar mapping may be exactly the tool needed to achieve this goal.
Footnotes
Acknowledgments
The Trimbos Institute (Utrecht, The Netherlands) is kindly acknowledged for collecting most of the coffeeshop samples used in this study, during their annual evaluation of potency of coffeeshop cannabis (![]() ). We are grateful to the Plant Metabolomics Lab (Leiden University, The Netherlands) for help with the PCA.
). We are grateful to the Plant Metabolomics Lab (Leiden University, The Netherlands) for help with the PCA.
Author Disclosure Statement
No competing financial interests exist.