
Abstract
Introduction:
The price of cannabis has major implications for public health, public safety, social equity, and government revenues. This article examines prices and sources of purchased dried cannabis flower among consumers facing different state laws in the United States.
Methods:
Repeat cross-sectional survey data were collected from the International Cannabis Policy Study in 2019 and 2020. U.S. respondents were recruited through online commercial panels, ages 16–65, and purchased dried flower in the past year (n=9766). Weighted binary logistic regression models examined legal purchasing in states that had legalized recreational cannabis.
Results:
Compared with respondents in states with recreational stores, respondents living in “illegal,” “medical,” and “recreational” states without stores were associated with paying a higher unit price of dried flower (+20.5%, +23.6%, +27.4%, respectively; all p<0.05). The majority of respondents in states with recreational stores last purchased from stores/dispensaries (2019: 66.6%; 2020: 62.0%) and the odds of purchasing legally was greater with each additional year after stores opened (adjusted odds ratio=1.48, 95% confidence interval: 1.37, 1.60).
Conclusions:
Cannabis prices and purchase behaviors are strongly influenced by its legal status and presence of stores. After states legalize for recreational purposes, it takes multiple years for the legal market to become established as the number of retail stores increase and prices decrease. The findings demonstrate that consumers use sources that they are legally allowed to access, suggesting an increased number of physical retail stores and online delivery services could expand uptake of legal sources in states with recreational cannabis laws.
Introduction
Although cannabis remains illegal at the federal level in the United States (U.S.), many U.S. states have been liberalizing their cannabis policies for decades. As of October 2021, 19 states and the District of Columbia had legalized or passed laws to legalize nonmedical (hereafter “recreational”) cannabis, and 29 states recognize the therapeutic value of cannabis through either a high-cannabidiol-only law or full-blown medical allowances, leaving only three states without any legal market for medical or recreational purposes. 1 More states are expected to allow recreational cannabis sales in the near future.
States vary in how they provide legal access to recreational cannabis. For example, laws differ in terms of possession limits, cultivation, taxes, retail sales permitting process and delivery allowances, and even sales limits.2,3 In most jurisdictions, consumers can access recreational cannabis through home grow (except Washington State), gifting and sharing, and retail stores (with exceptions, e.g., District of Columbia). A few states also allow online delivery of recreational cannabis.
Some level of illegal cannabis sales persists in states that have legalized recreational cannabis, whether that be illegal cannabis sold in-state or legal cannabis exported out-of-state.4–8 For example, when triangulating findings from sales data and self-reported data in Washington State 2016–2017, researchers demonstrated that consumption outweighed legal sales 3 years after the stores. 5 However, the size of the illegal market and potential differences between states has yet to be examined.
The price of legal cannabis may influence the demand of both illegal and legal cannabis. Through increased production, efficiency, and reduced risks, the price of cannabis is hypothesized to decline in a legal recreational market after initial shortages, and there is evidence to suggest prices have declined in states with older recreational markets.2,8–10 For example, the retail price of cannabis declined in the initial years of retail markets opening in Colorado, Washington, and Oregon.2,7–9 Just as retail prices fall in legal recreational stores, it is possible that economies of scale associated with production in legalized environments and/or lower legal risks associated with producing cannabis generate lower costs for illegal cannabis as well.
Lower prices may encourage consumers to transition to the legal market; however, prices that are too low may encourage initiation, encourage more frequent use, reduce tax revenue (due to reliance on excise and ad valorem taxes), or discourage small businesses from entering or remaining in the market due to smaller profits, which could have implications for social equity programs.11–13
Previous research has examined the price of dried flower in U.S. states that have legalized recreational cannabis using self-reported data and objective data taken directly from retailers, predominantly in Washington State.2,9,10,14 However, limited research exists examining the price of dried flower and sources used in legal versus illegal markets.2,15 Evidence is needed to ascertain who is willing to purchase from illegal sources in legal markets and what factors contribute to consumers' willingness to purchase legally when both legal and illegal markets are available.
The aims of the study were to (1) examine dried flower purchases by source and quantities purchased; (2) describe the price of dried flower across cannabis laws; (3) examine the association between price, time since legal retail sales, and legal purchasing in U.S. recreational states.
Methods
Repeat cross-sectional data are from the International Cannabis Policy Study (ICPS), conducted in Canada and the United States. Data were collected through self-completed web-based surveys conducted in September–October 2019 and 2020 with respondents 16–65 years of age. Respondents were recruited using nonprobability sampling methods through the Nielsen Consumer Insights Global Panel and their partners' panels. Email invitations with a unique link were sent to eligible panelists. Median survey time was 25 min in 2019 and 21 min in 2020. Respondents provided consent before completing the survey. Respondents received remuneration in accordance with their panel's usual incentive structure.
In 2019, 81,263 respondents accessed the survey link, of whom 51,087 completed the survey for an American Association for Public Opinion Research (AAPOR) cooperation rate of 62.9%. 16
In 2020, 78,438 respondents accessed the survey link, of whom 48,633 completed the survey (62.0%). 16 In comparison, the National Survey on Drug Use and Health (NSDUH) reported an interview response rate of 64.9% in 2019. 17 The current study reports data only from U.S. respondents who had consumed and purchased dried flower in the past 12 months. The study was reviewed and approved by the University of Waterloo Research Ethics Committee (ORE no. 31330). A full description of the study methods can be found elsewhere.18–20
Measures
Sociodemographic measures
Sociodemographic measures included in this study were sex, age group, ethnicity/race, highest education level, perceived income adequacy, and suspected device type used to complete survey. See Supplementary Table S1 for full coding of response options.
Cannabis use frequency
Cannabis use frequency was categorized to: “Less than monthly,” “Monthly,” “Weekly,” and “Daily/almost daily.”
U.S. cannabis laws
“Illegal” states were defined as states without medical or recreational cannabis laws at the time of survey. “Medical” states were defined as those with medical cannabis laws on or before the survey in each year. “Recreational” states were defined as those with recreational cannabis laws on or before the survey in each year.
In many states, there is a delay between the date of legalization and the date retail stores open; therefore, “recreational” states were further categorized as those that had retail stores on or before the survey in 2019 (Alaska, California, Colorado, Nevada, Oregon, Washington) and those without (Maine, Massachusetts, Michigan, Vermont, District of Columbia). To note: respondents from Illinois were not included due to a change in cannabis legislation across 2019–2020.
Time since legal sales
Given delays in opening retail stores, we include a continuous variable measuring time (in years; e.g., 18 months=1.5 years) since recreational retail sales began compared with the date of the survey among recreational states with retail stores (Supplementary Table S2).
Legal purchases of dried flower in the past 12 months
Respondents were asked, “Overall, about what percentage of the dried flower that you used in the past 12 months came from LEGAL/AUTHORIZED sources?” Respondents could enter a number between 0% and 100%.
Source used to purchase dried flower at last purchase
Respondents were asked, “The last time you bought dried flower, where did you buy it?” with answers: “From a family member or friend,” “From a dealer (in person),” “Internet delivery service or mail order (delivered to me),” “From a store, co-operative, or dispensary (in person/curbside pickup),” and “Other.” “Other” responses were recategorized according to answers provided.
Legality of last purchase source
Respondents in recreational states who purchased from a physical or online store were asked: “What type of physical store/dispensary did you buy the dried flower from?” with answers: “A legal/authorized store,” “An illegal/unauthorized store/dispensary,” and “Other,” and “Where did you buy the dried flower online?” with answers: “An authorized/legal website,” “An unauthorized/illegal website, private delivery service/dealer,” and “Other.” “Other” responses were recategorized according to answers provided. “Don't know” responses were categorized into “Unknown.” All other sources were categorized according to state regulations in September 2019 and 2020 to “Illegal” and “Legal” (Supplementary Table S3).
Unit price of dried flower at last purchase
Respondent's price per gram (hereafter “unit price”) was calculated from two questions. First, respondents were asked, “The last time you purchased dried flower, how much did you buy…?” with answers starting at “1/8 gram or less” and ending at “More than 1 ounce.” Respondents also could answer in the weight of joints beginning at 0.2 g and increasing in 0.2 g increments to 1.2 g. Units were standardized into grams (g) and responses were treated as continuous. Second, participants were asked, “How much did you spend the last time you bought dried flower?” and respondents could provide numeric responses in an open-ended field.
To account for implausible values, unit prices above the 95th percentile were excluded (n2019=181; n2020=157) and values below the 1st percentile were winsorized to the 1st percentile (n2019=48; n2020=40). Prices in 2019 were inflated to 2020 prices using the 12-month change in Consumer Price Index from September 2019 to September 2020 (1.01%). 21
The full questionnaire is available in the ICPS 2019 and 2020 surveys (www.cannabisproject.ca/methods). All questions included “Don't know” and “Refuse to answer” options. Except “perceived income adequacy,” all “Refuse to answer” responses were set to missing. Except “perceived income adequacy” and “legality of last purchase source,” all “Don't know” responses were set to missing.
Statistical analyses
After exclusions due to poor data quality or duplicate entries (n2019=3095; n2020=2287), the samples comprised 30,479 and 29,345 respondents in 2019 and 2020, respectively. See Technical Reports for more detail on exclusions.18–20 The current analysis was based on the subsample of 9766 respondents who had consumed and purchased dried flower in the past 12 months. Respondents who had obtained their dried flower for free were excluded (n=4097). Respondents from Illinois were removed due to a change in cannabis legislation across 2019 to 2020 (n=307).
The sample for binary regression analysis was restricted to respondents from recreational states with stores and who were of legal age to purchase cannabis (21+ years).
Missing data were removed using case-wise deletion for variables in regression analyses for: legality of purchase source (n=73 [1.6%]); education (n=16 [0.3%]); ethnicity/race (n=103 [2.2%]); and unit price, either not providing a price or quantity to calculate unit price (n=733 [15.8%]) or an implausible value (n=135 [2.9%]). The proportion of respondents who had a valid unit price were more likely to be lower educated (χ 2 =9.1, p=0.028), find it difficult to make ends meet (χ 2 =27.4, p<0.001), be more frequent cannabis consumers (χ 2 =55.9, p<0.001), and completed the survey using a smartphone (χ 2 =6.5, p=0.040).
Poststratification sample weights were constructed based on the U.S. census estimates. Respondents from recreational states were classified into age-by-sex-by-state, education-by-state, region-by-race, and age-by-tobacco smoking status groups, while those from medical and illegal states were classified into age-by-sex, education, region-by-race, and age-by-smoking status groups. Separately for jurisdiction, a raking algorithm was applied to the cross-sectional analytic samples to compute weights that were calibrated to these groupings and rescaled to the sample size for each year.18,19 All estimates are weighted unless otherwise specified.
First, descriptive statistics described purchase sources and quantity purchased of dried flower by cannabis laws: illegal, medical, recreational without stores, and recreational with retail stores. Second, mean unit price of dried flower was estimated by jurisdiction, cannabis frequency, source, and quantity purchased. After a Box–Cox test was used to determine the appropriate transformation of the right-skewed unit price, two multiple linear regression models were fitted to examine the relationship between the natural log of unit price and (1) cannabis state laws and (2) recreational states only.
Third, a binary logistic regression model was fitted to examine the relationship between the percentage of dried flower purchased legally in the past 12 months and recreational states. Fourth, a binary logistic regression model was fitted among respondents in recreational states with retail stores who were of legal age to purchase cannabis to examine the correlates of legality of purchase source.
Sensitivity analyses were conducted, where unit price was removed as a covariate due to the bidirectionality of price also being dependent on purchase source (Model 2). Models were adjusted for sociodemographic variables and cannabis frequency. Adjusted odds ratios were reported with 95% confidence intervals. Analyses were conducted using survey procedures in SAS (SAS version 9.4, SAS Institute, Inc., Cary, NC).
Results
Supplementary Table S1 displays the weighted and unweighted sample characteristics of respondents in illegal, medical, and recreational states who had consumed and purchased dried flower in the past 12 months in 2019 and 2020.
Purchase source and quantity of dried flower at last purchase
Table 1 displays the characteristics of respondents who last purchased dried flower by cannabis laws in 2019 and 2020. Purchase source differed between jurisdictions in both years (2019: χ 2 =960.3, p<0.001; 2020: χ 2 =552.1, p<0.001). In illegal and medical states, dealers were the most commonly reported purchase source used in both years. In recreational states with stores, stores were the most commonly reported purchase source used in both years. Quantity purchased differed in medical states between years: more respondents purchased larger quantities in 2020 than 2019 (χ 2 =11.6, p=0.009). The median purchase amount of dried flower was between 3.3 and 3.6 g in all jurisdictions and years.
Purchase Source and Quantity of Dried Flower at Last Purchase Among Past 12-Month Cannabis Consumers in U.S. Illegal, Medical, and Recreational States 2019 and 2020 (n=9766)
Data are among consumers who reported purchasing dried flower in the past 12 months.
U.S. recreational (with stores) include states with recreational retail stores at the time of survey in 2019: Alaska, California, Colorado, Nevada, Oregon, and Washington State.
Data are % (n). Weighted %, unweighted n. Difference in unweighted sample sizes is due to missing data in purchase source (U.S. illegal states: n2020=3; U.S. recreational states: n2019=2, n2020=7), and quantity purchased at last purchase (U.S. illegal states: n2019=17, n2020=41; U.S. medical states: n2019=17, n2020=50; and U.S. recreational states: n2019=100, n2020=111).
SE, standard error; SEM, standard error of the mean.
Unit price of dried flower at last purchase
Table 2 displays the mean unit price of dried flower by cannabis laws based on characteristics of the individual or the purchase: cannabis use frequency, purchase source, and quantity purchased. The mean unit price of dried flower in recreational states without stores increased from 2019 to 2020 ($11.47 vs. $13.20; p=0.008). The change in mean unit price between 2019 and 2020 was not statistically significant for illegal, medical, or among recreational states with retail stores. Daily consumers paid the lowest prices in all jurisdictions. In recreational states with stores, consumers purchasing online/mail order paid the highest prices in both years. Price decreased as quantity purchased increased.
Unit Price of Dried Flower by Cannabis Use Status, and Purchase Source, and Quantity Purchased at Last Purchase (n=7909)
Data are among dried flower purchasers who provided a valid unit price of dried flower at last purchase.
U.S. recreational (with stores) include states with recreational retail stores at the time of survey: Alaska, California, Colorado, Nevada, Oregon, and Washington State.
Values suppressed for instances where cell counts are below n=30.
A linear regression model was fitted to examine the relationship between the log-transformed unit price of dried flower and cannabis state laws (Supplementary Table S4). After adjusting for covariates, respondents in illegal, medical, and recreational states without retail stores were associated with a 20.5%, 23.6%, and 27.4% increase in the unit price paid of dried flower compared with respondents in recreational states with retail stores, respectively (all p<0.05).
Legal purchases in recreational states in the past 12 months
Figure 1 displays the average reported percentage of dried flower purchased from legal sources in the past 12 months in 2019 and 2020 in recreational states. On average, respondents in recreational states with stores reported purchasing 74.0% and 76.9% of dried flower from legal sources in 2019 and 2020, respectively. In recreational states without stores, respondents reported purchasing 49.8% and 52.7% of dried flower from legal sources in 2019 and 2020, respectively. States with longer history of stores open showed higher percentages of purchases from legal retail outlets.
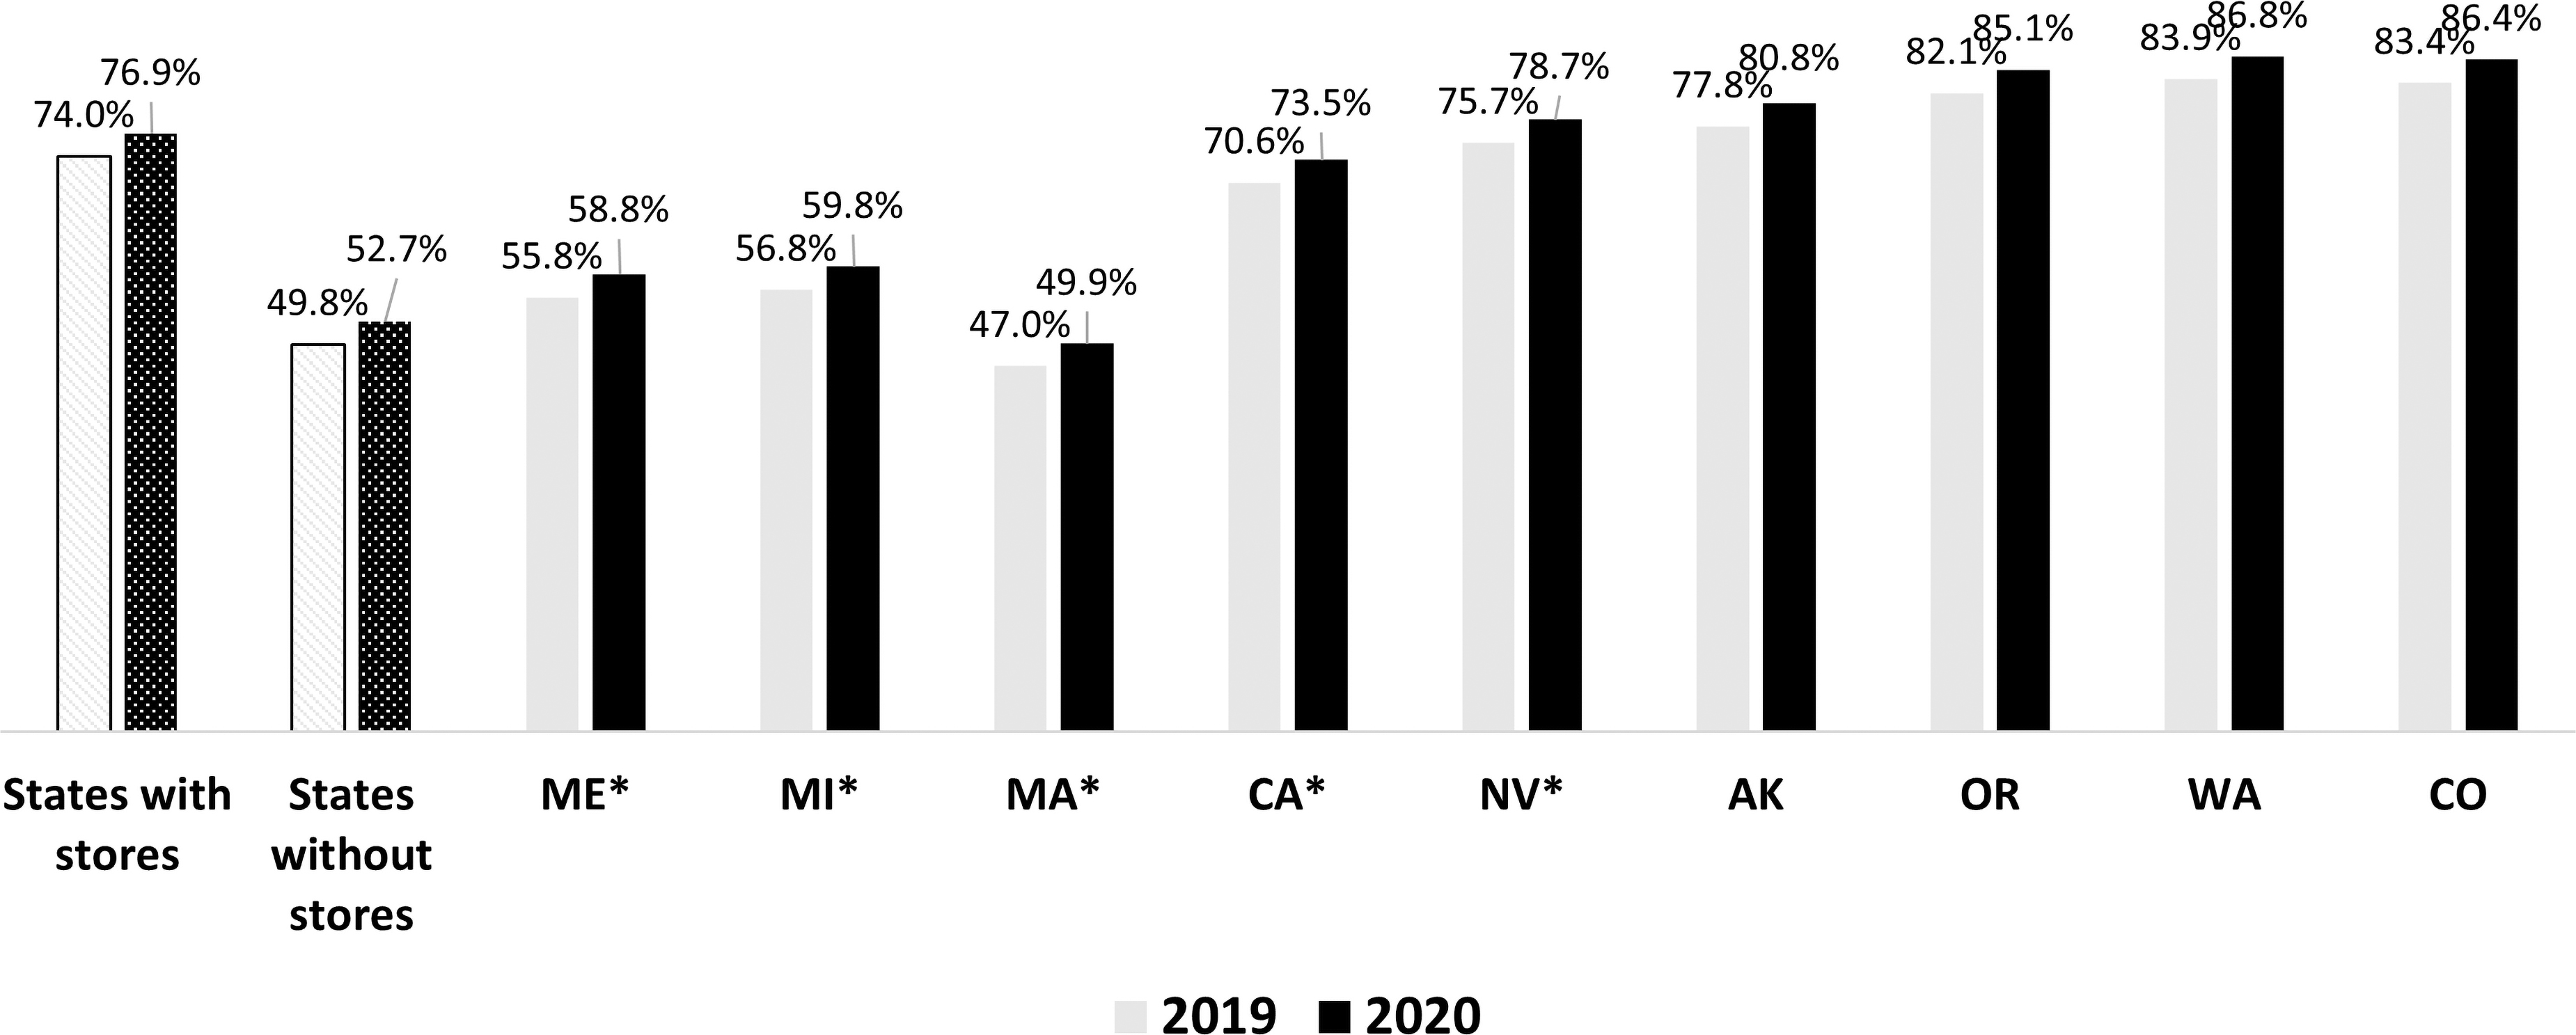
Average percentage of dried flower purchased from legal sources in the past 12 months by recreational state, positioned in order of length of time with legal retail sales, in 2019 and 2020 (n=5947). Figure displays adjusted percentages in each year. Weighted binary logistic regression model with 100% of dried flower purchased legally in the past 12 months (vs. <100%) as outcome: asterisks denote significant differences (*p<0.001) compared with reference group (Colorado). Model was adjusted for recreational state, survey year, frequency of cannabis use, sex, age group, ethnicity/race, education, income adequacy, and device type. Interaction between survey year and recreational states was not significant (F=1.79, p=0.058). U.S. states are positioned in order of length of time with legal retail sales. Note: Michigan did not have recreational retail sales until December 2019 and Maine did not have recreational retail sales until October 2020. Respondents from District of Columbia (n2019=26; n2020=47) and Vermont (n2019=39; n2020=26) are included within the collective “states without stores” value and linear regression model but are not shown individually due to low sample size. Missing data include those who answered “Don't know” or “Refuse to answer” (U.S. recreational states: n2019=438, n2020=255). AK, Alaska; CA, California; CO, Colorado; MA, Massachusetts; ME, Maine; MI, Michigan; NV, Nevada; OR, Oregon; WA, Washington State.
A binary logistic regression model was fitted to examine the relationship between the percentage of dried flower purchased from legal sources in the past 12 months and recreational states (Supplementary Table S5). Respondents in all recreational states, except Alaska, Oregon, and Washington State had lower odds of purchasing 100% of dried flower legally in the past 12 months compared with respondents in Colorado (all p<0.001).
Last purchase of dried flower in recreational states
Supplementary Table S6 displays the characteristics of last purchase within each recreational state in 2019 and 2020. Stores were the most commonly reported purchase source in both years. California had the highest percentage of respondents purchasing from online/mail order services. In recreational states, the majority reported purchasing dried flower from a legal source in both years, except respondents in states without retail stores as of 2019.
A linear regression model was fitted to examine the relationship between the log-transformed unit price of dried flower and recreational states (Supplementary Table S7). After adjusting for covariates, respondents in the District of Columbia (25.1%), Vermont (62.9%), Maine (42.5%), Michigan (47.1%), Massachusetts (54.2%), California (30.3%), Nevada (32.7%), and Alaska (24.5%) were associated with an increase in the unit price paid of dried flower compared with respondents in Colorado (all p<0.05). Respondents in Oregon were associated with a decrease in the unit price paid of dried flower compared with respondents in Colorado (−18.9%, p<0.001).
Binary logistic regression models examined the correlates of the legality of purchase source of dried flower among respondents 21 years of age and over in recreational states with recreational retail stores (Model 1 and 2; Table 3). In Model 1, each additional dollar paid per gram of dried flower was associated with 2% greater odds of purchasing dried flower legally. Each additional year with recreational retail stores was associated with 48% greater odds of purchasing dried flower legally. After adjusting for price and covariates, daily and monthly consumers were more likely to purchase dried flower legally than less than monthly consumers.
Weighted Binary Logistic Regression Analysis for Correlates of Legality of Purchase Source Used at Last Purchase in U.S. Recreational States Among Dried Flower Purchasers Over 21 Years
Statistically significant at the p<0.05 level in bold.
Data are from respondents 21 years of age and over in U.S. legal states with legal retail stores in September 2019.
An interaction between survey year and unit price was not significant in Model 1 (F1,4437=1.0, p=0.313).
Predictor “time with recreational retail sales” is a proxy for legal state.
AOR, adjusted odds ratio; CI, confidence interval.
In Model 2, unit price was removed as a primary predictor variable. Similar patterns emerged as Model 1, except that cannabis use frequency was no longer associated with legality of purchase source.
Discussion
The current study provides a comprehensive assessment of consumer purchasing behaviors in legal and illegal cannabis markets. Distinct differences in purchase sources were observed across U.S. jurisdictions. Consumers from illegal and medical states were substantially more likely to purchase dried flower from traditional illegal sources, such as dealers, than individuals living in recreational states. A greater percentage of consumers in medical states purchased from stores/dispensaries than those in illegal states, as expected.
Among recreational states with stores, consumers reported purchasing ∼80% of dried flower from legal sources in the past 12 months. Substantial differences were observed across states, with higher levels of legal purchases in states with retail stores compared with those without. For example, in Washington and Colorado, where recreational stores were open in 2014, consumers reported purchasing close to 90% of dried flower from legal sources.
In contrast, consumers reported purchasing <60% of their dried flower legally in Maine, Michigan, and Massachusetts in 2020, where recreational stores were allowed in 2020, 2019 and 2018, respectively, but with first stores not opening until 2020 in all three states. Respondents purchasing legally before retail stores opened could be from the legal medical market, as the current study did not differentiate between purchasing from legal medical or recreational stores.
Purchase sources also reflected differences in how retail sales are regulated across legal markets. California and Nevada, two of the few states to allow online delivery services for recreational cannabis, had higher percentages of respondents purchasing dried flower online.22,23
Among respondents in recreational states and of legal age to purchase cannabis, there were modest differences among consumers regarding the likelihood of legal purchasing, most notably that frequent consumers were more likely to purchase legally than less frequent consumers, but only after adjusting for price. The current findings demonstrate that consumers use sources that they are legally allowed to access, suggesting that an increased number of physical retail stores and online delivery services could expand uptake of legal sources.
Consumers paid more for dried flower in illegal, medical, and recreational states without stores, than recreational states with stores. Research has documented price declines in states that opened recreational stores.6,8,9,24 In the current study, prices varied across recreational states: Michigan and Massachusetts had some of the highest prices in 2020, and Oregon and Washington State had the lowest, which can be primarily explained by length of time in which recreational stores were open and potentially the number of stores open. Michigan opened its stores in 2020. In Massachusetts, while the first retail store opened in March 2020, retail stores closed for 2 months due to COVID-19.25,26
Comparatively, Oregon and Washington State both had the lowest prices in 2020 and are among the oldest, most well-established legal recreational markets. 27 Alaska had the highest unit price in 2020, potentially due to their high taxes. The relative prices across recreational states in the current study is similar to what was found in a 2020 industry report documenting wholesale prices. 27 From a public health perspective, lower prices in more mature markets are discouraging due to the potential impact they can have on initiation and heavy use. 24 However, competitive legal prices may be necessary to displace the illegal market.
These findings highlight that large price discounts exist when dried flower is purchased in bulk, and the importance of considering purchase amounts when reporting price estimates. Research has shown that discounts in legal markets tend to be more modest than those in illegal markets.9,28–31 However, quantity discounts followed a similar pattern in illegal, medical, and recreational markets in both years. The continued comparison between the price of legal and illegal cannabis is important to ensure consumers are retained in the legal market without compromising public health objectives.
Limitations
This study is subject to limitations common to survey research. Respondents were recruited using nonprobability-based sampling; therefore, the findings do not provide nationally representative estimates. The data were weighted by sociodemographic characteristics; however, compared with the national population, the U.S. sample had fewer respondents with low education levels and Hispanic ethnicity. National data for 2020 were unavailable at the time of writing; comparisons to 2019 data may not reflect secular increases in cannabis use from 2019 to 2020.
Potency was not included in the current study. Previous research has demonstrated an association between price and potency, and there has been recommendations to quantify price as a measure of tetrahydrocannabinol (THC) rather than grams or units. 10 However, the validity of self-reported THC data collected in population-level surveys has not been established.32,33
The current study examined dried flower purchases only. While dried flower remains the most consumed cannabis product and contributes to the largest proportion of sales in recreational states, evidence shows that dried flower consumption and sales are declining in favor of nonflower products.9,10,14,34 Future research should explore the association between nonflower purchases and legality of purchase source.
Cannabis laws vary across the U.S. Indeed, grouping states together may lose some of the nuance of the individual situation within each state, including the influence of neighboring states. The current study focused on recreational cannabis laws, with additional analyses on states with recreational retail stores as well as individual recreational states to capture added detail. Finally, cannabis purchasing behaviors could vary depending on whether cannabis was purchased for medical or recreational purposes. Further research should differentiate between purchasing from legal, medical, or recreational stores.
Conclusion
The findings suggest that purchase behaviors and unit prices are strongly influenced by the legal status of cannabis and how it is regulated in recreational markets. The findings also indicate that the transition to legal retail sources does not occur immediately following legalization; rather, the recreational retail market takes several years to become established, as the number of retail stores increase and cannabis prices typically decrease. Future research should examine the relationship between price and purchase sources for nonflower products, which account for an increasing proportion of the cannabis market share.
Footnotes
Acknowledgment
E.W. was awarded a PhD (University of Waterloo, 2021) in the course of the research included in this article.
Author Disclosure Statement
No competing financial interests exist
Funding Information
Funding for this study was provided by a Canadian Institutes of Health Research Project Bridge Grant (PJT-153342) and a Canadian Institutes of Health Research Project Grant. Additional support was provided by a Public Health Agency of Canada–Canadian Institutes of Health Research Chair in Applied Public Health (D.H.) and a Vanier Canada Graduate Scholarship (E.W.). The funders had no role in study design, collection, analysis or interpretation of the data, report writing, or decision to submit the report for publication.
Abbreviations Used
References
Supplementary Material
Please find the following supplemental material available below.
For Open Access articles published under a Creative Commons License, all supplemental material carries the same license as the article it is associated with.
For non-Open Access articles published, all supplemental material carries a non-exclusive license, and permission requests for re-use of supplemental material or any part of supplemental material shall be sent directly to the copyright owner as specified in the copyright notice associated with the article.