




Abstract
Introduction:
The administration of cannabinoids for disease and symptom management such as pain continues to elicit significant interest, albeit limited information that is available regarding their pharmacokinetics and pharmacodynamics to guide clinical practice. Cannabis-based medicines contain a wide variety of chemical compounds, of which the most common include the cannabinoids delta-9-tetrahydrocannabinol (Δ9THC), and the nonpsychomimetic cannabidiol (CBD). The pharmacokinetics of cannabis-based medicines and the effects observed depend on the formulation and route of administration. THC and CBD are subject to extensive first-pass hepatic metabolism and pharmacokinetic drug interactions, the latter via inhibition or induction of enzymes and transporters. This study was conducted to describe the pharmacokinetics of CBD, THC, and its metabolites following orobuccal administration, providing pivotal information to guide the clinical development program of a self-assembled micellized nanoparticle formulation containing 1:1 Δ9THC and CBD.
Methods:
Pharmacokinetic data was obtained from a phase 1, two-stage study in patients with advanced cancer, and modelled using a population pharmacokinetic approach. To provide an indication of predicted exposure with multiple dosing, the final population pharmacokinetic models were used to simulate concentration-time profiles for each of the active compounds.
Results:
The developed population pharmacokinetic models provided important information on the bioavailability of CBD and THC, with estimated values of 10% and 27%, respectively. These values were approximately two-fold greater than that which has been previously described for oromucosal formulations.
Discussion:
This enhanced bioavailability can most likely be attributed to the NanoCelle® technology. This technology provides evidence to support the application of this innovative drug delivery platform to overcome limitations associated with cannabinoid administration for therapeutic use.
Introduction
Despite advances in the treatment of cancer, cancer-related pain remains a significant burden affecting 64% of patients with advanced or metastatic disease. 1 To address this unmet clinical need, there has been growing interest in cannabinoids as a therapeutic option for the treatment of cancer-related pain. While evidence is still emerging, patient demand is high and cannabis use in the community is prevalent, with one in five patients having used cannabis in the preceding 6 months, of which approximately half use cannabis for cancer-related pain. 2 Nonetheless, trials of cannabis for cancer-related pain have demonstrated considerable variability in response. 3
It is important to recognize that the interpretation of previous clinical trials of the therapeutic use of cannabinoids is complex. Few well-designed, randomized, placebo-controlled, clinical trials have been conducted, and cross-study comparisons are confounded by the use of differing cannabinoids, differing formulations and administration routes, differing patient populations, and differing end-points. Interpretation of data generated by the use of plant-based cannabis products is further complicated by the impact of growing conditions, plant components, and mode of consumption on cannabinoid exposure. 4 These aspects highlight the importance of the examination of the potential benefit of cannabinoids through a traditional drug development pathway to establish the relationship between drug exposure and response, from which evidence-based treatment strategies can be identified.
Several administration routes have been explored for the therapeutic use of cannabinoids. Inhalation has traditionally been used for cannabis consumption; however, given the acute adverse effects and long-term damage associated with smoking or vaporizing,5,6 and difficulties controlling factors such as breath volume and hold, 7 medical and regulatory support for the development of inhalation formulations is limited. Oral administration of cannabinoids is a more actively pursued approach; however, administration is hampered by high lipophilicity, 8 and poor water solubility. 9 As such, poor dissolution in the aqueous contents of the gut, and extensive first-pass metabolism leads to low oral bioavailability.10,11 Given the unsatisfactory nature of oral and inhaled routes, additional routes of administration have been proposed; however, due to the lipophilic nature of cannabinoid molecules, drug delivery remains a challenge.
NanoCelle™, is a self-assembled micellized nanoparticle delivery platform, which offers the ability to deliver an active pharmaceutical ingredient via the orobuccal route. 12 Containing a hydrophobic core, and a hydrophilic shell, NanoCelle™ nanoparticles allow passive diffusion across the orobuccal membrane of small molecules, such as Vitamin B12. 13 The use of NanoCelle™ technology has now been expanded to include cannabinoids,14,15 and preliminary clinical trials have demonstrated a favorable safety profile and acceptable pharmacokinetic behavior, supporting further drug development.
Population pharmacokinetic approaches are becoming embedded in the drug development pathway to comprehensively describe pharmacokinetics characteristics and associated variability, from which both the design of subsequent clinical trials and future clinical use are informed. This study was therefore conducted to characterize the pharmacokinetics of cannabinoids administered via the NanoCelle™ orobuccal delivery platform (MDCNB-01; containing 1:1 delta‐9-tetrahydrocannabinol [Δ9THC] and cannabidiol [CBD]) in patients with advanced cancer experiencing uncontrolled pain, to inform further drug development.
Methods
Pharmacokinetic data were obtained from a phase I, two-stage study in patients with advanced cancer, which has been previously described. 14 Additional concentration–time data obtained after intravenous cannabinoid administration was extracted from previously published work.16,17
Ethical considerations
The clinical study was reviewed and approved by the institutional human research ethics committee. Participants were fully informed of the study procedures and provided written informed consent prior to study initiation. The study was conducted in accordance with the study protocol, the International Conference on Harmonisation Guidelines on Good Clinical Practice, and the Declaration of Helsinki. The clinical trial was prospectively registered on the Australian New Zealand Clinical Trials Registry (ACTRN12617001480370).
Study design
Orobuccal administration dataset
The phase I clinical trial comprised two study components, specifically an exploratory pharmacokinetic study (Stage 1) and a dose escalation study (Stage 2).
Stage 1 was a single-arm, two-dose study conducted to determine indicative pharmacokinetic parameters of CBD, THC, and their related compounds after buccal administration of MDCNB-01. Five patients with advanced cancer were recruited for study participation. Study participants received a single dose of 2 actuations of MDCNB-01 (2.5 mg THC + 2.5 mg CBD) on Day 1, and then a single dose of 6 actuations of MDCNB-01 (7.5 mg THC + 7.5 mg CBD) on Day 2. Blood samples were collected for pharmacokinetic analysis immediately prior to dosing (0 h), and then 0.5, 1, 1.5, 2, 2.5, 3, 4, 6, and 24 h after dose administration on Days 1 and 2.
Stage 2 was a single-arm multiple-dose study conducted to determine the pharmacokinetics of CBD, THC, and their related compounds after buccal administration of MDCNB-01. Twenty-five patients with advanced cancer with intractable pain not responsive to opioid analgesic medications were recruited for study participation. Study participants received 1 actuation of MDCNB-01 (1.25 mg THC + 1.25 mg CBD) every 4 h (while awake) on Days 1–3 and then, where appropriate, increased to 2 actuations of MDCNB-01 (2.5 mg THC + 2.5 mg CBD) every 4 h on Days 4–6, and 3 actuations of MDCNB-01 (3.75 mg THC + 3.75 mg CBD) every 4 h on Days 7–9. On Days 10–15 participants were administered an individually prescribed dose of MDCNB-01 (1, 2, or 3 actuations every 4 h). Follow-up assessments were conducted until Day 30. Blood samples were collected for pharmacokinetic analysis immediately prior to dosing (0 h) on Days 1, 4, 7, 10, 13, 16, and 30, as well as 1 h postdose on Days 10 and 13.
Plasma samples were quantified for CBD, cannabinol (CBN), THC, 11-hydroxy-Δ9-THC (OHTHC), and 11-nor-9-carboxy-Δ9-THC (COOHTHC) concentrations using validated liquid chromatography—tandem mass spectrometry method. 14 The lower limits of quantification of the CBD, CBN, THC, and OHTHC assays were 0.1 µg/L, and the lower limit of quantification of the COOHTHC assay was 1.0 µg/L.
Intravenous administration dataset
To aid in model development, data obtained after intravenous administration of CBD and THC was extracted from the literature.16,17
The CBD intravenous dataset included data from five healthy participants administered a single dose of deuterium-labeled 2H2-CBD (20 mg) via intravenous injection (over 2 min). 16 Blood samples were collected for pharmacokinetic analysis prior to dosing (0 h), and at 0.05, 0.1, 0.17, 0.25, 0.5, 1, 1.5, 2, 3, 4, 8, 12, 24, 48, and 72 h after dose administration. Plasma samples were analyzed for CBD concentrations using a validated mass fragmentography method with a lower limit of quantitation of 0.05 µg/L.
The THC intravenous dataset included data from nine healthy cannabis users who administered a single dose of deuterium-labeled 2H3-Δ1-THC (5 mg) via intravenous injection (over 2 min). 17 Blood samples were collected for pharmacokinetic analysis prior to dosing 0 h), then 0.2, 1, 2, 6, 8, 10, 12, 24, and 48 h after dose administration. Plasma samples were analyzed for THC concentrations using a validated gas chromatography-mass spectrometry method with a lower limit of quantitation of 0.1 µg/L.
Population pharmacokinetics
Population pharmacokinetic modeling and simulation were conducted using Phoenix® NLME™ Version 8.3 (Pharsight®, a Certara™ company). Given that the interconversion between CBD and THC and its metabolites has not been observed to occur in vivo, 18 separate population pharmacokinetic models were developed for CBD, and THC and its metabolites (OHTHC and COOHTHC). Estimates of the pharmacokinetic parameters and error terms were obtained by fitting concentration–time data using the Laplacian algorithm with epsilon—eta interaction estimation for all analyses. Plasma analyte concentrations below the limit of quantification of the assay were handled using the M3 method, as previously described. 19 Full details of the model development are available in Supplementary Appendix SA1.
One-, two- and three-compartment models with first-order absorption and elimination from the central compartment were explored, including models with delayed absorption such as those incorporating lag time and/or more complex absorption characteristics based on a chain of absorption transit compartments. The modeling approach involved the initial development of a population pharmacokinetic model for the parent compound, to which metabolite data were sequentially incorporated to produce a complete model describing parent and metabolite pharmacokinetics.
The pharmacokinetic models were parameterized (where appropriate) as clearance (CL), volume of distribution of the central compartment (Vc), intercompartmental clearance(s) (Q), volume of distribution of the peripheral compartment(s) (Vp), absorption rate constant (Ka), absolute bioavailability (F) and metabolism rate (M). The model incorporated population parameter variability (PPV) comprising inter- and intraindividual variability, and residual unexplained variability arising from such factors as experimental errors and model misspecification.
Once the base structural model had been determined, the contributions of continuous (e.g., age, body weight, height) and categorical (e.g., sex, ethnicity) covariates to PPV were assessed using a forward selection—backward elimination procedure.
Model selection was based on the objective function value (minus twice the log-likelihood of the data) as well as visual inspection of the standard diagnostic plots. The final population pharmacokinetic model was evaluated through prediction-corrected visual predictive checks (pcVPC) and bootstrap analysis.
Monte Carlo simulations
To provide an indication of predicted exposure with multiple dosing, the final population pharmacokinetic models were used to simulate concentration–time profiles for each of the active compounds (i.e., CBD, THC, and OHTHC). 20 Simulations were conducted for a representative in silico population of 1,000 individuals administered MDCNB-01 in accordance with the intended clinical use. The simulated treatment regimen specifically examined the administration of 2 actuations of MDCNB-01 (2.5 mg THC + 2.5 mg CBD) given at 8:00 am, 12:00 pm, and 4:00 pm each day over a 28-day treatment period. Simulated concentration–time data were used to derive estimates of daily exposure for each in silico patient, taken as the area under the concentration–time curve (AUC24) on Day 28.
Results
The final population pharmacokinetic analysis dataset comprised plasma concentration–time data obtained from 188 samples collected from 26 patients with advanced cancer who received MDCNB-01. The majority of study participants were Caucasian (84.6% Caucasian; 15.4% Asian) and female (65.4% female; 34.6% male). The average age, body weight, and height at baseline were 56.6 ± 12.2 years, 70.6 ± 18.8 kg, and 168 ± 12.0 cm, respectively. Only four quantifiable CBN concentrations were available, providing no evidence of THC degradation, and as such CBN was not included in the pharmacokinetic analysis dataset.
Population pharmacokinetics
Several modeling approaches were explored to develop a population pharmacokinetic model that would accurately describe the respective cannabinoid pharmacokinetics. Independent model development for the orobuccal administration datasets resulted in models that were considered unable to suitably describe the concentration–time data based on diagnostic plots and visual predictive checks. The inclusion of previously published intravenous data was then incorporated to assist in model development. Intravenous data was modeled independently, from which determined pharmacokinetic parameter values were used as initial estimates for subsequent modeling of the complete dataset. A summary of the key model developmental steps for the CBD and THC models is presented in Supplementary Table S1.
CBD population pharmacokinetics
The final model that best described the CBD concentration–time data was a three-compartment mammillary model, with first-order absorption and first-order elimination from the central compartment. Interindividual variability (IIV) terms were included on CL, Vp1, Vp2, and F, and interoccasion variability (IOV) was included on F and Ka. Residual variability was described by a proportional error model. No covariates were included in the final model. A schematic representation of the final model is illustrated in Figure 1, and the population pharmacokinetic model estimates are presented in Table 1.
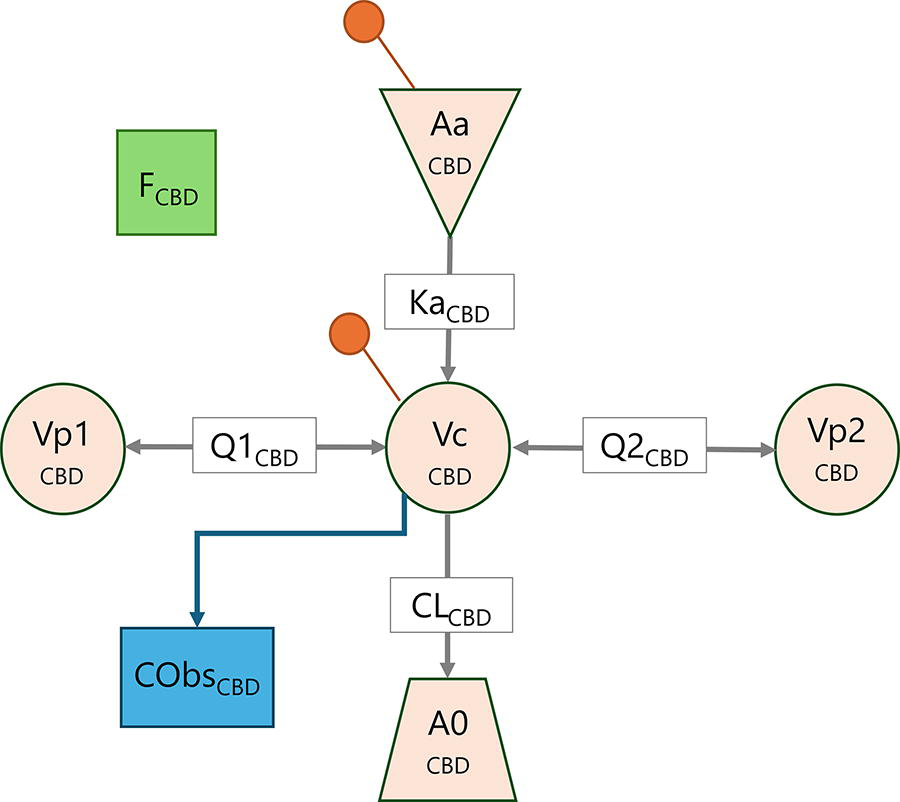
Schematic representation of the final CBD population pharmacokinetic model. Aa, buccal administered dose of CBD; A0, elimination compartment; CL, clearance from the central compartment; Cobs, observed concentration; F, absolute bioavailability; Ka, absorption rate constant; Q1, intercompartmental clearance from the first peripheral compartment; Q2, intercompartmental clearance from the second peripheral compartment; Vc, volume of distribution of the central compartment; Vp1, volume of distribution of the first peripheral compartment; Vp2, volume of distribution of the second peripheral compartment. The orange marker indicates the location of dose administration.
CBD Population Pharmacokinetic Model Estimates

CI, confidence interval; CL, clearance; CV, coefficient of variation; F, absolute bioavailability; Ka, absorption rate constant; IIV, interindividual variability; IOV, interoccasion variability; PPV, population parameter variability; Q, intercompartmental clearance; Vc, volume of distribution of the central compartment; Vp, volume of distribution of the peripheral compartment.
THC and metabolite population pharmacokinetics
The final model that best described the THC concentration–time data was a three-compartment mammillary model, with first-order absorption and parallel first-order elimination and metabolism to OHTHC from the central compartment. The pharmacokinetics of the metabolites were described by two-compartment models, with first-order elimination of OHTHC and COOHTHC from the respective central compartments, and metabolism of OHTHC to COOHTHC. IIV terms were included on F, CL, Q2, and Vp2 terms for THC; M, CL, and Vc terms for OHTHC; and M, CL, Q1, and Vp1 terms for COOHTHC, and IOV was included on F and Ka terms for THC. Residual variability was described by a power error model. No covariates were included in the final model. A schematic representation of the final model is illustrated in Figure 2, and the population pharmacokinetic model estimates are presented in Table 2.
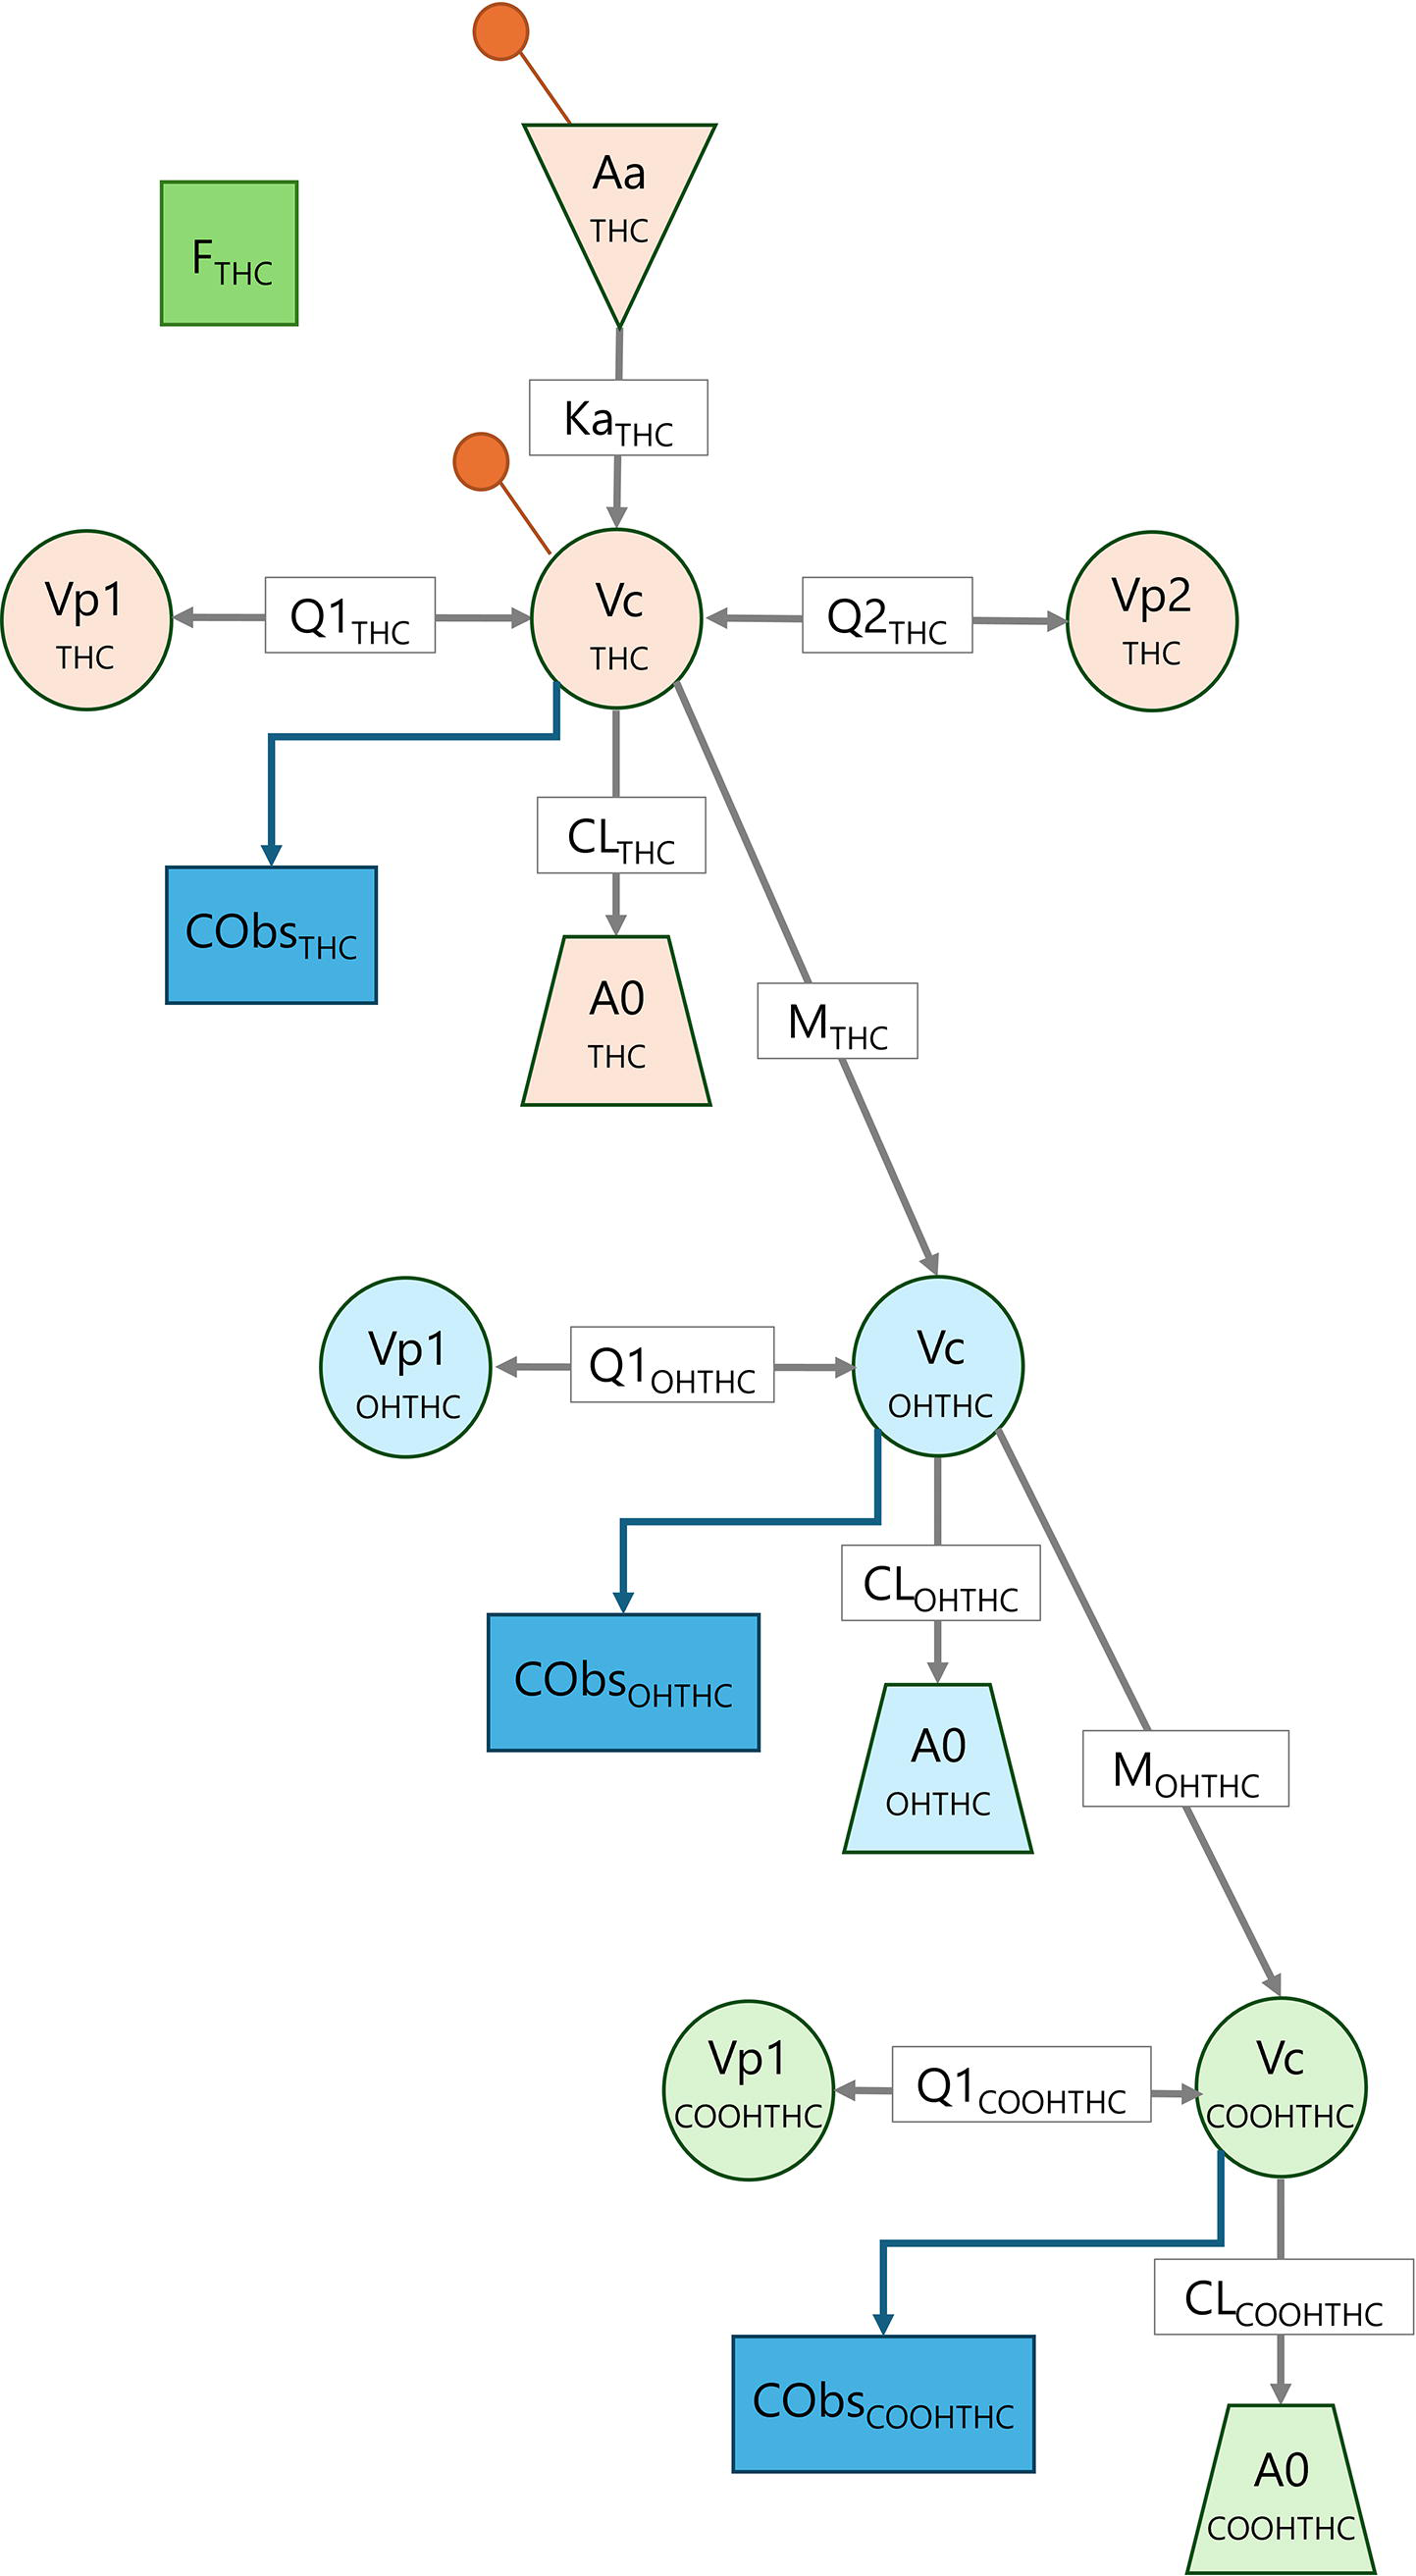
Schematic representation of the final THC and metabolite population pharmacokinetic model. Aa, buccal administered dose of THC; A0, elimination compartment; CL, clearance from the central compartment; Cobs, observed concentration; F, absolute bioavailability; Ka, absorption rate constant; M, metabolism rate constant; Q1, intercompartmental clearance from the first peripheral compartment; Q2, intercompartmental clearance from the second peripheral compartment; Vc, volume of distribution of the central compartment; Vp1, volume of distribution of the first peripheral compartment; Vp2, volume of distribution of the second peripheral compartment.The orange marker indicates the location of THC dose administration.
THC and Metabolite Population Pharmacokinetic Model Estimates

CL, clearance; CV, coefficient of variation; F, absolute bioavailability; Ka, absorption rate constant; IIV, interindividual variability; IOV, interoccasion variability; PPV, population parameter variability; Q, intercompartmental clearance; RSE, relative standard error; Vc, volume of distribution of the central compartment; Vp, volume of distribution of the peripheral compartment.
Model evaluation
Standard diagnostic plots for the final population pharmacokinetic models indicated uniform distribution and lack of bias (Supplementary Fig. S1). In all cases, the relationship between population predicted and observed concentrations was considered discordant, which was not evident for the relationship between individual predicted concentrations and observed concentrations owing to the large contribution of interindividual and IOV. The pcVPC supported the validity of the final model to describe the respective cannabinoid concentrations in this population, with close agreement between median and 90% prediction intervals (PIs) for the prediction-corrected observed and predicted concentrations (Supplementary Fig. S2).
Monte Carlo simulations
Monte Carlo simulations indicated substantial variability in predicted CBD, THC, and OHTHC exposure, as illustrated by the inconsistency between individuals (Fig. 3A), and broad PIs (Fig. 3B) for concentration–time profiles on Day 28.

Predicted concentration–time profiles for
Median predicted daily exposure (AUC24) after 28 days of dosing was estimated as 13.2 µg·h/L, 12.4 µg·h/L and 9.31 µg·h/L for CBD, THC, and OHTHC, respectively; however, considerable variability in AUC24 was predicted for all analytes (CBD 95% PI: 2.15–97.0 µg·h/L; THC 95% PI: 1.63–78.0 µg·h/L; OHTHC 95% PI: 1.43–74.0 µg·h/L) (Fig. 3C).
Discussion
Despite widespread use in the cancer population for the management of cancer-related pain, the use of plant-based cannabis products lacks the necessary quality standards and continues to be not recommended for medical use. 21 Further, data from poorly designed, uncontrolled trials using nonstandardized plant-based cannabis products clouds the literature and contributes to uncertainty surrounding the potential use of cannabinoids for the treatment of cancer-related pain. As such, there continues to be a place for the development of strategies for the optimal administration of cannabinoids, from which the evidence basis for their therapeutic use can be determined.
Given their high lipid solubility and associated inherent variability, the therapeutic efficacy and safety of pharmaceutical-grade cannabinoids will be highly dependent on drug absorption. As such, a greater understanding of cannabinoid pharmacokinetics is essential for its successful drug development. Population pharmacokinetics has been identified by the US Food and Drug Administration as a key component of the drug development pipeline, 22 and “at the center of the translation medicine paradigm.” 23 However, despite significant interest in the development of cannabinoids as potential therapeutic agents, only a few models have previously been developed to describe the population pharmacokinetics of CBD and/or THC.
Despite the focus on oral and oromucosal CBD and THC formulations for therapeutic application, existing models have predominantly described cannabinoid pharmacokinetics following inhalational administration.24–28 Lim et al. 29 reported the population pharmacokinetics of CBD administered as both oral (capsule, solution) and oromucosal (spray, drops) formulations; however, this was based on average study data and was therefore unable to adequately describe pharmacokinetic variability, a key benefit of population pharmacokinetic modeling. Heuberger et al. 30 described the pharmacokinetics of THC in a small number of healthy adults administered either inhalational or single dose oral formulations of THC, and a population pharmacokinetic model has also been described as part of the regulatory approval package for Epidiolex® (CBD oral solution). 31 However, no studies have described the population pharmacokinetics of cannabinoids via the orobuccal route. This study was therefore conducted to describe the pharmacokinetics of CBD, THC, and its metabolites following orobuccal administration, providing pivotal information to guide the clinical development program of MDCNB-01.
Both CBD and THC were best described by three-compartment models, with first-order absorption and first-order elimination from the central compartment. In keeping with the known physicochemical properties of cannabinoids,32,33 the peripheral compartments of each analyte comprised moderate (∼40–60 L) and large (∼3000–4000 L) volumes, reflecting distribution into the highly vascularized (i.e., muscle) and non-vascularized (i.e., adipose) tissues. This large volume of distribution contributes to a long terminal half-life for each of these cannabinoids, which has been poorly characterized in previous studies. 34 Nonetheless, this requires careful consideration with respect to the development of these compounds as therapeutic agents, contributing to extensive accumulation with chronic treatment and an extended time to achieve steady-state exposure. 35 On the contrary, OHTHC and COOHTHC pharmacokinetics were described by two compartmental models, with the peripheral volumes for each of these metabolites (47.2 and 67.4 L, respectively) comparable to the vascularized tissue compartments for CBD and THC. This is characteristic of the more hydrophilic nature of these metabolites, and their limited distribution into adipose tissue.
While the bioavailability of cannabinoids is not clearly defined, previous reports have suggested that the bioavailability of both CBD and THC after oromucosal administration is ∼6%,29,36 and appears to be comparable to that seen with oral administration. While it is expected that bioavailability would be enhanced with oromucosal delivery due to avoidance of first-pass metabolism, based on these findings it is conceivable that (at least in some instances) systemic exposure after oromucosal delivery may be reflective of gastrointestinal absorption after swallowing the oromucosal dose. In this study, the bioavailability values for CBD and THC were estimated as 10% and 27%, respectively, representing a two- to fourfold increase in bioavailability than that previously described.29,36 These enhancements in bioavailability could feasibly be attributed to avoidance of first-pass metabolism, where an increase in THC exposure would not be associated with a corresponding change in exposure for the active metabolite, OHTHC. Nonetheless, examination of the ratio of THC:OHTHC exposure in this study indicates that the enhanced bioavailability of THC is also accompanied by a substantial increase in OHTHC exposure, compared to that previously reported after oral administration. 37 As such, this enhanced bioavailability can most likely be attributed to the NanoCelle® technology; however, it should be noted that these results should be interpreted with caution given the inclusion of previously published intravenous data to support model development, which may have influenced the determination of model estimates. Nonetheless, this study provides evidence to support the application of this innovative drug delivery platform to overcome limitations associated with cannabinoid administration for therapeutic use and provides indicative data to support the design of future comparative pharmacokinetic studies.
Consistent with that previously reported,35,38 moderate to high variability in CBD and THC pharmacokinetic parameters was identified, which could not be accounted for by any covariates. While the IIV in pharmacokinetic parameters was consistent with that for most drugs across a range of therapeutic classes (∼40%) 39 intraindividual variability in bioavailability and absorption parameters was substantially higher (90–95%). Based on this, multiple-dose administration of MDCNB-01 over a 28-day treatment period is predicted to result in a ∼50-fold range in exposure to CBD, THC, and OHTHC across the population. Driven by large day-to-day variability in bioavailability, it is feasible that this reflects the method of drug administration, rather than entirely the variability in the inherent extent of absorption across the orobuccal membrane. Patient education on administration techniques to avoid swallowing will be critical to ensure optimal treatment and drug exposure with MDCNB-01 administration.
The pharmacokinetics of CBD and THC and its metabolites is critical to provide a clear understanding of drug exposure, and its association with treatment effect. This study provides pivotal information to support the development of MDCNB-01 as a novel formulation for the delivery of CBD and THC, and to guide future clinical use. Importantly, this work highlights the importance of the determination of pharmacokinetic characteristics as part of cannabinoid drug development, from which relationships between drug exposure and effect can be determined.
Authors’ Contributions
S.E.R., A.J.M., and L.V.: Conceived and designed the work. S.E.R., H.B.S., and A.J.M.: Acquired, analyzed, and/or interpreted the data. S.E.R., H.B.S., A.J.M., J.D.H., and L.V.: Drafted the work and/or critically revised it for important intellectual content. All authors have approved the final version to be published and agree to be accountable for all aspects of the work.
Footnotes
Author Disclosure Statement
L.V. and J.D.H. are former employees of Medlab Clinical Ltd. S.E.R., and A.J.M. received institutional research funding from Medlab Clinical Ltd. for the conduct of pharmacokinetic analyses associated with this work; no funding was received for article preparation.
Funding Information
The population pharmacokinetic analysis performed by S.E.R. and H.B.S. was funded by Medlab Clinical. Work undertaken by S.E.R. is with the financial support of the Cancer Council’s Beat Cancer Project on behalf of its donors, the State Government through the Department of Health, and the Australian Government through the Medical Research Future Fund.