
Abstract
Introduction:
The use of medical cannabis (MC) to treat a host of conditions has expanded considerably in the United States; however, precise quantitative assessments of purchasing characteristics are unknown. This study sought to characterize the trends in MC purchases, US dollars spent, and type and amount purchased by demographic and clinical characteristics.
Materials and Methods:
This descriptive exploratory association study examined statewide MC registry data in Arkansas linked at the person level with statewide transaction data documenting each MC purchase. MC transaction data (May 11, 2019–August 31, 2022) were assessed to identify persons who could be linked to the registry data and made at least one purchase. Individual demographic characteristics and MC qualifying conditions (QCs) were ascertained. Product types were classified into plant cannabis, cannabis extract for inhalation (vape), edibles, and others. The average daily total delta-9-tetrahydrocannabinol (THC) purchased was calculated based on the concentration and quantity purchased. Purchasing characteristics are described and demographic and clinical factors associated with THC purchased per day and dollars spent per year were estimated by ordinary least square regression and general linear models with a gamma distribution.
Results:
On average, 89,057 MC purchasers spent $3343 (interquartile range [IQR], $907–$4802), had 33.34 (IQR, 8.32–46.03) transaction days per year, and purchased 162.32 mg (IQR, 30.51–237.69) of THC per day. Most persons predominantly purchased plant cannabis (68.27%), followed by edibles (14.92%) and vape (11.96%). Individuals younger than 18 years of age (β=−78.23; 95% confidence interval [CI], −116.599 to −39.863), persons 70 and older (β = −122.30; 95% CI, −128.18 to −116.422), and women (β=−33.70; 95% CI, −35.95 to −31.446) purchased less THC per day than their counterparts after multivariate adjustment. The most common QCs were pain and post-traumatic stress disorder (PTSD), and compared to those with cancer, persons with pain (β = 26.30; 95% CI, 18.636–33.96) and PTSD (β = 38.34; 95% CI, 30.467–46.222) purchased more THC per day.
Conclusion:
The average THC purchased per person per day exceeds typically recommended daily doses for therapeutic uses, and further research is warranted to assess the safety and benefits of MC across these conditions.
Introduction
Cannabis is an understudied drug increasingly used for medical and recreational purposes with some form of legality in 38 states, 4 territories, and the District of Columbia as of 2024. 1 –6 In states where recreational cannabis use is legal, cannabis sales have more than doubled between 2019 and 2020 to roughly $11.6 billion, 7 and the US market for legal cannabis is estimated to reach $57 billion by 2028. 8
The use of cannabis for medical purposes, or medical cannabis (MC), varies significantly. In states where it is legal, variations exist in which medical conditions MC can be prescribed for and the limits on its purchase and possession. MC has been authorized to manage more than 30 conditions or diseases in some states, while in others, fewer than 10 conditions qualify. 9 Cancer or cancer-related nausea; pain, chronic or intractable pain, or painful conditions such as arthritis and migraines; spasticity; multiple sclerosis; epilepsy or seizures; and post-traumatic stress disorder (PTSD) are the conditions qualified in most states. Evidence supporting the use of MC and MC constituents is also variable. The US Food and Drug Administration (FDA) has approved synthetic cannabinoids or purified cannabidiol to treat nausea and vomiting due to chemotherapy, seizures, and loss of appetite or weight loss due to HIV/AIDS based on randomized controlled trials. For most other conditions, the evidence is mixed or of insufficient quality to provide clear guidance on where MC may be most effective. 10
In 2017, the National Academies of Science called for more research examining MC benefits and risks. 10 In August 2023, the Department of Health and Human Services recommended moving cannabis from Schedule I to Schedule III of the Controlled Substances Act, potentially opening the door to additional therapeutic uses. 11 The US Justice Department in May 2024 initiated the process of rulemaking. 12 Most noninterventional MC studies are based on self-reported MC use or biological drug screens and lack detailed information about products used, mode of ingestion, amount of delta-9-tetrahydrocannabinol (THC) consumed (in mg), or frequency of use. 13 –15 This information is essential to optimizing MC’s safety and effectiveness and avoiding unnecessary risks to public health.
In 2016, Arkansas approved MC allowing Arkansans with a state-issued MC card to purchase MC at an Arkansas-licensed dispensaries. 16 The patient obtains a state form that requires a signature from an Arkansas-licensed physician with a current Drug Enforcement Agency (DEA) number confirming completion of an in-person patient assessment and indicates which of the 18 qualifying condition(s) (QC) the patient has. The patient submits the signed form to the Arkansas Department of Health (ADH) and is issued a card authorizing MC purchases from an Arkansas-licensed dispensary. The card is valid for 12 months and must be renewed annually. For patients under 18 years old, a parent or legal guardian may apply for a caregiver card to make purchases on the patient’s behalf. A cardholder may purchase the equivalent of 2.5 ounces of “usable cannabis” every 2 weeks from an Arkansas-licensed dispensary. The first Arkansas (AR) dispensary opened in May 2019, and 38 dispensaries were operational by August 31, 2022.
Given the heterogeneous uses of cannabis and the lack of evidence to guide dosing and formulations across a range of conditions, this study provides a statewide examination of MC purchasing in a state that has recently made MC legal. This descriptive study profiles the mean daily THC purchased, the transaction frequency, and the dollars spent on MC by demographic and clinical characteristics of persons certified to purchase MC in Arkansas.
Materials and Methods
Data sources
This descriptive study utilized the Arkansas Department of Health MC Application File, or “registry data,” linked at the person level to the statewide MC transaction data and the laboratory sample file. The registry data describe patient and provider information, including MC QCs and demographic information for persons acquiring an MC certification, or “card,” allowing them to purchase MC. The MC statewide transaction data describe all MC purchases from the 38 dispensaries operational through August 2022. A statewide MC transaction data system was developed to allow dispensaries to monitor MC purchases to conform to the Arkansas Medical Marijuana Amendment of 2016, which limits purchases to 2.5 ounces of usable MC per 14-day period from state-licensed facilities. 16 These transactions describe the MC product type and quantity purchased, the purchase date, and the dispensary and were obtained directly from the statewide data vendor recording transactions from May 11, 2019 (Arkansas’s first dispensary opening date) through August 31, 2022. The laboratory sample file describes the THC potency for each product sold and was linked to the transaction data using a unique product identifier.
Personnel separate from the research team performed the person-level data linkages using a hashing algorithm to produce anonymous identifiers—“hashed ids”—from personal identifiers common in both data sources. Once these anonymous identifiers were constructed, personal identifiers were removed, and de-identified research files were exported to the research team. Since the research team only had access to de-identified data, the research was determined exempt by the University of Arkansas for Medical Sciences Institutional Review Board.
Study subjects
To characterize total statewide MC transactions and dispensary openings in Arkansas, all MC-certified subjects were included if they made at least one purchase between May 11, 2019, and August 31, 2022. To further characterize MC purchases, such as mean daily THC purchased and dollars spent on MC, and to explore the relationships between demographic/QCs and MC purchasing characteristics, subjects were included if they made at least one purchase between May 11, 2019, and September 1, 2021 (permitting at least 1 year of follow-up) and had at least one QC recorded on their registry application. These analyses also excluded persons with a missing birthdate, with missing or unknown sex, whose registry and transaction data were not linkable, and who did not make at least one purchase in which THC could be calculated.
Study measures
The transaction file classifies MC into the after product types: flower lot (loose flower weighed at the dispensary), usable cannabis (prepackaged cannabis), liquid cannabis-infused edible, solid cannabis-infused edible, cannabis extract for inhalation (vape), cannabis-infused topicals, suppositories, and tinctures. Product types were then more broadly classified into plant cannabis (flower lot and usable cannabis), edibles (liquid cannabis-infused edible and solid cannabis-infused edible), vape, and other (cannabis-infused topicals, suppositories, and tinctures). MC purchasers were classified into one of five groups (plant MC, edible, vape, other, and mixed) based on the maximum number of transactions across the product types. If two or more product types had an equal number of transactions as the maximum, they were classified as “mixed” MC purchasers. The total THC purchased was calculated by multiplying the THC concentration of each product by the quantity purchased in milligrams for plant MC and MC extract. For solid-infused edibles, the THC amounts were taken directly from the product names. THC concentrations were determined for usable cannabis, flower lot, vape, and solid-infused MC edibles, which collectively accounted for 98.25% of all transactions. Follow-up time and MC usage characteristics (e.g., THC, dollars spent, and number of transactions) were assessed beginning on each individual’s first purchase date and described through the study end date (August 31, 2022). To account for variable follow-up times, MC usage statistics are expressed in THC purchased per day, dollars spent per year, and number of transaction days per year by summing the MC-use statistics and dividing by the follow-up time expressed in days and years, respectively.
Demographic measures were self-reported on the MC registry application and are standard data elements collected by the ADH, the agency that issues MC cards. Race and ethnicity were categorized into Hispanic, non-Hispanic Black, non-Hispanic White, and Other. The Other race category included 1894 persons with unknown race and an additional 565 persons for whom the race and ethnicity fields were missing. Age was calculated based on the individual’s age on the date of their first MC transaction. There are 18 approved QCs to purchase MC, which are recorded in the registry data: cancer, glaucoma, HIV/AIDS, hepatitis C, amyotrophic lateral sclerosis, Tourette syndrome, Crohn’s disease, ulcerative colitis, PTSD, severe arthritis, fibromyalgia, Alzheimer’s disease, cachexia (or wasting syndrome), peripheral neuropathy, intractable pain, severe nausea, seizures, and severe and persistent muscle spasms. 17 Purchasers were classified based on all the QCs recorded using all their MC card registrations through the study end date. Because severe arthritis, peripheral neuropathy, fibromyalgia, and intractable pain are all painful conditions, these four conditions were grouped into a broader “pain” category, resulting in 15 QCs studied.
Analyses
Descriptive analyses based on percentages and mean values are provided. Because THC concentrations could not be determined for all transactions, analyses that report THC purchases excluded individuals who did not make at least one purchase for which THC could be determined. Chi-square goodness of fit tests and analysis of variance were used to provide unadjusted contrasts of MC purchase measures across demographic, predominant MC purchase type, and clinical characteristics for which MC was qualified. To contrast the MC purchasing characteristics by the predominant MC purchase type, the Student–Newman–Keuls multiple comparison test was used. Multivariable ordinary least squares (OLSs) models were estimated to provide measures of association between the demographic and clinical characteristics and the daily THC purchased and the dollars spent on MC per year. To develop mutually exclusive QC categories for the regression models, each of the 15 individual QCs was recorded if the subject had that QC without any other recorded QC. To account for persons who had multiple QCs, a category that combined pain and PTSD (the most common QCs) was recorded. For persons with two or more QCs that were not a combination of pain and PTSD, a multiple QC category was created. These QCs were compared to the referent, cancer alone. As sensitivity analyses, the models were also estimated with a gamma distribution and log identity function. Last, a weighted OLS model was estimated. Weights were calculated based on the ratio of follow-up time to the average follow-up time of 731.18 days to account for the influence of variable follow-up times where persons with shorter follow-up times would have less influence on the regression estimates. A significance level of α = 0.05 was used, and all data analyses were performed using SAS Enterprise Guide 8.3 (SAS Institute, Cary, NC).
Results
A total of 129,516 persons were certified to purchase MC, and 122,247 of those made at least one transaction throughout the study period of May 2019 through August 31, 2022. Since the first dispensary opened, the monthly transaction volume for plant cannabis paralleled the number of dispensaries opening, with rapid increases in plant cannabis transactions between November 2019 and November 2020, during which period the state expanded from 15 dispensaries to 33 dispensaries (Fig. 1). Plant cannabis was the dominant MC product type purchased, constituting 83.80% of all MC transaction days, followed by vape (29.87%), edibles (19.03%), and others (1.57%) in August 2022. 1 Arkansans purchased over 11.6 kg of THC and spent over $658 million on MC products. The monthly trends in the amount spent on MC and total THC purchased roughly paralleled monthly transaction days by product type (eFigs. 1 and 2).
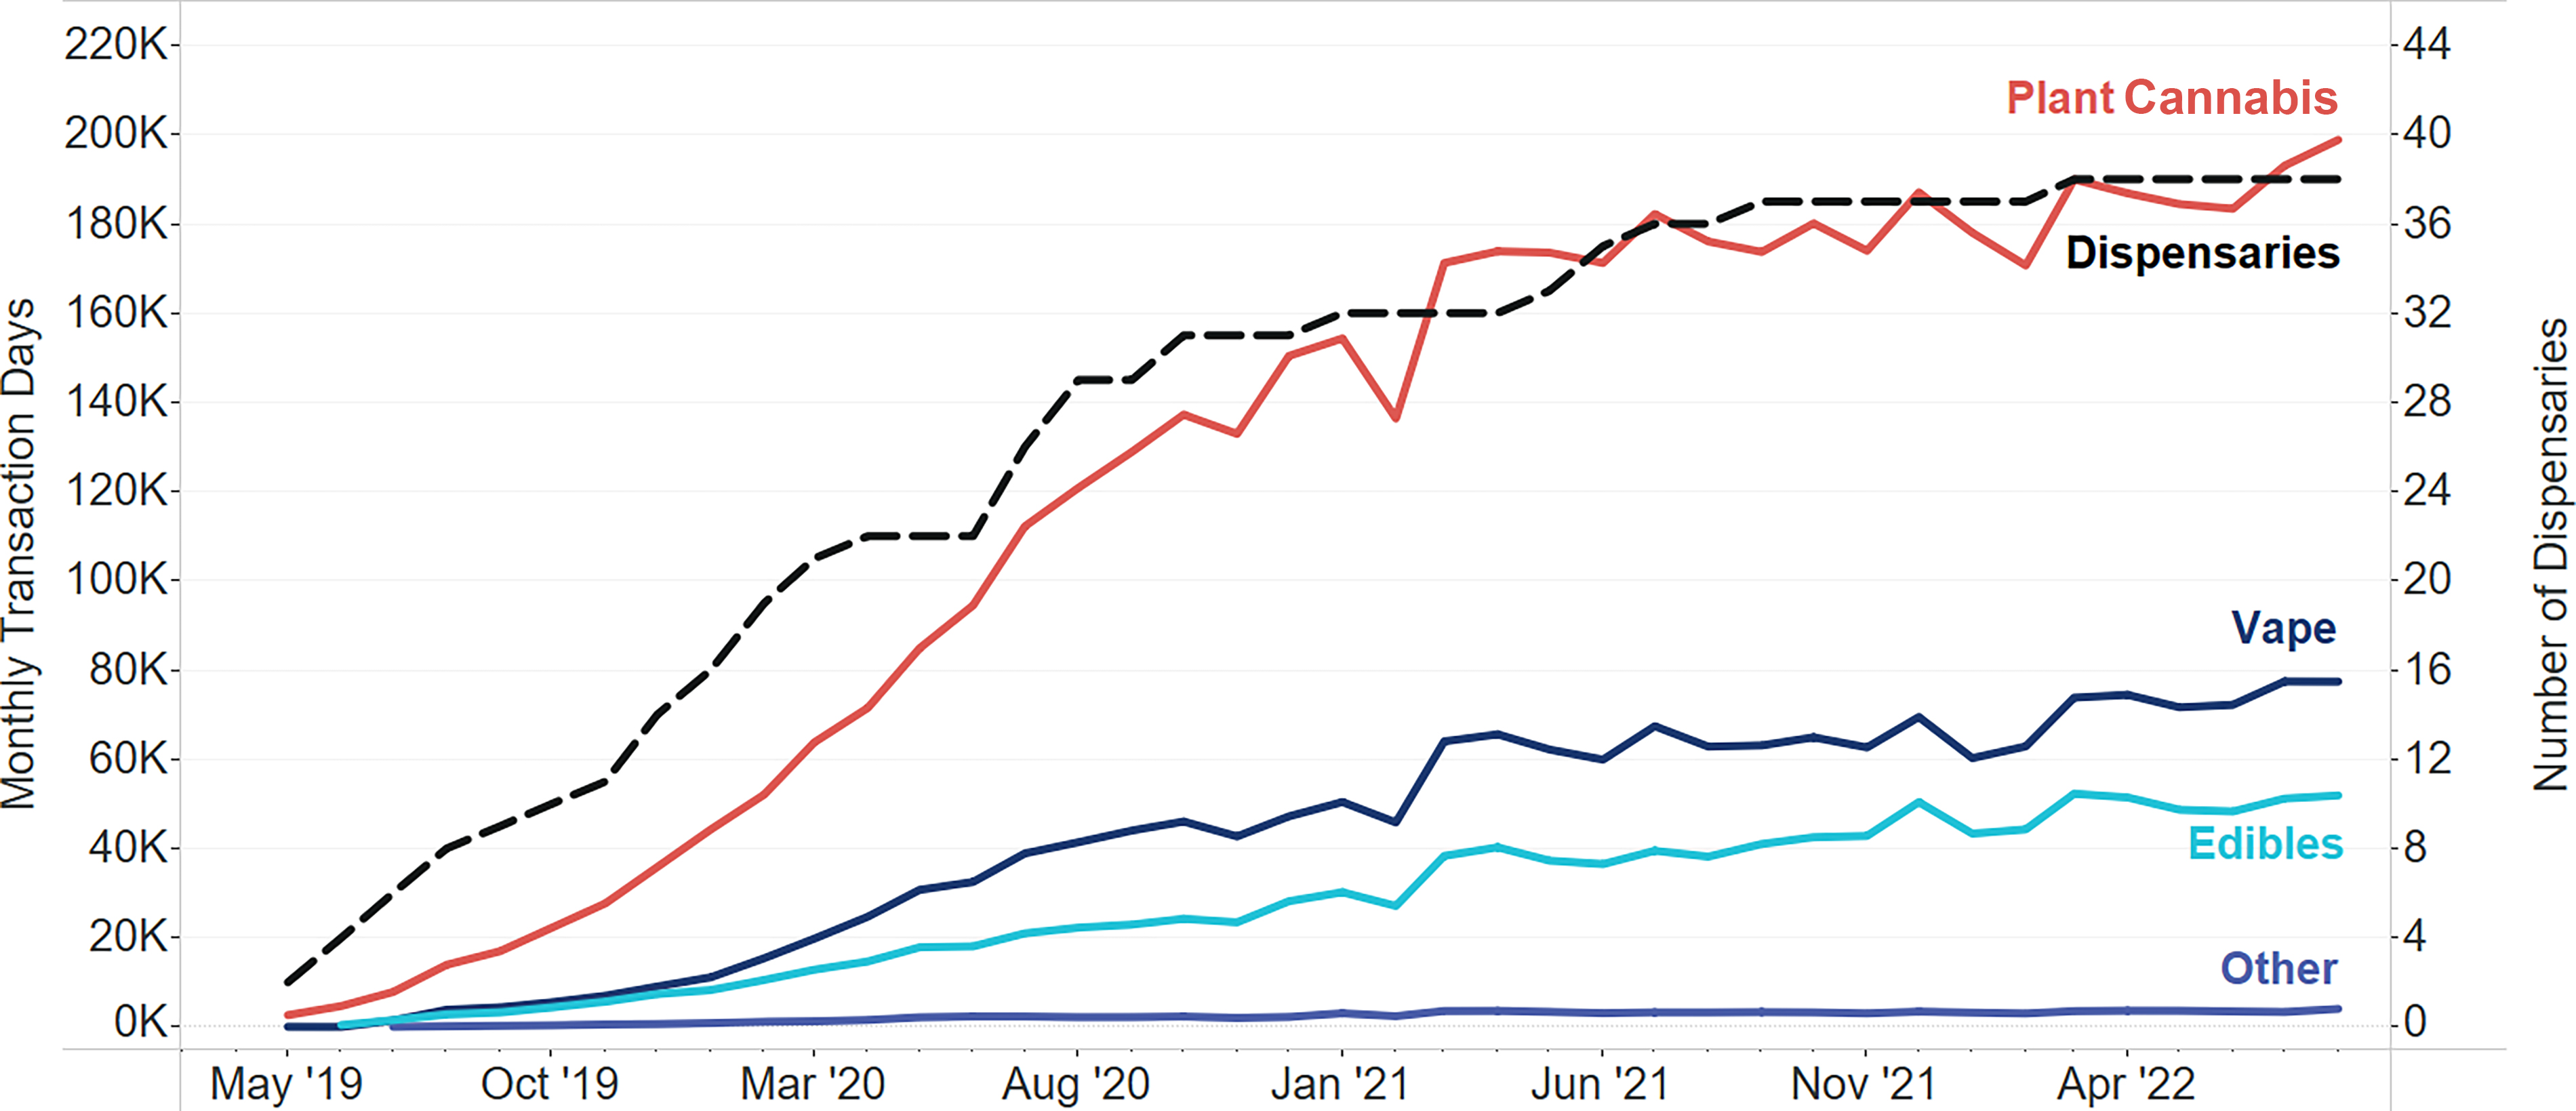
Total number of monthly transactions by product type and number of dispensaries (n = 122,247 purchasers) May 2019–August 2022.
After linking the transaction data to the registry data and applying exclusions for missing values, 89,057 persons who made at least 1 MC transaction were retained (eFig. 3 in Supplementary Data S1). Supplementary Data S1, eTable 1, contrasts the key demographics and MC purchasing characteristics between those retained in the analysis and those excluded due to missing information. The average age of retained MC purchasers was 45.5 years, while slightly more than half were female (51.88%), and most were non-Hispanic White (83.84%). Purchasers had on average 2 years of follow-up (731.18 days) between their first MC purchase and either loss of having an MC card or study end date (Table 1). The most frequently recorded QCs were pain (57.40%) and PTSD (43.09%).
Demographic and Clinical Characteristics of MC Purchasers
Sums do not equal total due to purchasers who have multiple qualifying conditions.
Number of persons with only pain and PTSD.
Number of persons who have two or more qualifying conditions that were not the specific combination of pain and PTSD.
HIV/AIDS, human immunodeficiency virus/acquired immunodeficiency syndrome; MC, medical cannabis; PTSD, post-traumatic stress disorder; SD, standard deviation.
On average, subjects purchased 162.32 mg (interquartile range [IQR], 30.51–237.69) of THC per day, had 33.34 days (IQR, 8.32–46.03) with one or more transactions per year, and spent $3343 (IQR, $907-$4802) per year on MC (Table 2 and eFig. 4). Most subjects predominantly purchased plant MC (68.27%), followed by edible purchasers (14.92%) and vape purchasers (11.96%). Plant MC purchasers purchased the most THC per day (206.62 mg) and visited dispensaries the most frequently, visiting approximately every 9 days. Vape purchasers spent more than any other type of purchaser spending $3881 annually. Those who predominantly purchased edibles, other MC forms such as tinctures, and mixed types of MC products all purchased less than 40 mg of THC per day, had fewer than 13 days with an MC transaction per year and, excluding mixed MC purchasers, purchased less than $2000 of MC per year.
THC Purchased per Day, Transaction Days per Year, and Dollars Spent on MC per Year by Predominant Type of MC Purchased
The Student–Newman–Keuls multiple comparison test shows that all contrasts are significantly different from each other except between those that purchase mixed types and edibles, global p-value <0.05.
The Student–Newman–Keuls multiple comparison test shows that all contrasts are significantly different from each other except between those that purchase mixed types and other, global p-value <0.05.
THC, delta-9-tetrahydrocannabinol.
After multivariate adjustment, age significantly and strongly influenced the amount of THC purchased per day, with persons aged 18–29 and those aged 30–39 purchasing the most, and designated caregivers for those younger than 18 and those 70 years of age and older purchasing the least (Table 3). Race and sex were also significantly associated with the amount of THC purchased per day, as women purchased about 33 mg less of THC than men, and all the non-White and Hispanic racial and ethnic groups purchased less than their non-Hispanic White counterparts, but the strength of the association was less pronounced than observed for age and sex. Relative to persons who only had cancer recorded as their QC, those who only had severe nausea, seizures, PTSD, pain, hepatitis C, and glaucoma purchased more THC per day. Those who had pain and PTSD recorded as QCs and those who had multiple QCs that were not the specific combination of pain and PTSD also purchased more THC per day.
Ordinary Least Squares Results of Factors Influencing Milligrams of THC Purchased per Day (n = 89,057)
Estimates for each qualifying condition when that condition is listed alone without any other qualifying condition listed on the cannabis card registry data, unless otherwise noted.
Pain and PTSD reflect the estimate when both PTSD and one or more of the pain conditions are listed on the cannabis card registry data without any other qualifying condition.
Multiple qualifying conditions reflect the estimate when two or more qualifying conditions are listed on the cannabis card registry data that are not the specific combination of PTSD and pain.
Similar relationships between demographic and clinical characteristics were observed for factors associated with MC spending as there were for THC purchased per day. Persons between the ages of 30 and 39, males, and non-Hispanic Whites all spent more than their respective comparison groups (Table 4). No group spent significantly less per year on MC than persons who had cancer alone. Those who had multiple QCs, those with PTSD and pain, and those who only had severe nausea, seizures, PTSD, or hepatitis C spent at least $500 more per year on MC than those with cancer.
Ordinary Least Squares Results of Factors Influencing Medical Cannabis Spending per Person Year (n = 89,057)
Estimates for each qualifying condition when that condition is listed alone without any other qualifying condition listed on the cannabis card registry data, unless otherwise noted.
Pain and PTSD reflect the estimate when both PTSD and one or more of the pain conditions are listed on the cannabis card registry data without any other qualifying condition.
Multiple qualifying conditions reflect the estimate when two or more qualifying conditions are listed on the cannabis card registry data that are not the specific combination of PTSD and pain.
Despite minor fluctuations in the strength of the associations, utilizing either a general linear model with a gamma distribution and log identity function or a weighted OLS regression model did not alter the significance or direction of the vast majority of the associations as reported in the main analysis (eTables 2–5 in Supplementary Data S1). The significance of the associations changed for those aged 30–39 years and Hispanics in analyses of THC purchased per day and for Hispanics and those with muscle spasms for analyses of dollars spent per year on MC.
Discussion
The average daily THC purchased with MC products is ∼162 mg per day per person but varies widely between subjects with an IQR of 31–238 mg per day. On average, persons make a purchase about every 11 days throughout a year and spend on average about $3300 per year. The MC purchasing and daily THC doses observed in this study are considerably higher than those reported in New York (NY). An examination of transactions obtained from four NY MC dispensaries from 2016 through 2020 found that the median THC purchased per day was 28 mg. 18 The NY sample was, on average, about 8 years older than in Arkansas, and given our findings, which show that persons older than 39 purchase less than their younger counterparts, could partially account for lower levels of THC purchased per day but is unlikely to account for most of the difference. Another notable difference between NY and AR that might partially account for the lower levels of THC purchased in NY is that NY requires certifying providers which include nurse practitioners and physician assistants to complete a state-approved education course and then register with the program NY MC program. AR does not require any MC-specific training or registration and only requires physicians to have a DEA license and patients may not receive as much guidance regarding MC doses in AR. Last, NY borders three states where recreational cannabis was legal in 2020, which could mitigate MC in NY from being used recreationally or diverted, whereas AR bordered no states in which recreational cannabis was legal. 19
The average daily THC purchased in this study (162 mg) far exceeds typical dosages of FDA-labeled THC-based products and is highest for those that predominantly purchase plant MC, which is primarily smoked. For example, the recommended dose of dronabinol, an orally administered synthetic THC compound, is 2.5 mg twice daily in capsule form that can be titrated to a maximum of 10 mg twice daily for anorexia related to AIDS and is 2.5 mg/m2 (∼5 mg for the average adult male) for up to six doses per day that can be titrated up to 15 mg/m2 to manage nausea and vomiting associated with cancer chemotherapy. 20 Nabilone, another synthetic cannabinoid for oral administration similar to THC has a starting dose of 1–2 mg with a maximum recommended daily dose of 6 mg per day for chemotherapy and induces nausea and vomiting. 21 It should be noted that the different forms of administering MC result in different bioavailability, making comparisons between product types challenging. Approximately 25% of smoked THC from plant MC and 10% orally ingested THC is ultimately delivered to the systemic circulation; however, orally administered THC undergoes first-pass metabolism and is converted to psychoactive 11-OH-THC metabolite. It is well recognized that acute cognitive impairment of THC is dose-dependent 22 ; however, the effects of higher doses used chronically are largely unknown.
There are a host of factors that can explain the relatively high average daily THC consumption observed in these data. Undoubtedly, a portion of the MC purchased has been diverted to other users for recreational or unqualified medicinal purposes. As an attempt to limit diversion, the constitutional amendment permitting MC in AR limits purchases of “usable marijuana” to 2.5 ounces over a rolling 14-day window. However, the amendment did not have language that placed limits on THC, and as a result, persons can purchase far more THC over a 14-day period if they purchase highly concentrated THC products such as vape cartridges than if they purchased plant MC. An estimate of the quantity of MC purchased legally that is being diverted could not be found in the published literature; however, the diversion of MC is not trivial and is likely to be substantially higher in states, like Arkansas, that have not legalized recreational cannabis. Based on US survey data, between 12% and 15% of past year cannabis users used diverted cannabis intended for others. 23 Among discharged inpatient psychiatric patients in Colorado prior to the legalization of recreational cannabis, the rates of self-reported diverted cannabis use approached 25%. 24 For states that want to expand access to cannabis but limit it to medical uses and discourage recreational use, strategies to limit diversion, such as THC-based quantity purchasing and possession limits, should be considered. Given the high mean THC purchased observed in this study, efforts to enhance provider education on THC dosing for therapeutic uses should also be considered as well as patient education from their providers.
Limitations
This study has several limitations. First, we could not determine a THC concentration for 1.75% of transactions (e.g., oils and tinctures); therefore, our estimates of THC purchased per day are slightly understated. To mitigate this, persons who exclusively purchased products for which THC could not be calculated were excluded from all analyses where THC is reported. Second, the MC measures only reflect purchases, not consumption. As in pharmaceutical trials and quality metrics, filling prescriptions or purchasing MC is presumed to correlate with actual consumption. However, there are many reasons MC purchased may not be consumed, including loss, spoilage, and importantly, diversion as previously discussed. Related, a significant proportion of plant MC is lost when smoked due to heat degradation and sidestream smoke. The purchasing patterns reflect one state’s experience requiring physician certification for 1 of 18 conditions where recreational MC is illegal. These findings are unlikely to generalize to other states with different requirements to purchase MC or where recreational cannabis is available. Last, this is an exploratory descriptive study that utilized sources limited to data captured in the physician certification process and subsequent individual purchasing behaviors; therefore, relationships described in this study are associations that do not infer causality.
Conclusions
In Arkansas, where MC recently became available, the average THC purchased per person per day far exceeds typically recommended daily doses for therapeutic uses. Persons aged 18–39, those with pain and PTSD, and those who primarily purchased plant and vape forms purchased more MC than their counterparts. It is unknown the extent to which MC is being diverted for recreational uses in a state where recreational cannabis is not legally available. However, diversion is potentially consequential given the quantity of MC purchase made by those certified to purchase MC. Further research is warranted to assess the safety and benefits of MC, particularly for those who may be consuming more than the doses studied in these conditions for which MC is qualified.
Footnotes
Acknowledgments
This study was a joint effort between ACHI and the UAMS Colleges of Medicine, Pharmacy, and Public Health. The authors would like to acknowledge Andrew Douglas for providing access to the data (formerly at Forian, Inc.). The authors would like to thank ACHI data and analytic personnel, including Kenley Money, MA, MFA, Director of Information Systems Architecture, and Gini Ingram, Senior Technical Business Analyst, for their contributions to this study. Additional thanks to Tim Holder and Kristina Johnson, MA, at ACHI for providing medical writing and editorial support. They also acknowledge the contributions of their Medical Cannabis Advisory Committee members Susan Ward-Jones, MD (East Arkansas Family Health Center); William Troutt, MD (Harvest, Inc.); Mike Wilson, MD, PhD, FAAEM, FACEP; Jonathan Goree, MD; Ari Filip, MD (all three with the University of Arkansas for Medical Sciences); and Namvar Zohoori, MD, MPH, PhD (Arkansas Department of Health).
Disclaimer
Neither the Arkansas Department of Health nor the Arkansas Department of Finance and Administration, Division of Alcohol Beverage Control, guarantees the accuracy of the information, and the views expressed in this article are not necessarily those of the Arkansas Department of Health or the Arkansas Department of Finance and Administration, Division of Alcohol Beverage Control.
Data Sharing Statement
Data are available with publication as an archived version of the deidentified analytical file used to complete the analyses for the article and will be maintained by the administrator of the Arkansas Healthcare Transparency Initiative. Data can only be accessed via established processes and requirements in accordance with the Arkansas Healthcare Transparency Initiative authorized through Arkansas General Assembly Act 948 of 2017 and after approval by the Arkansas Insurance Commissioner. Researchers whose proposed use of the data has been approved may solicit access to the data and will be directed to ![]() where they can initiate the process to acquire their own data use agreement to access the data.
where they can initiate the process to acquire their own data use agreement to access the data.
Authors’ Contributions
B.C.M.: Conceptualization (lead), data curation (equal), formal analysis (equal), funding acquisition (equal), resources (equal), software (equal), visualization (lead), and writing—original draft (lead). J.W.T.: Conceptualization (equal), funding acquisition (equal), project administration (equal), resources (equal), and supervision (equal). A.G.: Funding acquisition (equal). C.F.: Data curation (equal), formal analysis (equal), investigation (lead), software (equal), and visualization (equal). K.N.: Data curation (equal), formal analysis (equal), and software (equal). N.S.: Data curation (equal) and software (equal). J.R.D.: Visualization (equal). T.J.H.: Conceptualization (equal), funding acquisition (equal), project administration (equal), and supervision (equal). All authors contributed to methodology, validation, writing—review and editing, and critically revised the report or contributed important intellectual content.
Authors’ Disclosure Statement
B.C.M. reported receiving royalties from TrestleTree, LLC, outside the submitted work. T.J.H. reported receiving grants from the National Institute on Drug Abuse and grants from the Substance Abuse and Mental Health Services Administration (H79SM089075, H79TI086421, and H79TI086020) outside the submitted work. J.W.T. reported receiving grants from the National Institute of Mental Health (R01MH133857) and grants from the National Science Foundation (2304299) outside the submitted work. No other disclosures were reported.
Funding Information
This study was funded by the National Institutes of Health’s National Institute on Drug Abuse, grant #
Supplementary Material
Supplementary Data S1
1
Percentages sum to over 100% since the unit of analysis was transaction days, and persons could purchase more than one product type on any given day.