




Abstract
Objective:
The subgenual cingulate (SGC) cortex has been implicated in the pathophysiology of mood disorders. We sought to study morphometric characteristics of the SGC in pediatric subjects with familial bipolar disorder (BD) compared with healthy controls.
Method:
Twenty children and adolescents with BD (mean age = 14.6 years, 4 females) and 20 healthy age-, gender-, and intelligence quotient-matched controls underwent high-resolution anatomical magnetic resonance imaging. Patients were primarily euthymic and most were taking medications. SGC cortex volumes were determined by manual tracings from a reliable rater, blinded to diagnosis. Analyses of covariance were performed with total cerebral gray matter and age as covariates.
Results:
No differences were found in SGC volumes between BD subjects and healthy controls. Further analysis revealed that BD subjects with past mood stabilizer exposure had significantly increased SGC volumes compared with BD subjects without mood stabilizer exposure, and compared with controls. The increase was driven by larger bilateral posterior SGC volumes.
Conclusions:
Youth with familial BD do not appear to have abnormalities in SGC volume. Mood stabilizer exposure, however, may be correlated with increases in SGC volume.
Introduction
Using positron emission tomography and magnetic resonance imaging (MRI), Drevets et al. (1997) reported decreased activity and reduced SGC mean gray matter in subjects with familial unipolar and bipolar disorder (BD). Subsequent neuroimaging studies also reported decreased SGC gray matter in adults with familial unipolar depression and BD compared with psychiatrically healthy controls (HC) (Hirayasu et al. 1999; Sharma et al. 2003). However, other studies found no significant abnormalities in SGC volumes in patients with unipolar depression and BD (Brambilla et al. 2002; Bremner et al. 2002; Zimmerman et al. 2006). A meta-analysis of 10 volumetric MRI studies of SGC volumes in patients with unipolar depression and BD found no significant right or left SGC volume reductions in BD patients. However, patients with a family history of mood disorders had significant reductions in the left SGC volume, which was not found among subjects without a family history of mood disorders (Hajek et al. 2008a). Thus, reduced SGC volume may be part of a biological risk factor for a familial genetic syndrome (Hirayasu et al. 1999).
BD is highly heritable (Smoller et al. 2003) and children of affected parents are at high risk for developing psychiatric disorders, including pediatric onset BD (Chang et al. 2006). Pediatric onset BD includes more mixed episodes, psychotic symptoms, comorbid disorders, and confers a more severe and adverse illness compared with adult BD (Geller et al. 2002). Studying pediatric BD populations is important for discerning neurobiological markers and could lead to early identification of those at highest risk for BD development and a better understanding of the pathophysiology of BD. Furthermore, by the time children present with BD symptoms, it may be relatively late in the course of the illness for preventing progression of symptoms (Chang et al. 2006).
It is unclear whether abnormalities reported in neuroimaging studies of adults with BD are present in children and adolescents with BD. Only two studies of SGC volume have been reported in pediatric BD. Sanches et al. (2005) found no significant differences between familial BD patients and HC in right or left SGC volumes, although with a small sample and semi-automated measures of volume. Conversely, Baloch et al. (2010) reported smaller left, but not right, SGC volumes in familial BD subjects compared with both nonfamilial BD subjects and HC. Chiu et al. (2008) found that nonfamilial pediatric BD patients had smaller left anterior cingulate gyrus volumes, which included the SGC as part of the anterior cingulate gyrus, compared with HC. Because of differences in family history, medication exposure, methods of analysis, and inconsistent findings, it is difficult to draw conclusions from these studies. Clearly, more studies of the SGC in pediatric BD are needed.
We examined SGC morphometry in children and adolescents with BD who were the offspring of parents with BD. The SGC tracing protocol that we adopted (Coryell et al. 2005) separated the subgenual cortex (anterior portion) from the subcallosal area (posterior portion). However, the sgACC has been defined differently across studies. The anterior section of the SGC in our study corresponds to the subgenual prefrontal cortex described by previous studies. Due to our familial BD sample, we hypothesized that the mean SGC volumes of children and adolescents with BD would be smaller than those of HC. We also investigated the potential role of mood stabilizer treatment in SGC brain morphology, as these agents have been found to be correlated with increased SGC volume in adult patients with mood disorders (Drevets 2000) and possibly children with BD (Baloch et al. 2010).
Methods
This study was approved by the Stanford University Institutional Review Board. The participant screening and inclusion criteria have been previously described (Chang et al. 2005b), and will be briefly summarized here.
Twenty patients and 20 healthy volunteers from an ongoing study of familial BD were recruited from Stanford University Department of Psychiatry clinics and from the local community. Inclusion criteria for BD subjects were age 9–18, biological parent with BD I or II, as diagnosed by the Structured Clinical Interview for DSM-IV Axis I disorders (First et al. 1995), and diagnosis of BD I by the WASH-U-KSADS (Geller et al. 1996; Geller et al. 2001). HC subjects were required to have no Axis I diagnosis as determined by the K-SADS-PL (Kaufman et al. 1997). Exclusion criteria for both groups were presence of a pervasive developmental disorder (including autism or Asperger's disorder), a neurological condition (such as a seizure disorder), a substance use disorder, intelligence quotient (IQ) < 80, or contraindications for the MRI procedure. For more details regarding diagnostic decisions and psychiatric evaluation of subjects and biological parents, please refer to Chang et al. (2005a).
All subjects were outpatients at the time of MRI scanning. BD patients discontinued psychostimulants for 24 hours before the scan, primarily due to a concurrent functional MRI study of attention. They were allowed to continue other current medications such as mood stabilizers or antidepressants due to the risk of mood destabilization. Positive past exposure to lithium (Li), valproate (VPA), selective serotonin reuptake inhibitors, atypical antidepressants, and antipsychotics was recorded. Medication exposure was only counted if exposure was more than 2 weeks, regardless of symptom outcome.
Magnetic resonance images of the entire brain were acquired with a Signa 3-T scanner (GE Medical Systems, Milwaukee, WI). Coronal images were acquired with a three-dimensional volumetric radiofrequency spoiled gradient echo with the following scan parameters: TR = 35 millisecond, TE = 6 millisecond, flip angle = 45°, number of excitations = 1, image matrix = 256 × 192 pixels, field of view = 24 cm, slice thickness = 1.5 mm, 124 slices, acquired resolution = 1.5 × 0.9 × 1.2 mm3. The images were reconstructed as a 124 × 256 × 256 matrix with a 1.5 × 0.9 × 0.9 mm3 spatial resolution.
Imaging processing
The initial steps of image processing have been previously described (Chang et al. 2005b) and will be briefly summarized here. Image data were imported into the program BrainImageJava (BIJ), a freeware program developed at the Center for Interdisciplinary Brain Sciences Research at Stanford University (spnl.stanford.edu/tools/brainimagej.htm). After importation, MRI data were corrected for bias field artifact, nonbrain tissue was removed using a semiautomated process, separation (segmentation) of tissue components (gray, white, and cerebral spinal fluid (CSF)), and alignment to anterior commissure–posterior commissure (AC–PC) orientation. The total brain volume was calculated by adding total tissue and CSF together.
Anatomical delineation of the SGC region
The volumes of the anterior and posterior sections of the SGC were manually traced by a reliable rater who was blind to the diagnosis of each subject. Before measuring, the rater (MM) achieved a high level of interrater reliability with gold-standard drawings. Intra-class correlation coefficients were ≥0.85 for all regions: Left anterior, left posterior, right anterior, and right posterior SGC. The gold-standard drawings had been previously established based on consensus between two different raters on five brains from a different dataset.
BIJ software was used to trace SGC volumes for each individual subject, to segment individual brain volumes into gray, white, and CSF partitions, and to measure total brain volumes. SGC region of interest (ROI) was drawn on a spatially realigned gray-scale image, and volumes were measured on segmented images. Gray matter and tissue (gray matter plus white matter) volumes were measured from the ROI.
The anterior and posterior SGC were defined using a protocol similar to the one described by Coryell et al. (2005). Both the coronal and sagittal views were utilized to draw the SGC. First, a rough estimate of the ventral border of the SGC was drawn using the sagittal view, as this view is optimal for identifying the cingulate sulcus. The SGC was drawn on the two or three sagittal slices that exhibited clear SGC boundaries. The anterior tip of the corpus callosum was the anterior boundary, the corpus callosum was the superior boundary, and the cingulate sulcus was the inferior boundary. The ROI was then refined and completed in the coronal view on all slices containing SGC. The anterior landmark of the ROI was the first slice where the corpus callosum was completely formed. The medial boundary of the SGC was the division between the left and right SGC. The clear emergence of the putamen in its respective hemisphere indicated the last slice of the anterior SGC ROI. The posterior SGC ROI began immediately after the last slice of the anterior SGC ROI. The superior boundary of the posterior SGC was the corpus callosum, and the inferior boundary was the cingulate sulcus. The posterior boundary of the posterior SGC was the coronal slice on which the white matter tracts outlining the gyrus rectus were no longer visible. After tracings on the coronal view were completed, the sagittal view was used as a guide to check and refine the ROIs, as it allowed the rater to detect and remove voxels included in the ROI that had unintentionally extended dorsally into the corpus callosum, or ventrally into the gyrus rectus.
After the ROI was complete, the volume of gray matter within each ROI was computed by BIJ software and exported into an SPSS (SPSS, Chicago, IL) spreadsheet for statistical analysis.
Statistical analysis
The distribution of SGC volume data was first examined for normality to assure that it conformed to the assumptions of the parametric statistics employed. A multivariate analysis of covariance (MANCOVA) was used to compare bilateral anterior and posterior SGC volumes in BD and HC groups. A second MANCOVA was used to compare bilateral anterior and posterior SGC volumes in BD patients with prior Li and/or VPA exposure, BD patients without Li and/or VPA exposure, and controls (HC). For all analyses, total cerebral gray matter volume and age were included as covariates, as had been used in similar brain anatomical studies in our lab (Chang et al. 2005b) and in other labs (Baloch et al. 2010). Furthermore, covarying for age accounts for a portion of the variance contributed by brain development during this age range (Uddin et al. 2010). A corrected threshold of p = 0.025 was used to correct for multiple comparisons (p = 0.05/2 regions).
Results
Subjects
The demographics and clinical characteristics of the BD and HC groups are summarized in Table 1. There were no significant differences between BD and HC groups in mean age. However, there was a trend for higher IQ in the HC group (p = 0.065).
IQ=intelligence quotient.
SGC cortex volumes
Subjects with BD had similar left anterior SGC gray matter volumes (BD: 0.51 ± 0.13 cm3 standard deviation [SD]; HC: 0.54 ± 0.15 cm3 [SD]), left posterior SGC gray matter volumes (BD: 0.24 ± 0.06 cm3 [SD]; HC: 0.22 ± 0.06 cm3 [SD]), right anterior SGC gray matter volumes (BD: 0.43 ± 0.14 cm3 [SD]; HC: 0.47 ± 0.11 cm3 [SD]), and right posterior SGC gray matter volumes (BD: 0.25 ± 0.07 cm3 [SD]; HC: 0.23 ± 0.07 cm3 [SD]) compared with those of the HC group.
As stated above, a threshold of p = 0.025 was used to correct for multiple comparisons. This value was calculated as p = 0.05 divided by two multivariate analysis of variance (MANOVA) regions. Results of the MANCOVA, controlling for age and total cerebral gray matter, showed that none of the SGC regions were significantly different between BD patients and HC (F[4, 33] = 0.96, p = 0.44). Covarying for IQ did not change the results (p = 0.53). When age was not used as a covariate, the omnibus analysis of variance including all of the SGC regions and comparing BD patients and HC was not significant (F(4, 34) = 0.93, p = 0.46).
Effects of mood stabilizers on SGC volumes
The SGC volumes of BD patients who had a history of treatment with mood stabilizers, including lithium (Li) and/or valproate (VPA), were compared with the volumes of BD patients without Li and/or VPA exposure, and with controls (Table 2). Ten BD patients were in the BD with Li and/or VPA group, 10 were in the BD without Li or VPA group, and 20 were controls. Subjects with prior Li exposure were treated with a mean of 38.8 ± 25.6 (SD) months. Subjects with prior exposure to VPA were treated with a mean of 18.0 ± 15.3 (SD) months.
BD = bipolar disorder; Li = lithium; VPA = valproate.
Mean volumes and SDs of the regions of interest of the BD group with Li and/or VPA exposure, BD group without Li or VPA exposure, and controls are provided in Table 3. A three-group MANCOVA with factors group (BD exposed, BD unexposed, and HC) x region (right anterior, left anterior, right posterior, left posterior) and controlling for age and total cerebrum gray matter showed a marginally significant main effect of diagnosis (F[4, 32] = 2.69, p = 0.049). Post-hoc ANCOVA analyses for each region showed that group differences were driven by volumes of the left posterior SGC (t[1] = 7.79, p = 0.008), and a trend for the right posterior SGC (t[1] = 4.37, p = 0.044). Similarly, the total posterior (left plus right) was significantly different across the three groups. (t[1] = 6.68, p = 0.014). Neither the left anterior SGC (t[1] = 1.60, p = 0.214) nor right anterior SGC (t[1] = 3.85, p = 0.058) were significantly different between the three groups (Figs. 1 –4).

Total SGC volumes in BD subjects and healthy controls. SGC = subgenual cingulate cortex; BD = bipolar disorder.
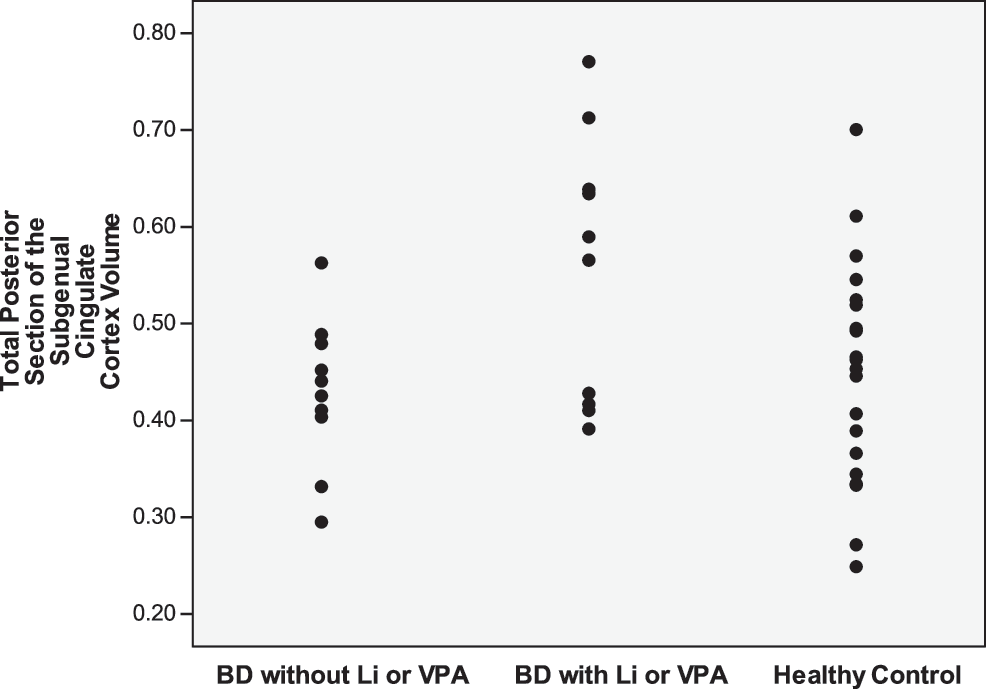
Total posterior subgeneral cingulate cortex volumes in BD subjects without Li or VPA, BD subjects with Li and/or VPA, and healthy controls. BD = bipolar disorder; Li = lithium; VPA = valproate
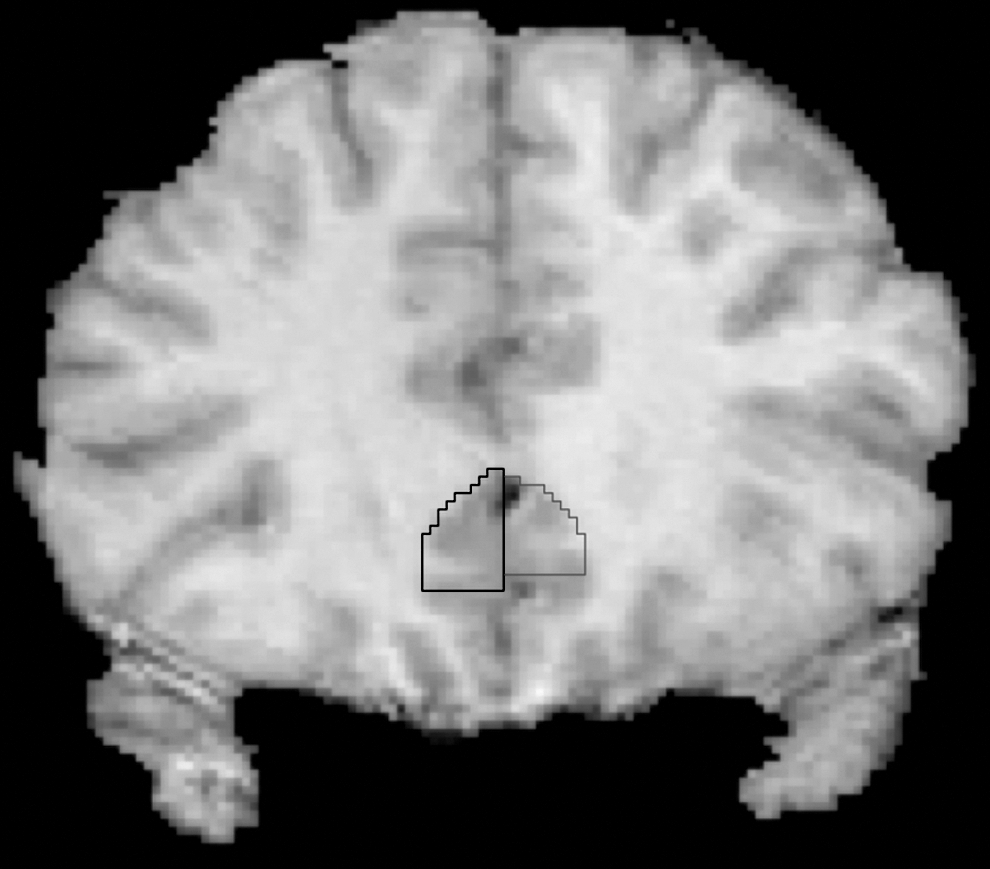
SGC Tracing. The anterior landmark of the anterior SGC ROI was the first slice where the corpus callosum was completely formed. SGC = subgenual cingulate cortex; ROI = region of interest.

SGC Tracing. The posterior SGC ROI began immediately after the last slice of the anterior SGC ROI. SGC = subgenual cingulate cortex; ROI = region of interest.
SGC = subgenual cingulated cortex; BD = bipolar disorder; Li = lithium; VPA = valproate.
Follow-up pairwise comparisons showed that BD patients with Li and/or VPA exposure had increased left posterior gray matter SGC volumes compared with BD unexposed (p = 0.008) and compared with HC (p = 0.003). Also, mean total (left plus right) posterior gray matter volumes were significantly larger in BD patients exposed to Li and/or VPA than in the unexposed BD subjects (mean difference = 0.133 ± 0.051 [standard error], p = 0.014), and to the HC group (mean difference = 0.131 ± 0.044 [standard error], p = 0.006). Right posterior gray SGC showed a trend for larger volume in the BD exposed to Li and/or VPA than in BD unexposed (p = 0.044) and to HC (p = 0.021). To assure that this effect was not related to a generalized effect throughout the brain, we confirmed that there was no difference in total cerebral gray matter between any of the groups (p = 0.315).
Discussion
We did not find any statistically significant differences between SGC volumes of familial pediatric BD subjects and HC. However, we found that BD subjects with prior mood stabilizer exposure had significantly increased SGC volumes compared with BD subjects without mood stabilizer exposure, and compared with controls. This increase was driven by significantly larger left (and right plus left) posterior SGC volumes.
Previous neuroimaging studies in adult patients have suggested abnormal SGC volume in BD (Drevets et al. 2008a). A meta-analysis of studies of SGC volume in adults with unipolar and bipolar depression found significant SGC volume reductions in patients with mood disorders (Hajek et al. 2008b). However, additional factors may determine whether reduced SGC volume is found, including family history of mood disorders. Only two studies have directly compared SGC volumes in adult familial unipolar and familial BD patients, and their findings were inconsistent. Drevets et al. (1997) demonstrated significant SGC volume reductions in familial unipolar and familial BD patients relative to HC. Conversely, Brambilla et al. (2002) reported no significant abnormality in SGC volumes in familial unipolar and familial BD patients.
Our results may have differed from previous studies because our SGC tracing method was somewhat different, as the literature varies in the definition of this region. The method that we adopted (Coryell et al. 2005) separates the subgenual cortex (anterior portion) from the subcallosal area (posterior portion). The anterior section of the SGC in our study corresponds to the subgenual prefrontal cortex described by previous studies (Drevets et al. 1997; Hirayasu and Shenton 1999; Brambilla and Nicoletti 2002; Bremner and Vythilingam 2002; Sharma and Menon 2003; Sanches and Sassi 2005; Zimmerman and DelBello 2006; Baloch and Hatch 2010). However, functional neuroimaging studies by Mayberg et al. (1999, 2000) consistently include portions of the subcallosal area in measures of the SGC cortex. Our findings suggest that exposure to mood stabilizer medications are associated with greater volume specifically in the posterior portion of the SGC, which corresponds to the subcallosal area. As the pathophysiology underlying volumetric abnormalities in the anterior versus posterior SGC may differ, it is important to measure and compare each region separately.
Another factor that may have contributed to our negative results is age. It is uncertain whether the volumetric findings in adult BD patients are applicable to pediatric BD patients. Baloch et al. (2010) reported significantly smaller left SGC volumes than HC in familial pediatric BD subjects. Our current negative finding, however, is in agreement with Sanches et al. (2005), who also reported no significant SGC volume differences between familial pediatric BD patients and controls.
However, most of the children and adolescents with BD in the Sanches et al. (2005) study were receiving a mood-stabilizing drug, which may have reversed or prevented decreases in SGC volume. Our study found that a history of exposure to mood-stabilizing medications (lithium and/or valproate) was associated with greater posterior SGC volume than both patients without exposure to mood-stabilizing medications and to HC. Although we did not find statistical differences in anterior SGC volumes, there is a trend for increased right anterior SGC volume in BD patients with a history of exposure to mood-stabilizing medications compared with BD patients without such exposure and controls (p = 0.058). Because of the greater statistical variance in the anterior SGC volumes, we believe that our study was underpowered to detect medication-induced differences in the anterior SGC. These findings are in line with previous studies of adults and children with mood disorders. Drevets (2000) found that adult BD patients treated with Li and/or VPA exhibited significantly larger SGC volumes than BD subjects who were unmedicated or were medicated with other agents. Baloch et al. (2010) reported significantly larger right, but not left, SGC volumes in pediatric BD subjects using mood stabilizers. Moore et al. (2009) found an increase at trend level in the left SGC volume in BD adults after 4 weeks of Li administration. In addition, other brain regions have shown lithium-associated volume increases in BD patients, including the hippocampus (Yucel et al. 2007) and amygdala (Savitz et al. 2010). Thus, although these data are largely retrospective in nature, these findings suggest that Li and VPA exposure may promote increases in SGC volume.
Mood stabilizers, such as Li and VPA, have been shown to have a neurotrophic role in vitro, by increasing levels of the neuroprotective protein bcl-2 in the frontal cortex, striatum, and hippocampus (Manji et al. 1999, 2000). Furthermore, exposure to mood stabilizers before the first manic episode in children and adolescents with at least one parent with BD may be associated with a later age at onset of mania (Chang et al. 2010). Thus, mood stabilizers might prevent or delay the onset of BD, rather than just being used for the treatment of acute symptoms, and may have direct effects on brain morphology, including the SGC, amygdala, and total gray matter (Sassi et al. 2002; Chang et al. 2005a; Monkul et al. 2007).
There are several limitations of this study, including our small sample size and our heterogeneous BD cohort with various medication histories. The majority of our BD subjects had prior exposure to some type of medication, including mood stabilizers, anti-depressants, antipsychotics, and other anticonvulsants, of which the long-term neurobiological effects and drug interactions are unclear. Furthermore, our BD with Li and/or VPA group was generally more medicated, with greater exposure to selective serotonin reuptake inhibitors, atypical antidepressants, and antipsychotics than the BD without Li and/or VPA group, which could have affected our results. The BD group with Li and/or VPA and the BD group without Li or VPA were balanced for SSRIs and antipsychotics, but there was a trend for greater exposure to atypical antidepressants (p = 0.074) in the BD group with Li and/or VPA, so we cannot rule out that the SGC volume differences may be due in part to atypical antidepressant use. Furthermore, our subjects had high rates of comorbid ADHD, but at equal rates in both the mood stabilizer-exposed and naïve groups. The effects of ADHD on SGC volume have not been studied, so it is unclear what effect this comorbidity may have had on our findings. It remains possible that our findings may be associated with comorbid disorders, clinical differences, and diagnostic differences that we did not ascertain in our subjects.
In conclusion, our results support that SGC volumetric abnormalities are not present in children and adolescents with familial BD. Furthermore, prior exposure to mood stabilizers could lead to increased SGC volumes for familial BD patients. Future neuroimaging studies should involve following patients from childhood (ideally before the onset of fully developed BD) to adulthood, to compare long-term brain morphometric changes with exposure to different medications and also to further examine of the development and course of BD through the lifespan.
Footnotes
Disclosures
Myles M. Mitsunaga, B.A., Amy Garrett, Ph.D., Meghan Howe, M.A., Asya Karchemskiy, M.S., and Allan Reiss, M.D., have no conflicts of interest.
Kiki D. Chang, M.D.: Consultant for Eli Lilly & Co., GlaxoSmithKline, and Bristol-Myers Squibb; receives research support from GlaxoSmithKline, National Institute of Mental Health, and National Alliance for Research in Schizophrenia and Depression; and speaker for Merck.
This work was supported by a NARSAD Young Investigator Award, a Klingenstein Third Generation Foundation Fellowship, and NIH grant MH64460-01 (Dr. Chang).