
Abstract
Objective:
Mood stabilizers have been reported to affect brain concentrations of myo-inositol (mI) and N-acetylaspartate (NAA). We examined the effects of quetiapine (QUET), an atypical antipsychotic, on these neurochemicals, and potential predictors of response to QUET in adolescents with bipolar depression.
Methods:
Twenty-six adolescents with bipolar depression participated in an 8-week placebo-controlled trial of QUET monotherapy. Subjects were scanned at baseline and after 8 weeks with proton magnetic resonance spectroscopy (1H-MRS) at 3T and 4T at two sites, with 8 cm3 voxels placed in the right and left dorsolateral prefrontal cortex (DLPFC) and anterior cingulate cortex (ACC). LCModel was used to calculate absolute concentrations of NAA and mI.
Results:
Twenty-six subjects had pre- and posttreatment scans (mean age=15.6 years, 9 boys). Of these subjects, 5 out of 16 subjects receiving QUET and 5 out of 10 receiving placebo (PBO) were responders (50% decrease in Children's Depression Rating Scale [CDRS] score). Although baseline ACC mI did not predict responder status, responders had significantly lower posttreatment ACC mI values than did nonresponders (3.27±.71 vs. 4.23±.70; p=0.004). There were no significant differences in the changes in ACC and DLPFC NAA levels in the QUET group compared with the PBO group (ACC: −0.55±1.3 vs.+0.25±1.5, p=0.23; right-DLPFC: −0.55±1.3 vs. 0.33±0.89, p=0.13; left-DLPFC: −0.04±0.91 vs.+0.29±0.61, p=0.41).
Conclusion:
We found that posttreatment, not baseline, ACC mI levels were associated with response to QUET in adolescents with bipolar depression. There were no differences in NAA concentration changes between the QUET and PBO groups. Larger studies including different brain regions would help to clarify the effects of QUET on neurochemistry in patients with bipolar disorder.
Introduction
Psychotropic medications may also influence mI concentrations in patients with BD. For example, lithium administration was found to be associated with decreases in ACC mI levels in manic youth (Davanzo, et al. 2001, 2003), and lower concentrations of mI in the ACC were associated with remission in adolescents with bipolar depression treated with lithium (Patel et al. 2006). However, other studies have had varying results, including an association of acute and chronic lithium treatment with increases in whole brain and prefrontal mI (Friedman et al. 2004; Patel et al. 2008b), and no change in dorsolateral prefrontal cortex (DLPFC) mI after 4 weeks of lithium exposure in healthy adults (Brambilla et al. 2004). Lithium may be somewhat unique in its effects on mI concentrations. Specifically, mI is a precursor in phosphoinositol synthesis, and through the phosphoinositol pathway may affect intracellular calcium homeostasis (Silverstone et al. 2005). Lithium inhibits the action of inositol monophosphatase, leading to increased concentrations of phosphoinositol, which may decrease mI levels. To date, no studies have examined the effects of other medications on mI levels in adolescents with bipolar depression.
NAA has been hypothesized to be a reliable marker of both neuronal viability and metabolism. Studies in adult and pediatric patients with BD have found decreased prefrontal NAA concentrations (Winsberg et al. 2000; Chang et al. 2003; Sassi et al. 2005; Olvera, et al. 2007; Caetano et al. 2011). Treatment with lithium has been shown to acutely raise NAA concentrations in adult patients with BD (Moore et al. 2000c; Silverstone et al. 2003; Moore et al. 2009). In one study of adolescents with bipolar depression, however, lithium treatment was associated with no NAA change in VLPFC and a decrease in NAA in the medial ventral prefrontal cortex (Patel, et al. 2008b). In another study of manic adolescents, the atypical antipsychotic olanzapine was not associated with changes in the prefrontal NAA concentrations of manic adolescents, but remitters showed increases in NAA levels whereas nonremitters showed decreases (DelBello et al. 2006). Therefore, agents that are effective in treating bipolar mania and/or depression may have direct or indirect effects on both prefrontal NAA and mI levels. Taken together, prefrontal mI and NAA levels may be useful biomarkers of treatment effects and response in adolescents with BD.
Quetiapine (QUET), an atypical antipsychotic, has been shown to be effective for treatment of mania in adolescents. However, we recently found QUET to be similar in efficacy to placebo (PBO) for decreasing symptoms of depression in 32 adolescents with bipolar depression, treated over 8 weeks (DelBello et al. 2009). Despite the negative results, both the QUET and PBO groups had relatively high response and remission rates. As little is known about the neurochemical effects of treatment with QUET, as well as the neurochemistry associated with improvement in bipolar depression, we investigated whether improvement in depression was correlated with changes in NAA or mI concentrations, and whether these changes were specific to QUET. Based upon prior, but scant, literature, we hypothesized that responders would show decreases in medial prefrontal mI concentrations, lower prefrontal mI concentrations would predict response and remission, and that subjects taking QUET would show increases in prefrontal NAA relative to those taking PBO.
Methods
Study design
Adolescents (ages 12–18 years old) with a major depressive episode associated with bipolar I or II disorder were recruited from outpatient clinics at Stanford University and inpatient units and outpatient clinics of the University of Cincinnati and Cincinnati Childrens Hospital Medical Center to participate in this 8-week study. To be included in this study, potential subjects had a screening and baseline Children's Depression Rating Scale-Revised (CDRS-R) score >40 and a Young Mania Rating Scale (YMRS) score <20, and were not taking antidepressants, mood stabilizers, or antipsychotics for at least 72 hours prior to baseline assessments. Additionally, the use of concomitant psychotropic medications was prohibited during study participation. After informed assent and consent were obtained from the subjects and their legal guardians, respectively, subjects were randomized to PBO or QUET, which was titrated clinically to 300–600 mg/day over 3–6 days. Randomization was stratified by sex and the presence of psychosis (DelBello et al. 2009).
Assessments and analyses
Rating instruments included the CDRS-R and Clinical Global Impressions-Severity (CGI-S) and Improvement (CGI-I) scales. Response was defined as a ≥50% improvement from baseline in CDRS-R, and remission was defined as a CDRS-R ≤28 and CGI-I ≤2. Ratings were obtained on the day of each MRS scan.
1H-MRS
Twenty-six subjects were scanned using 1H-MRS at baseline and end point of study participation. Other subjects were excluded because of scanning contraindications such as the presence of metallic implants or braces or because they did not consent to scanning procedures. At the University of Cincinnati, scan data were acquired on a Varian 4 Tesla whole-body scanner. A volume transverse electromagnetic (TEM) 1H head coil was used as a transmitter/receiver. A multislice scout image acquired with gradient echo pulse sequence was initially used for brain positioning and MRS voxel placement. The scout image was followed by the acquisition of three-dimensional (3-D) whole head MRI using modified driven equilibrium Fourier transform (MDEFT) pulse sequence (Lee et al. 1993) for tissue segmentation. The MDEFT image was acquired in the axial orientation with repetition time (TR) 13.1 ms, echo time (TE) 6 ms, magnetization preparation time (TMD) 1.1 ms, data matrix=256×192×96, field of view (FOV) 256×192×192 mm (with four segments), slab thickness 150 mm. After MRS voxel positioning, the magnetic field homogeneity was optimized using automatic shim method fast automatic shimming technique by mapping along projections (FASTMAP) (Gruetter and Boesch 1992). A typical water line width in the MRS voxel was 10–12 Hz. Spectra were acquired with TR 2000 ms, TE 26 ms, voxel size 8 cc and 128 averages with water suppression by variable pulse powers and optimizing relaxation delays (VAPOR) method (Tkac et al. 1999). For computations of metabolite levels and eddy current correction, one reference spectrum without water suppression was collected at the same voxel positions with the same parameters, except four averages and reduced receiver gain.
At Stanford University, subjects were scanned using a 3-tesla (3T) G.E. Signa MRI system with Echospeed gradients using a custom-built head coil with a 50% advantage in signal to noise ratio over the standard G.E. coil. Imaging data were acquired sequentially from a single slice using the following pulse sequence and acquisition parameters: gradient echo pulse sequence TR/TE=2000/35 ms, 5-mm slice thickness, 124×256×256 matrix, field of view=200 mm, and in-plane spatial resolution=3.125 mm. To aid in voxel segmentation, high resolution T1-weighted spoiled grass gradient recalled (SPGR) 3D image was collected with the following parameters: TR=35 ms; TE=6 ms; flip angle=45 degrees; 24 cm field of view; 124 slices in coronal plane; 256×192 matrix; acquired resolution=1.5×0.9×1.2 mm3. The images were reconstructed as a 124×256×256 matrix with a 1.5×0.9×0.9 mm3 spatial resolution.
Single-voxel MRS was acquired with the point-resolved spectroscopy (PRESS) pulse sequence. At both sites, three single voxels, each 8 cm3 in volume, were positioned in the ACC and in the left and right DLPFC. Two experienced spectroscopists (NM, RK) positioned voxels to ensure consistent placement and to avoid signal artifacts from the orbits. The ACC (predominantly gray matter [GM]) voxel included the orbital frontal, middle frontal, and cingulate gyri, corresponding to Brodmann areas 9, 10, 24, 32, and 47 (Fig. 1). The lateral prefrontal (left and right DLPFC) voxels were positioned anywhere from 0 mm to 5 mm above the lateral ventricles, immediately anterior to a line drawn between the anterior aspects of the lateral ventricles, and as far lateral as possible while remaining in the cerebrum and visually maintaining approximately equal parts gray and white matter (WM) (Fig. 2). The MRS acquisition parameters used on both 3T and 4T scanners were same, that is, TR=2000 ms, TE=26 ms and 128 averages.
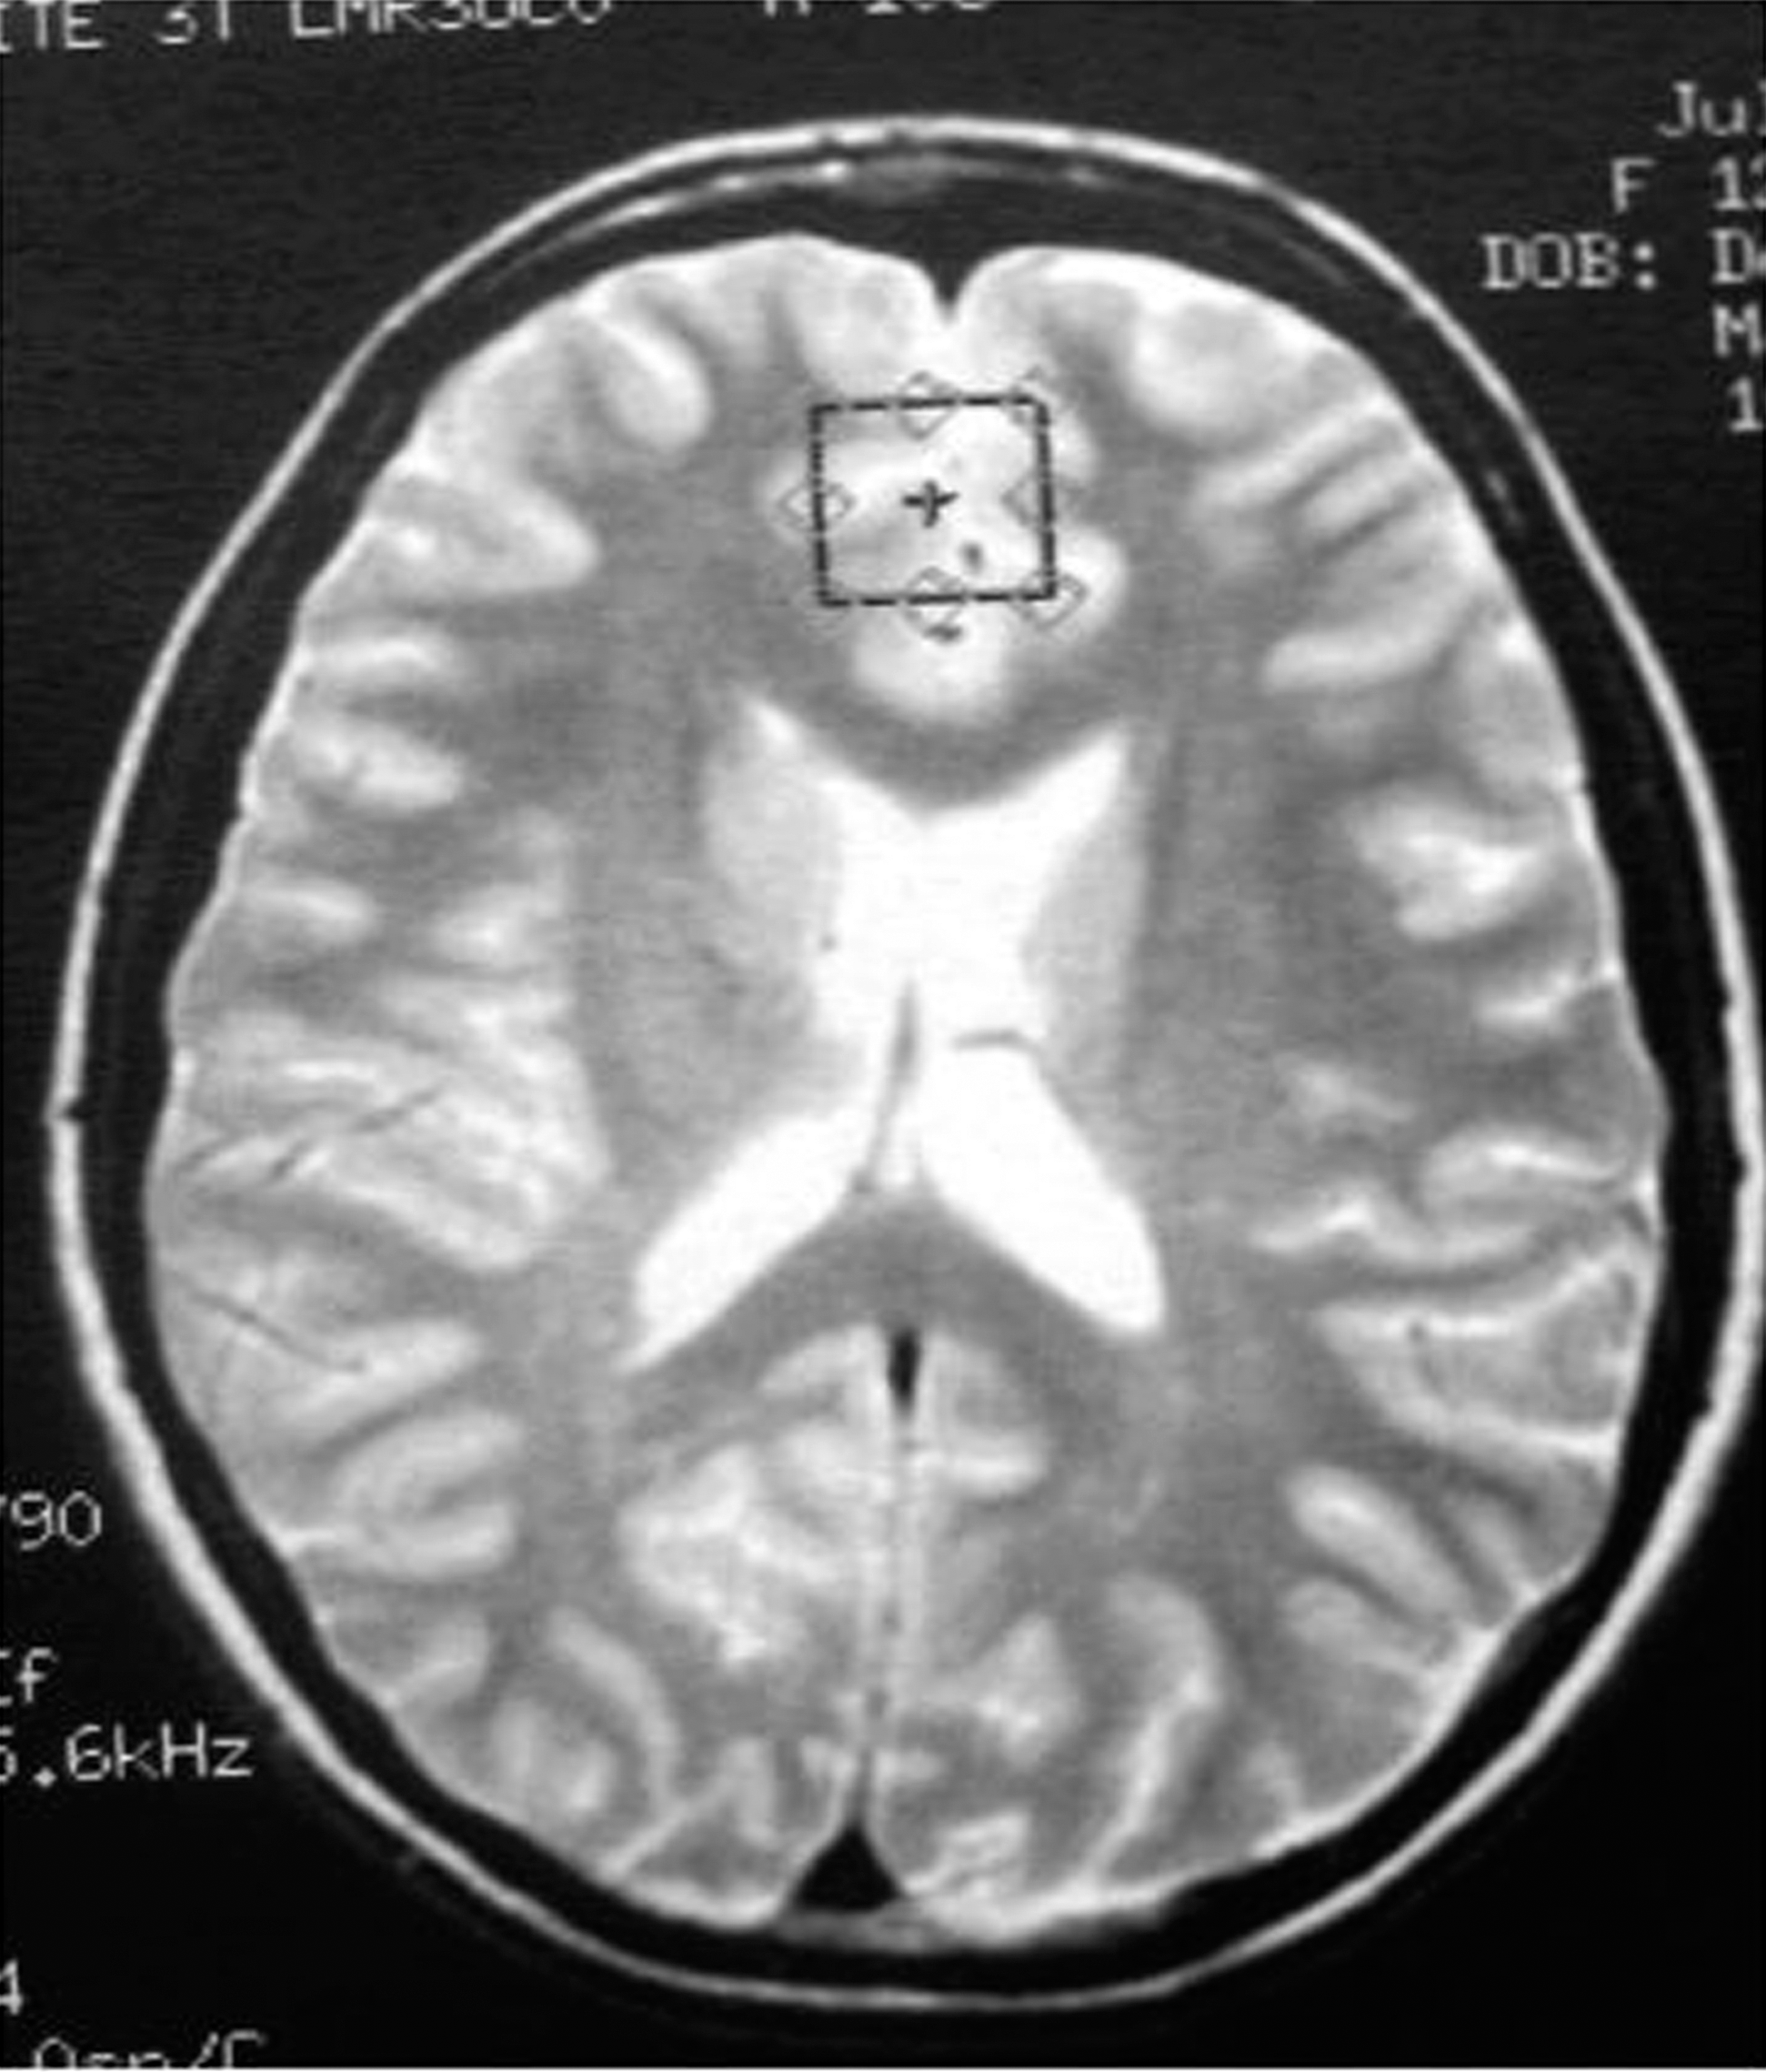
Placement of medial prefrontal voxel.
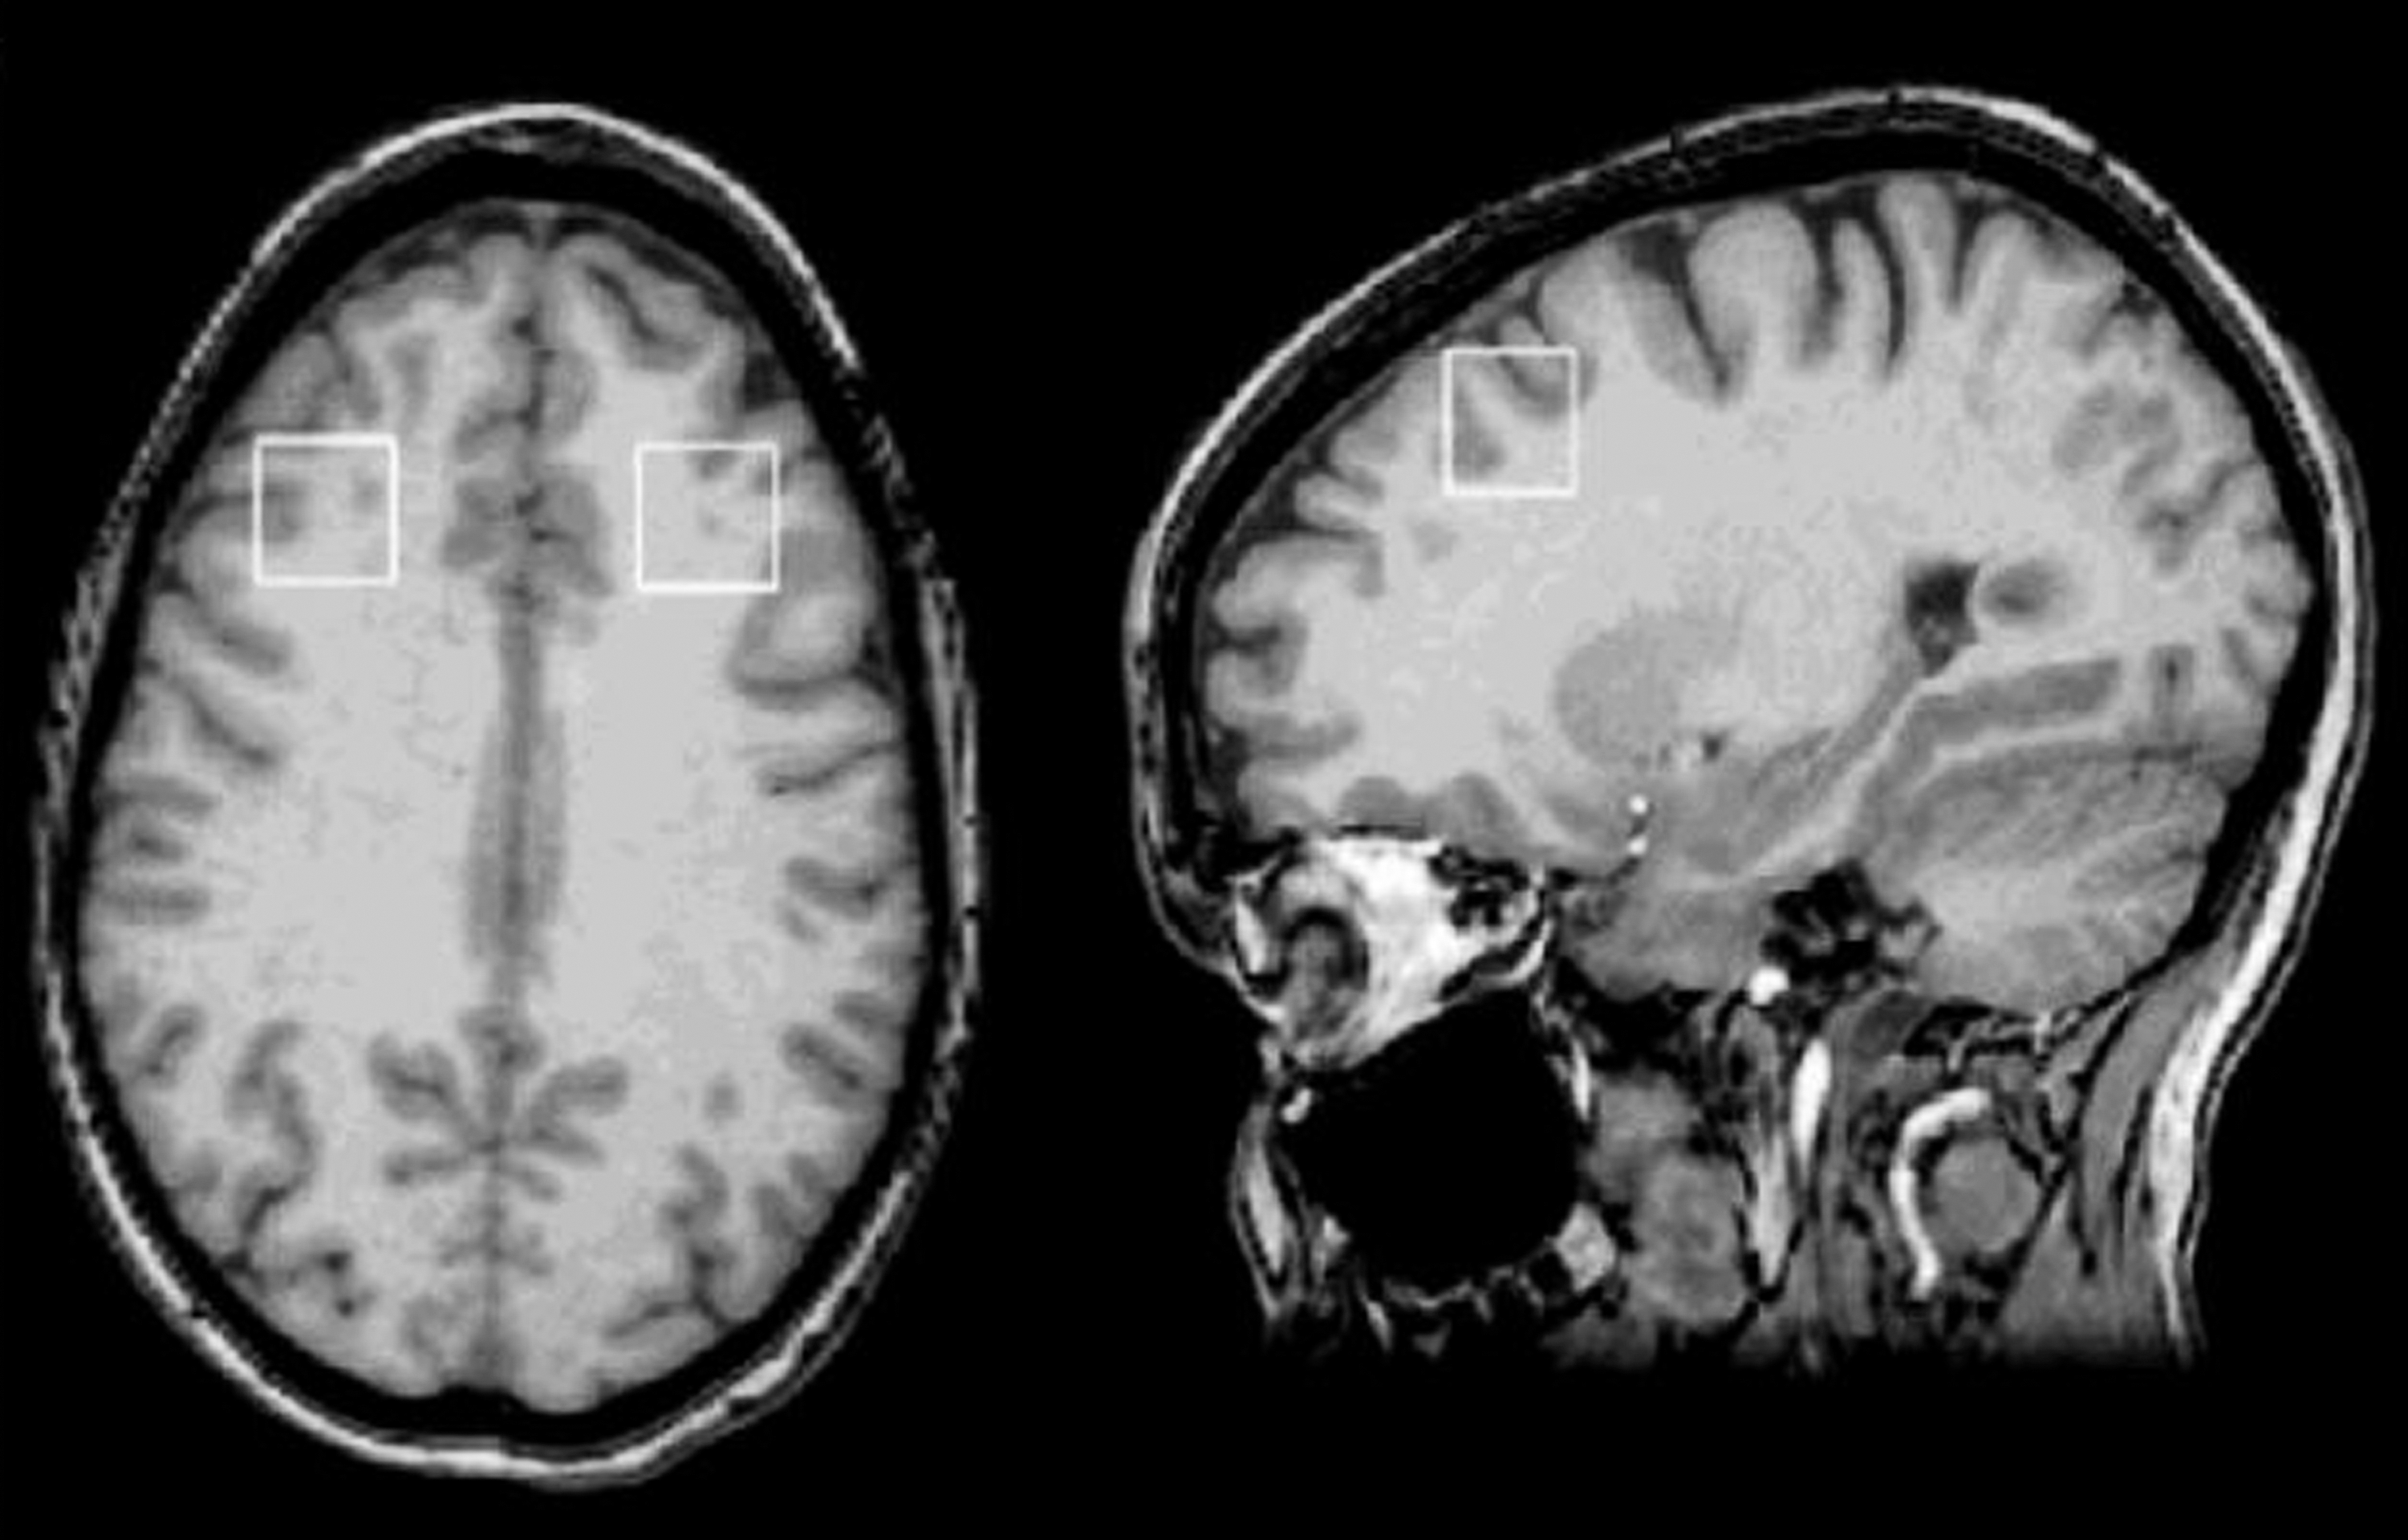
Placement of dorsolateral prefrontal cortex (DLPFC) voxels.
MRS data analysis
To determine metabolite levels, single-voxel MR spectra (Fig. 3) were curve fitted using the software Linear Combination of Model (LCModel) spectra with the water reference in unsuppressed-water spectra (Provencher 1993). It has been reported that brain metabolite levels and water levels are different in GM, WM, and cerebrospinal fluid (CSF), that is, the metabolite and water levels are dependents of tissue content in MRS voxel. Furthermore, the T1 and T2 relaxation times of brain metabolite and water are different in GM, WM, and CSF. Therefore, the LCModel fitting outputs were further corrected for the dependence on tissue contents, and the T1 and T2 relaxation loss for each MRS voxel. The tissue content of each MRS voxel was determined with the tissue segmentation data acquired in the study. The loss of T1 and T2 relaxation was corrected using previously published T1 and T2 relaxation times (Wansapura et al. 1999; Ethofer et al. 2003; Traber et al. 2004; Stanisz et al. 2005; Tsai et al. 2007). The default assumptions of LCModel, such as the water concentration used for reference and the T2 relaxation loss based on 1.5T condition, were also corrected before performing the correction of 3T and 4T data. For this study, only two major metabolite levels (NAA and mI) were corrected, presented in concentration (mM), and used for analyses.
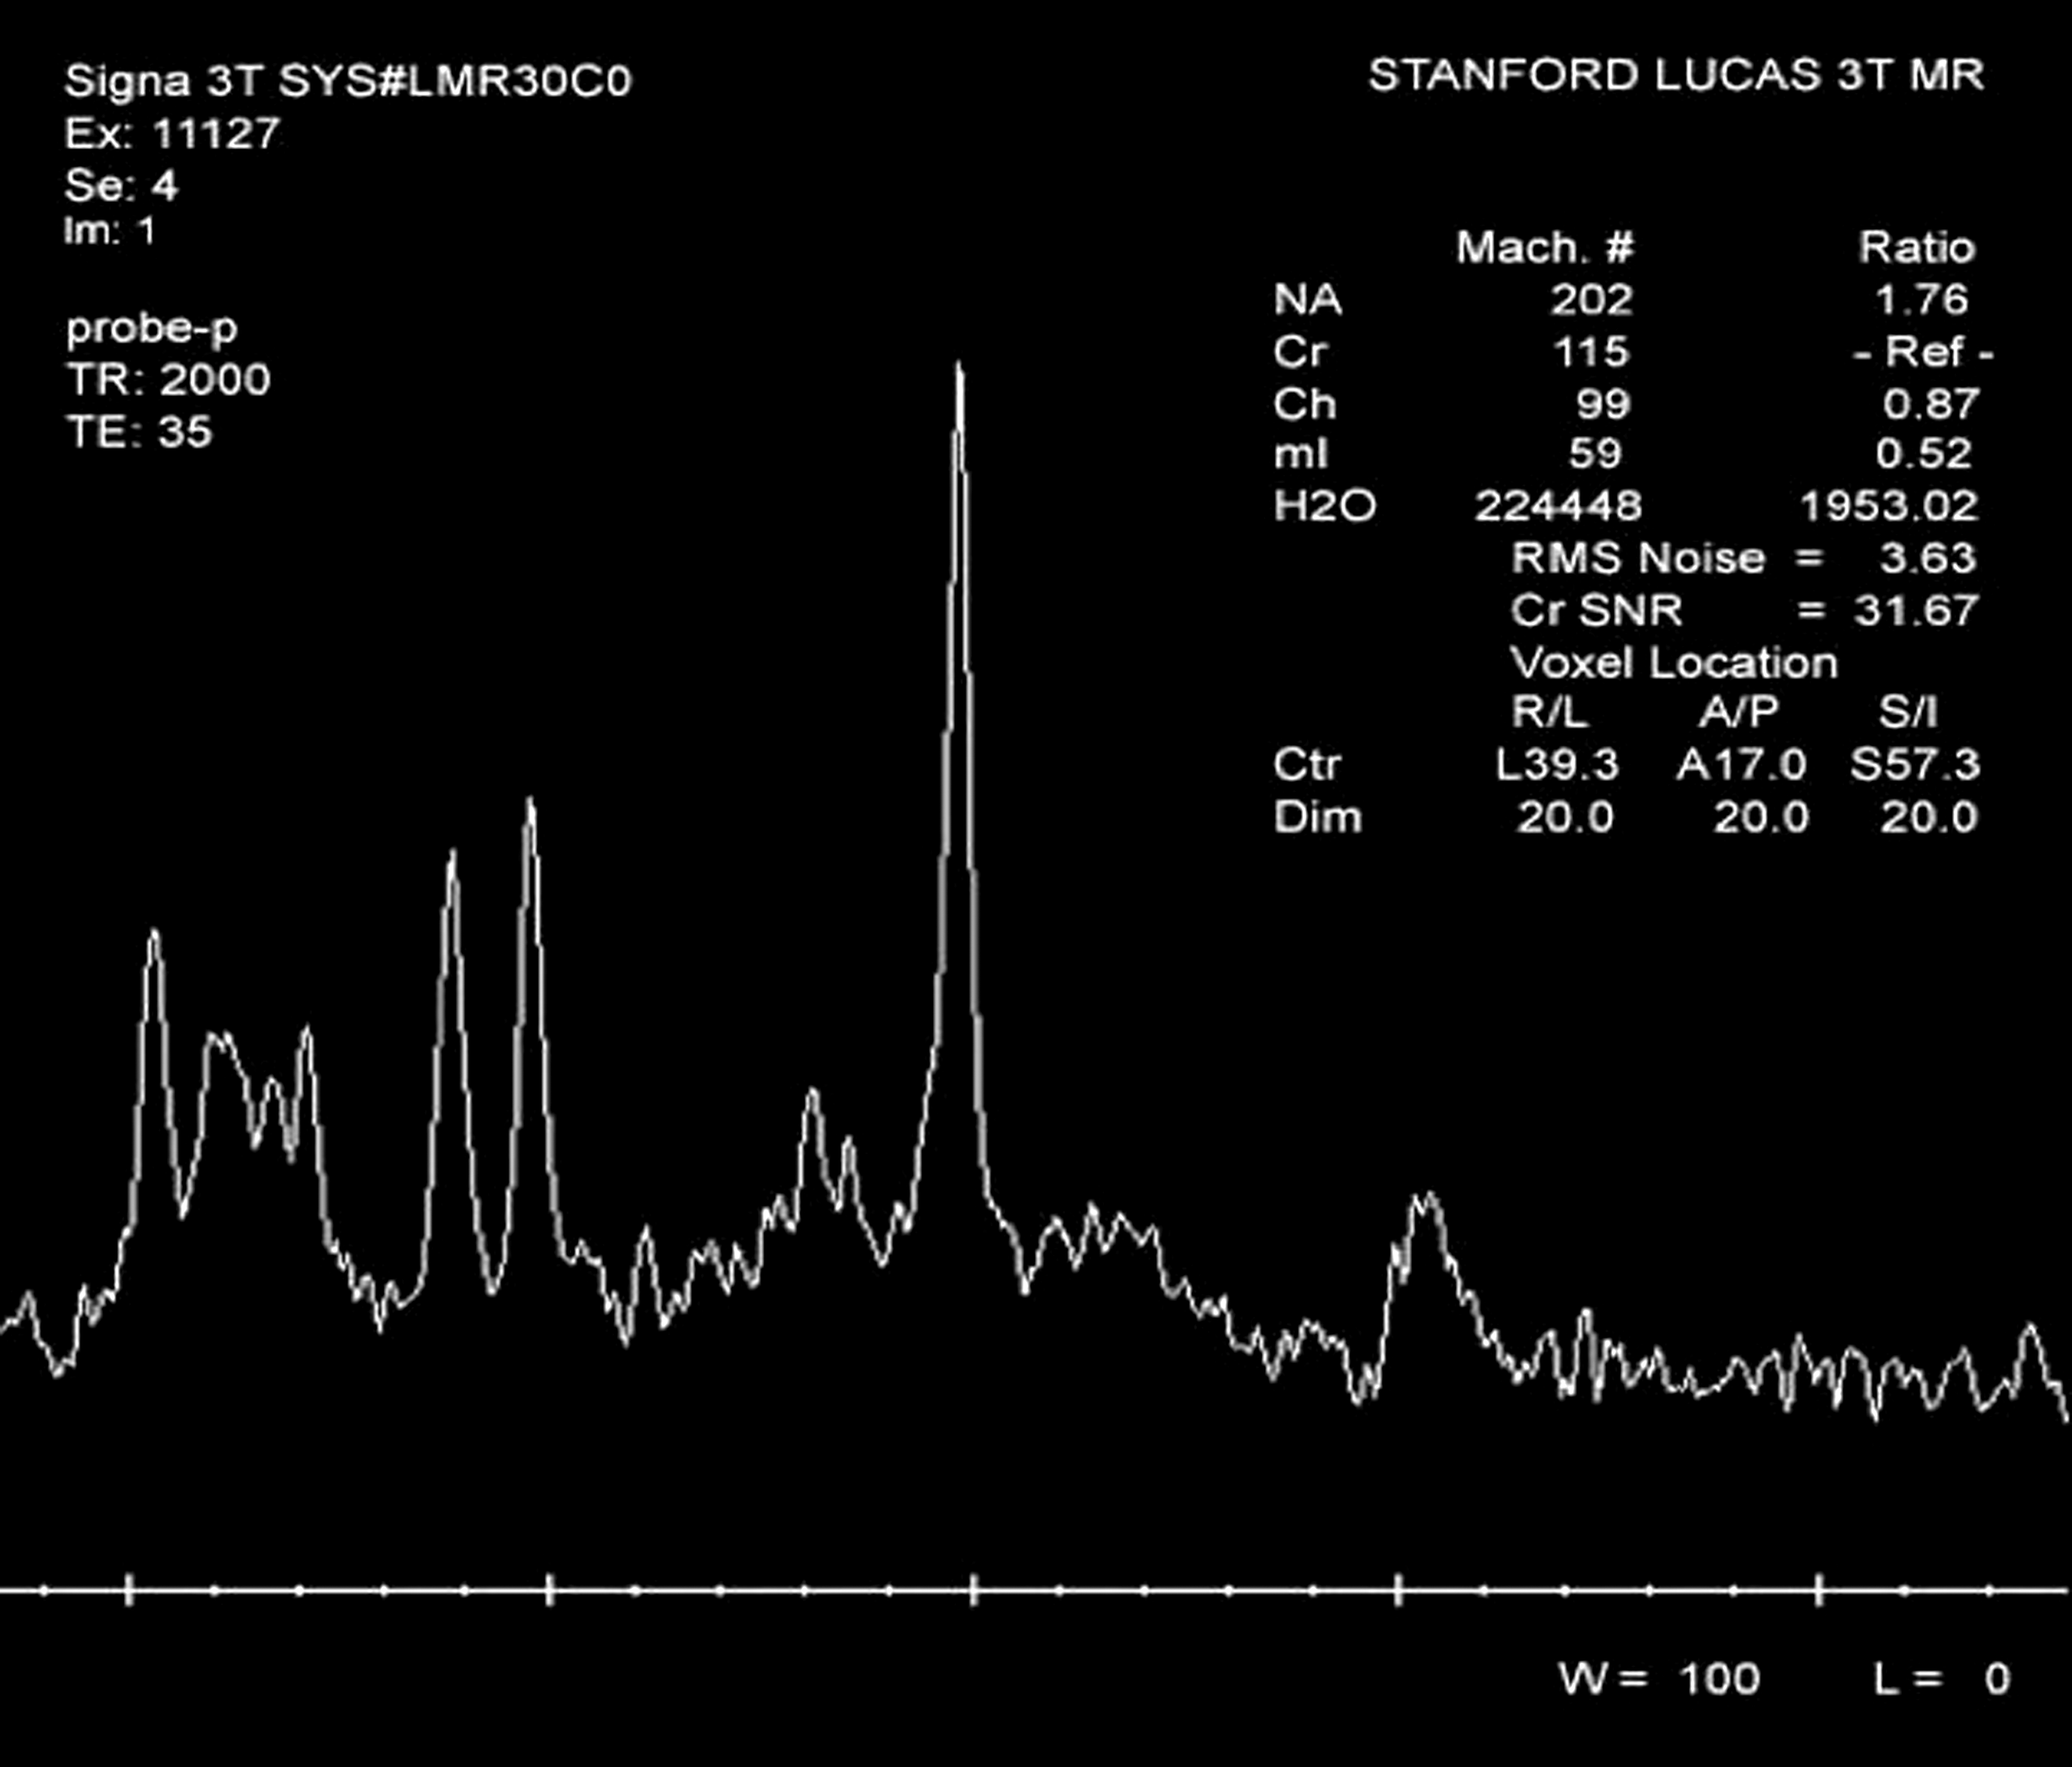
Sample magnetic resonance spectroscopy (MRS) spectrum.
All analyses were conducted on the intent-to-treat (ITT) sample (all subjects who took at least one dose of study medication). t-tests were used to determine group demographic differences. Analyses of covariance (ANCOVAs), with age as covariate, were used to determine effect of responder group on pre- and post-ACC mI levels. Multivariate analysis of covariance (MANCOVA), with days between scan as covariate, was used to determine if change in prefrontal NAA levels was associated with treatment group. Bonferroni correction was employed in testing these main hypotheses: α was set at 0.05/3=0.017. Exploratory analyses were conducted using uncorrected ANCOVAs on ACC NAA change, and left and right DLPFC mI change, covarying for age or days between scans as appropriate.
Results
Usable data were acquired from 26 subjects (9 boys), with a mean age of 15.6±2.0 years (see Table 1). Five out of 10 subjects taking PBO and 5/16 taking QUET were considered responders by CDRS-R criteria, so that there were a total of 10 responders and 16 nonresponders. Four in the PBO group and six in the active group were considered remitters. Responders were significantly older than nonresponders (16.7±1.0 vs. 15.1±2.2 years, p<0.05), and therefore age was used as a covariate in determining neurometabolite predictors of response. The responder and nonresponder groups also differed in days between scans (43.6±21.3 days vs. 60.9±6.2 days, respectively, p=0.02). Therefore, analyses involving changes in metabolite concentrations were performed using days between scan as a covariate.
ADHD, attention-deficit/hyperactivity disorder; C-GAS, Children's Global Assessment Scale; CDRS, Children's Depression Rating Scale.
There was no significant difference in baseline ACC mI concentrations between responders and nonresponders (3.97±1.23 vs. 4.31±.55, p=0.19; Cohen's d=0.36). Post-treatment ACC mI concentrations were significantly lower in responders than in nonresponders (3.27±0.71 vs. 4.23±0.70; p=0.007; Cohen's d=1.36, Fig. 4) and in remitters than in nonremitters (3.35±0.72 vs. 4.25±.73, p=0.008; Cohen's d=1.24). There was no effect of response group on changes in ACC mI, or left or right DLPFC NAA (Wilk's λ=0.78) (Fig. 5). Exploratory analyses showed that there was no association of ACC NAA change or left or right DLPFC mI change with response (Table 2).
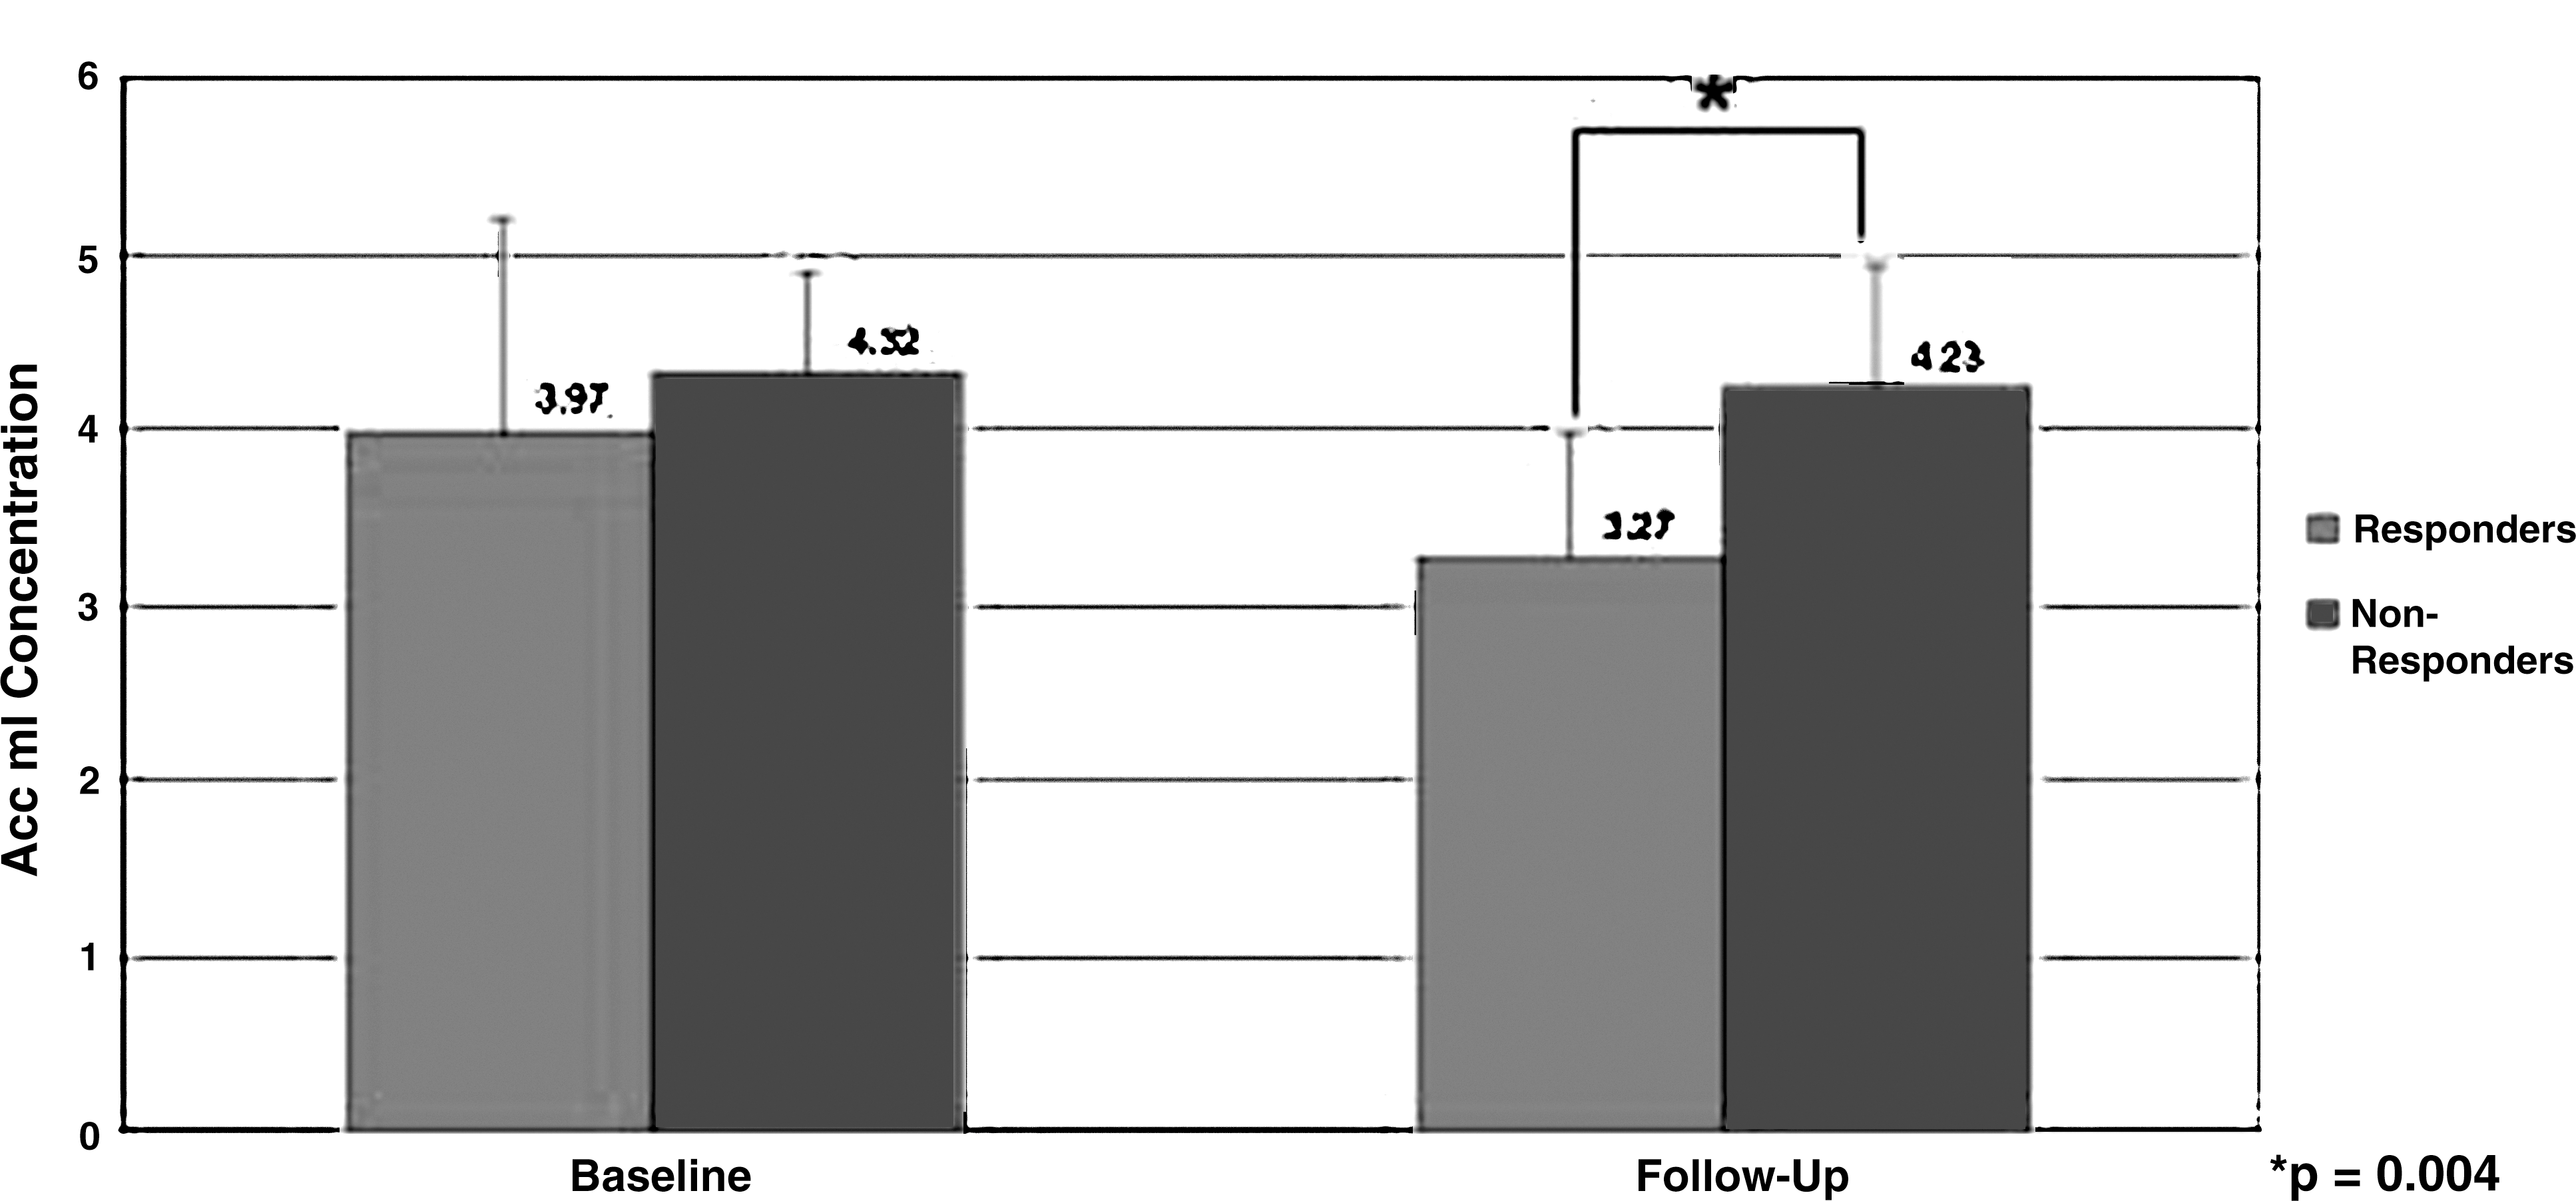
Anterior cingulate cortex (ACC) myo-inositol (mI) levels at baseline and follow-up.
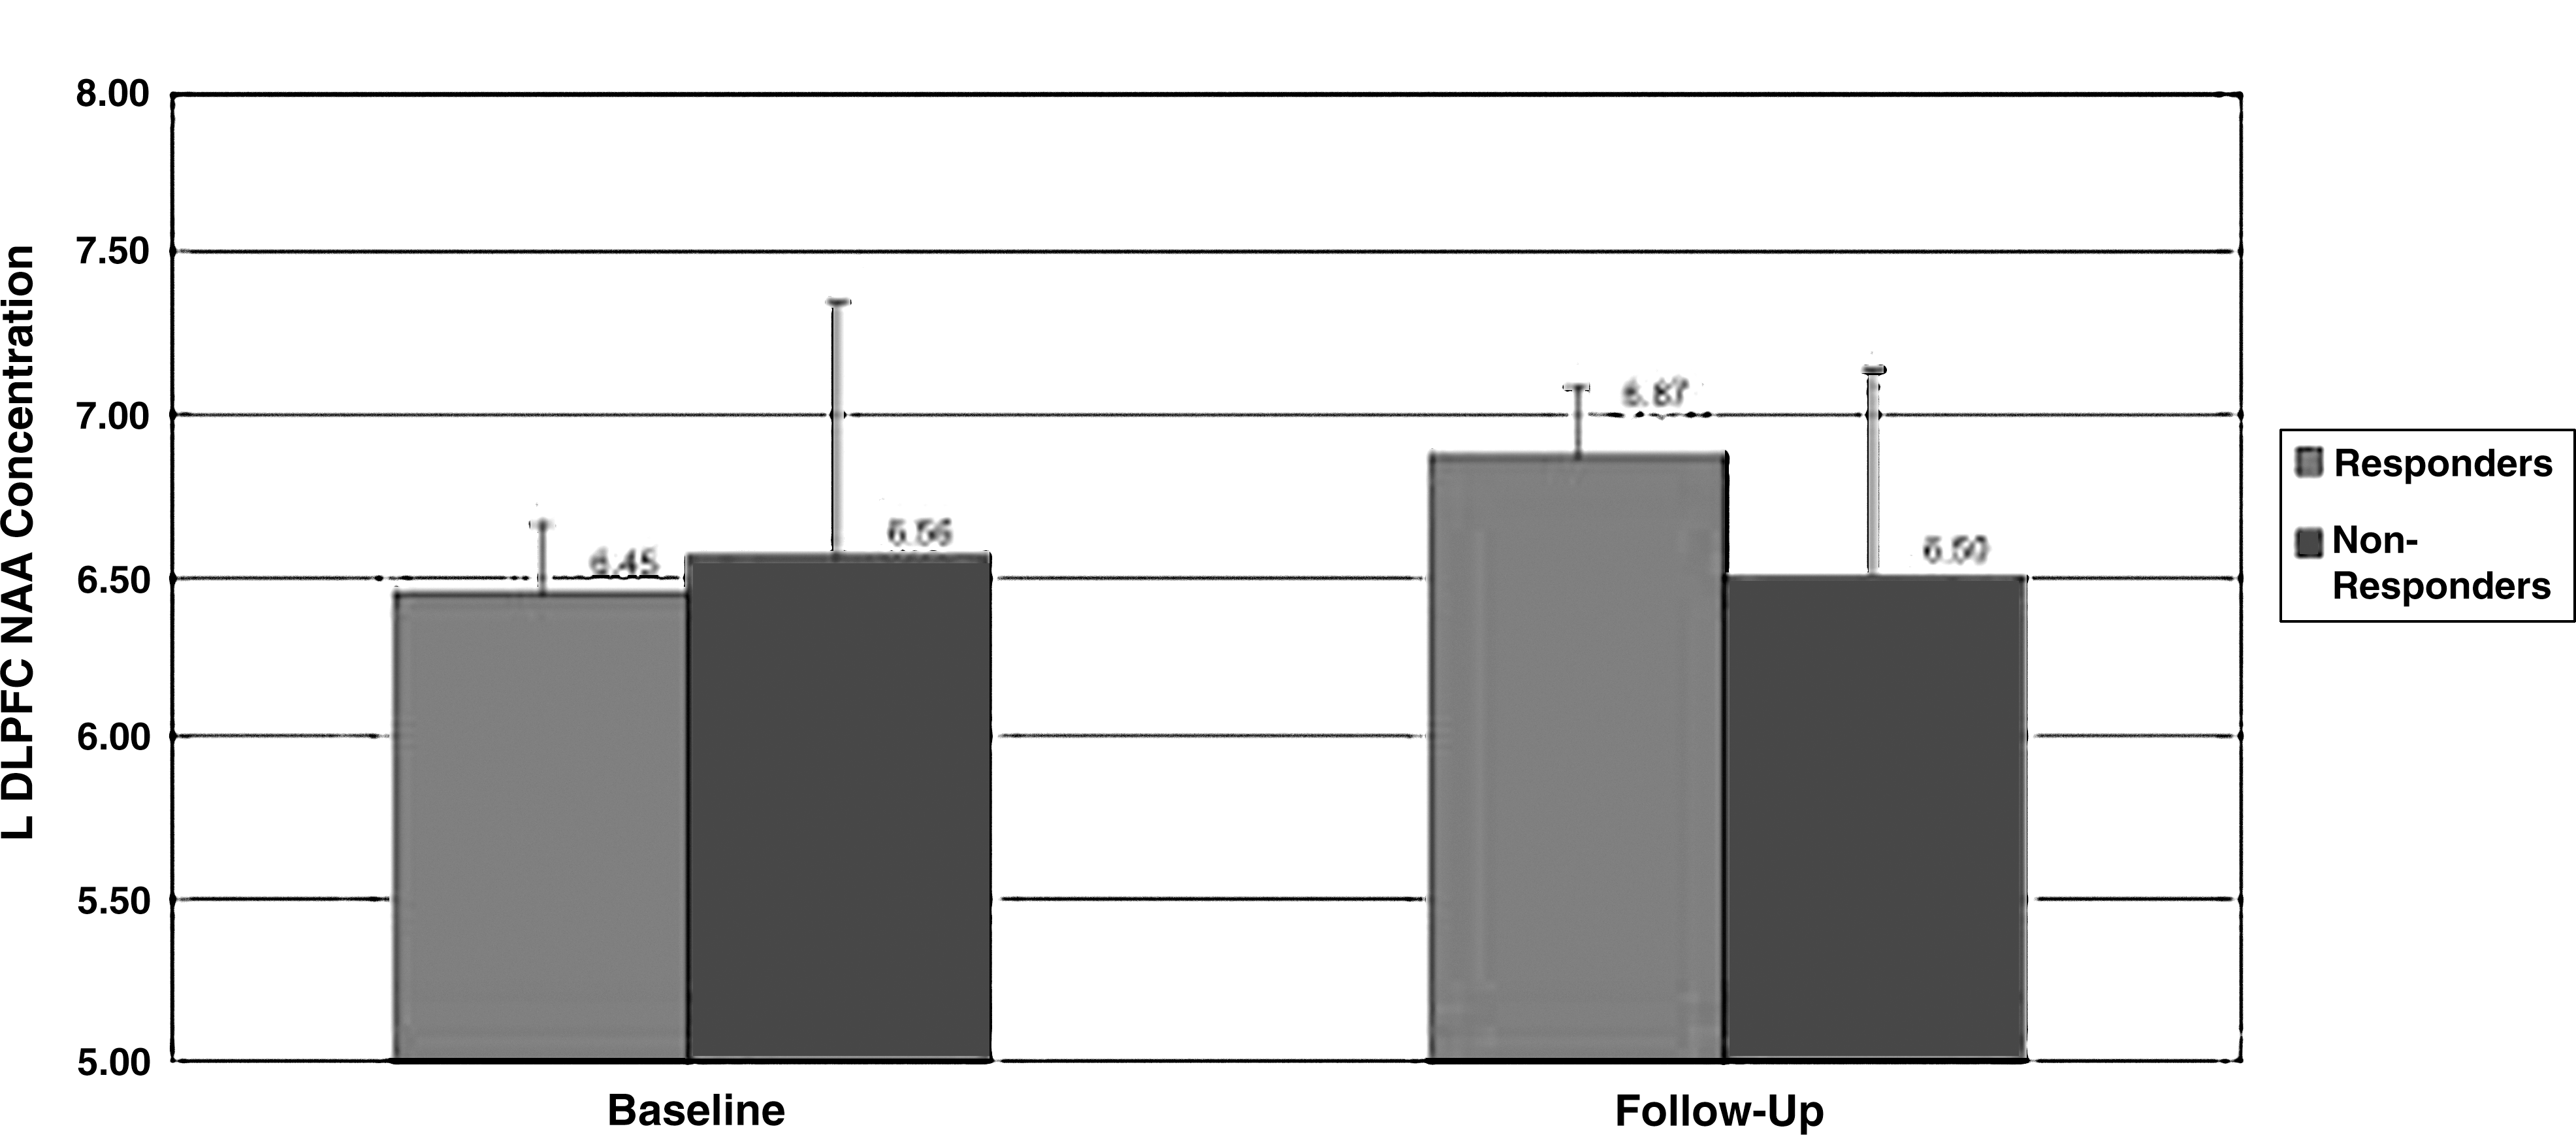
Left dorsolateral prefrontal cortex (DLPFC) N-acetylaspartate (NAA) levels at baseline and follow-up.
First p value given refers to comparison between response groups, second p value refers to comparison between treatment groups. mI, myo-inositol; ACC, anterior cingulate cortex; L DLPFC, left dorsolateral prefrontal cortex R DLPFC, right dorsolateral prefrontal cortex NAA, N-acetylaspartate; IU, institutional units.
There was no difference in age (16.1±2.0 vs. 14.9±1.9 years, p=0.15) or days between scans (51.6±20.1 vs. 46.7±18.2 days, p=0.09) between the QUET and PBO groups; therefore, these variables were not used as covariates for analyses comparing QUET and PBO groups. There was no significant difference in the change in ACC and DLPFC NAA levels in the QUET group versus the PBO group (Wilk's λ >0.05; exploratory post-hoc analyses of variance [ANOVAs] in Table 2). Furthermore, there was no difference between treatment groups in change in ACC mI levels. Values given in Table 2 are for all subjects, and p values were calculated from one-way ANCOVAs, covarying for age or days between scan as appropriate. Finally, there was no significant interaction between responder and medication status, in that medication status was not associated with response status.
Discussion
This study was the first, to our knowledge, to investigate neurometabolite changes in adolescents with bipolar depression treated with QUET. We found that posttreatment ACC mI levels were significantly lower in adolescents who responded to treatment, regardless of whether they were receiving either QUET or PBO. As this effect was not specific to the QUET group, it may reflect changes in mood state rather than treatment response per se. In contrast to the findings of Patel and colleagues (2006), we did not find that pretreatment mI levels predicted response to QUET. However, as there was no PBO group in that study, it is possible that VLPFC mI levels predicted depression improvement over time. Either way, we did not observe a similar finding for ACC mI levels in our subjects treated with PBO or QUET, perhaps because of differences in voxel location or study design, including length and type of treatment. Our results, however, indicate changes in metabolite levels consistent with decreased cellular turnover in the medial prefrontal cortex in adolescents with BD who have resolution of depressive symptoms, regardless of treatment.
Analyses of baseline and change in DLPFC mI levels did not reveal associations with either response or remission. These results are consistent with findings from a previous study of lithium-treated adolescents with bipolar depression, in which VLPFC mI levels did not change significantly with treatment (Patel et al. 2006). We also did not find a significant difference in change of prefrontal NAA concentrations in subjects treated with QUET compared with those treated with PBO, although mean values were decreased for QUET and increased for PBO, with moderate effect sizes (0.43–0.77). These results are different from those of two previous studies in adults with BD that found increases in prefrontal NAA after acute (4-week) (Moore et al. 2000b) and chronic (Silverstone et al. 2003) lithium treatment. Furthermore, a study of olanzapine in manic adolescents found that remitters exhibited increased prefrontal NAA levels, whereas NAA levels decreased in nonremitters (DelBello et al. 2006). However, a study of adults with schizophrenia found no changes in frontal, occipital, caudate, or cerebellar NAA concentrations following up to 2 years of QUET treatment (Bustillo et al. 2008). In a cross-sectional study of adults with BD, however, patients taking valproate and QUET had higher hippocampal NAA/choline ratios than those taking only valproate (Atmaca et al. 2007). These disparate findings suggest that NAA levels may change differentially during QUET treatment based on age of subject, medication type, and brain location studied.
Limitations
Limitations of our study included a relatively small sample size; effect sizes from some comparisons suggested that with additional subjects, we might have found significantly greater decreases in mI levels in responders compared with nonresponders. We also combined data from two different scanners at two different institutions. However, the same MRS acquisition parameters and the same software (LCModel) for metabolite quantification was used at both institutions, and corrections for variations in within-voxel tissue types were consistently applied. Furthermore, by studying change in metabolite concentrations within subjects over time at the same site, site differences are partially controlled for. To ensure that abnormalities in metabolite concentrations were caused by pathology not by tissue content variation of MRS voxel, all metabolite data were also corrected with tissue segmentation data. Finally, we did not have a healthy comparison group; therefore, these results are not generalizable to healthy subjects and we do not know if mI levels approached “normal” levels after resolution of depression.
Conclusions
This is the first study to associate decreased prefrontal neurometabolite levels with response in youth being treated for bipolar depression. Inclusion of a PBO group enabled separation of response to medication versus other mechanisms. Future larger studies in subjects with varying mood states are needed to clarify the neurometabolic effects of QUET in youth with BD.
Clinical Significance
Adolescents in depressive episodes associated with BD may respond to treatment with both QUET and PBO. Mechanisms of improvement in depressive symptoms may be similar regardless of treatment type. mI may be a marker for resolution of depressive symptoms. QUET does not appear to affect prefrontal NAA levels in this population, and therefore its effect on neurometabolites in the context of adolescent bipolar depression remains unclear.
Disclosures
Dr. Chang is a consultant for GlaxoSmithKline, Bristol Myers-Squibb, Lilly, and Merck, and receives research funding from GlaxoSmithKline and Merck. Dr. Strakowski receives research funding from Janssen, Eli Lilly, AstraZeneca, Sumatomo, and Pfizer. Dr. DelBello receives research support from AstraZeneca, Eli Lilly, Johnson and Johnson, Janssen, Pfizer, Otsuka, Sumitomo, GlaxoSmithKline, Merck, and Somerset; is on the lecture bureau for Bristol-Myers Squibb and Merck; and is a consultant for Merck, Schering-Plough, and Pfizer. Dr. Adler receives research support from Abbott Laboratories, AstraZeneca, Eli Lilly, Shire, Janssen (Johnson & Johnson), Pfizer, Repligen, Martek, and Otsuka; is on the lecture bureau for Merck; and is a consultant to Merck. The other authors have no relevant disclosures.