
Abstract
Objective:
Multiple trajectories of posttraumatic stress (PTS) symptoms are hypothesized following disaster in a number of theoretical perspectives. Increasingly, those with rapidly declining, transient, or stable low symptoms are defined as resilient. This article examines trajectories to understand acute reactions to disaster, and explores the need to define resilience as more than just symptom trajectories.
Methods:
An urban school-based sample of youth exposed to both hurricanes Katrina and Gustav (n=141; grades 4 through 8) were assessed for PTS symptoms at 12 months and 6 months pre-Gustav (Times 1 and 2); and then again at 1 month post-Gustav (Time 3).
Results:
Data indicated that there were significant decreases in mean PTS symptoms post-Gustav, but individual trajectories were identified consistent with theory. Whereas an ostensibly resilient group was identified (stable low symptoms), results suggest that the group was heterogeneous in terms of disaster experiences, and that those with low symptoms but relatively high Katrina disaster exposure had a unique coping style.
Conclusions:
Results provide prospective data to support theories of multiple trauma exposure trajectories, and highlight the importance of empirically identifying resilient youth in terms of both functioning and level of risk exposure in disaster samples.
Introduction
R
A critical feature in the accurate empirical identification of resilient youth may be comparability in terms of the level of exposure in each of the trajectories. Conceptually, resilience has been defined by Sroufe (1997) in a manner that emphasizes both the simplicity and subtlety with which the concept can be considered. He states, “Resilience simply refers to the fact that some children facing adversity nonetheless do well (or return to positive functioning following a period of maladaption)” (p. 256). Resilience then is critically defined by 1) exposure to some risk (e.g., facing disaster-related adversity) as well as 2) the relatively positive functioning of some individuals compared with others. However, it also seems critical as a subcomponent of point 1 that the “resilient” have the same level of risk exposure as the non-resilient (for related discussion, see Luthar et al. 2000). Risk has been defined as “characteristics of the person or the environment that are associated with the increased probability of maladaptive developmental outcomes” (Compas et al. 1995, p. 273).
Community level exposure to a disaster represents risk, but samples of disaster-exposed youth can be very heterogeneous with regards to their level or number of exposure experiences. There often appears to be a moderate dose-response relationship with more or more intense experiences related to higher symptoms or otherwise more intense negative reactions (La Greca et al. 1996; Weems et al. 2007). Therefore, a group with a stable low trajectory may seem “resilient,” but in fact may simply be relatively less exposed to traumatic experiences. Identifying resilient groups that are commensurate in level of risk exposure to “non-resilient” groups has theoretical implications in terms of the accurate identification of predictors of resilience and potential policy implications in terms of accurate estimation of services needed. For example, unique coping strategies (i.e., non-avoidant coping) might characterize those who have had a high dose of exposure but nonetheless report low levels of symptoms (i.e., truly resilient) compared to those with low symptoms or those who have intense/chronic problems (see e.g., Dempsey et al. 2000).
This study focuses on identifying and utilizing PTS symptom trajectories and the nuanced definition of resilience, to better understand youth's acute reactions in the immediate aftermath of a disaster. Drawing from Bonanno et al. (2010, 2011) and the broader literature on internalizing trajectories (i.e., studies and theory suggest increasers, decreasers, stable high, stable low; Feng et al. 2008 [see Weems 2008 for review]) the expectation was that at least four different trajectories could be identified. Specifically, person-centered cluster analyses were used to identify if the different theoretically posited trajectories could be identified within a sample of youth exposed to Hurricane Katrina. Hurricane Katrina (United States landfall August 29, 2005) was an intensely traumatic event for many youth, and has had a substantial effect on the mental health of many in the Gulf region (Kessler et al. 2008; Marsee 2008; Weems and Overstreet 2008; Weems et al. 2010). For example, Weems et al. (2010) reported no significant decrease in PTSD symptoms from 24 to 30 months post-Katrina in a sample of 191 New Orleans youth, consistent with epidemiological studies of adults in the region following Katrina (Kessler et al. 2008).
For the present study, 141 youth from Weems et al. (2010) were reassessed 1 month following Hurricane Gustav. Hurricane Gustav caused serious damage and casualties in the Caribbean, with more than $6 billion in damages, and triggered one of the largest evacuations in United States history with >3,000,000 people evacuating the Gulf. Gustav made landfall along the Louisiana coast with 170 km/hour winds on August 31, 2008. A trajectory approach to examining acute reactions (i.e., to Gustav) recognizes that each individual's acute mental health reactions to disaster are partially determined by their pre-existing allostatic load (McEwen and Stellar 1993; McEwen 2003) or pre-existing emotional symptoms (La Greca et al. 1998; Weems et al. 2007). Unlike with the Hurricane Katrina disaster, the Hurricane Gustav evacuation was relatively successful, the levees held, and damage was significantly less in the New Orleans area (Cigler 2009; Comfort et al. 2009). Intuitively, one might expect general increases in PTSD symptoms following a second traumatic event. Such a view would be consistent with results of cross-sectional research of the multiple impacts of Gustav and Katrina in an adult sample (Harville et al. 2011). However, given the relatively positive experience of Gustav compared with Katrina, as well as the time frame since Katrina, it is also plausible that mean level declines might dominate. However, there should be continued difficulties for subsamples of youth, particularly those with relatively high levels of Gustav stress exposure and those with high levels of pre-Gustav PTS. In addition, whereas we expected that a stable low group would be identified, we tested the idea that these youth might not all represent a truly resilient group by testing if a stable low group would tend to have the lowest dose of hurricane-related stress exposure, and if so, to examine if differences in non-avoidant coping emerged among low, resilient, and chronic subsamples.
Methods
Participants
This study utilized a prospective design with a sample of 141 school-aged children from New Orleans. These youth represented 4th through 8th graders attending school in a New Orleans neighborhood that had received massive damage and substantial flooding (participants reported an average of seven exposure experiences) during Hurricane Katrina and were part of a longitudinal study conducted after Hurricane Katrina (Weems et al. 2010, 2012). Common Katrina-related events reported included: “thought someone might die” (79%), “clothes or toys ruined” (78%), “home badly damaged or destroyed” (65%), “witnessed others hurt during the storm” (45%), “pet hurt or died” (41%), “thought you might die during the storm” (38%), and “had trouble getting food and water” (20%).
The sample was evaluated for exposure to traumatic experiences, distress/fear, and PTSD symptoms related to Hurricane Katrina at 24 months and 30 months post-Katrina, which was 1 year and 6 months pre-Gustav (Time 1 and Time 2; findings reported in Weems et al., 2010). The sample was evaluated again at 1 month post-Gustav (Time 3) for PTSD symptoms, exposure to traumatic experiences and distress/fear related to Hurricane Gustav. The sample at Time 3 was 9–16 years of age (median age=12 years) and was 52% male. Youth reported their ethnicities as 96% African American, 3.5% “mixed African-American/other,” and 0.5% Hispanic. The schools serve youth predominantly from low-income families (i.e., school data indicate that 97% of the students receive free lunch, 2% are on a reduced payment, and 1% pay for lunch). Comparison of the youth who completed the Time 1 and 2 assessments only (n=191) versus the youth who also completed the Time 3 assessment (n=141 or 73.8% retention) revealed no statistically significant differences in sex, ethnicity, level of distress/fear during Katrina, or PTSD symptoms at Times 1 and 2.
Measures
Symptoms of PTSD were measured using a modified version of the Post Traumatic Stress Reaction Index for Children (PTSD-RI; Frederick et al. 1992). The PTSD-RI is one of the most widely used instruments to assess posttraumatic stress reactions and, therefore, allows for easy comparison among studies. As was the case in previous research (La Greca et al. 1996; Vernberg et al. 1996; Hensley and Varela, 2008), the PTSD-RI used in this study focused on the hurricane/disaster as the trauma of focus, and contained 20 items with answer choices modified for ease of administration from the original five options to three options (none of the time, some of the time, most of the time: Coded as 0, 2, and 4, respectively). In this study, youth were asked to rate their symptoms in response to hurricanes. Total PTSD-RI scores, therefore, range from 0 to 80. Internal consistency for the present sample was good (α for each time>0.85). PTS severity groups were also created using the system developed by Frederick et al. (1992), which includes the following categories: Doubtful (score of 0–11), Mild (12–24), Moderate (25–39), Severe (40–59), and Very Severe (60–80).
Exposure experiences and hurricane-related distress/fear were assessed via a survey of exposure to the hurricane and its aftermath that was based on the work of La Greca and colleagues (La Greca et al. 1996, 1998; Vernberg et al. 1996). Katrina exposure was assessed at Time 1 via a 16 item survey of exposure to the hurricane and its aftermath. (Common disaster-related experiences were listed under the “Participants” section.) Respondents indicated Yes (1) or No (0) to whether they were exposed to each event, and these items were summed to make an exposure events score (i.e., number of hurricane-related exposure events youth experienced during and after Hurricane Katrina). The Hurricane Gustav exposure was assessed at Time 3 and was computed via a similar six item set of questions. Items included: “Did you think you would die during Gustav?” and “Did you think you would be badly hurt during Gustav?” Respondents indicated Yes (1) or No (0) and these items were summed (mean=1.5, SD=1.5). The survey also included global assessments of the level of distress in which youth were asked: “Overall how scared were you during hurricane Gustav?” (Time 3) and “Overall how scared were you during hurricane Katrina?” (Time 1) and were scored 0 “not at all,” 1 “a little,” 2 “a lot,” and 3 “a whole lot.”
Four items from the Children's Coping Strategies Checklist (Sandler et al. 1994) were used to measure avoidant coping at Time 1. Items asked: “When I have a problem I…” and example items used included: “Try to stay away from the problem” and “Try to stay away from things that make me feel upset.” Items were scored from 0 “none of the time” to 3 “most of the time.” Scores were averaged to form avoidant coping scores in which low scores indicated little or no avoidant coping behavior and high scores indicated high avoidant coping behavior.
Procedures
Data collection was conducted as part of the schools' counseling curriculum, and written informed consent for the counseling curriculum and use of the data in research was obtained from the parent each school year (>90% response rate). Oral assent was obtained from each child (i.e., children were not required to fill in the questionnaires or to participate). The schools involved in this study used an innovative school curriculum put in place after Hurricane Katrina to try to help the school counselors track student problems and identify needs over time. Therefore, all three waves of data were collected directly in school classrooms; therefore, the main reason for attrition at Time 3 was that students moved to a different school. The university institutional review board (IRB) reviewed the procedures, and exempted approval was obtained. Youth completed the measures in a group classroom setting and were assisted by trained staff. A staff member read younger children the instructions and each item, and trained staff assisted individual children as necessary as had occurred in previous research (La Greca et al. 1996; Vernberg et al. 1996).
Results
A comparison of hurricane-related experiences (common to both the Katrina and Gustav question set) between Katrina and Gustav for the sample is presented in Table 1. As can be seen in the table, disaster-related experiences were less common for Gustav. Distribution of answers to the question, “Overall how scared were you during hurricane Gustav?” were 35% indicating “not at all,” 39% indicating “a little,” 17% indicating “a lot,” and 9% indicating “a whole lot.” As has been noted, at Time 1, participants were asked an identical question about Katrina. On average, youth reported being significantly less scared during Gustav than during Katrina (mean difference=0.85; S.E.=0.1; t[140]=8.25, p<0.001). Mean PTSD-RI scores were as follows: Time 1, 23.78(17.5); Time 2, 23.65(15.1); and Time 3, 17.0(14.7). Results indicated no significant change from Time 1 to Time 2, but did indicate a significant decrease from both Time 1 (t[140]=5.33, p<0.001) and Time 2 (t[138]=5.82, p<0.001) to Time 3.
In terms of PTSD severity, children were classified by severity of symptoms using the system developed by Frederick et al. (1992) at Time 1: “Doubtful” 25%, “Mild” 35%, “Moderate” 21%, “Severe” 14%, and “Very Severe” 5%. At Time 2: “Doubtful” 22%, “Mild” 40%, “Moderate” 23%, “Severe” 12%, and “Very Severe” 4%. At Time 3: “Doubtful” 47%, “Mild” 26%, “Moderate” 18%, “Severe” 8%, and “Very Severe” 1%. These trends suggest decreases in severity. Next, Wilcoxon signed rank tests on the PTSD-RI groups (coded 1 “Doubtful” to 5 “Very Severe”) were conducted to examine changes in PTSD severity groups from Time 1 and Time 2 to Time 3. Fifty percent of the sample decreased from a higher to a lower severity group, whereas 16% increased to a higher severity group, and 34% remained the same from Time 1 to Time 3 (Z=−4.66, p<0.001). Forty-six percent of the sample decreased from a higher to a lower severity group, whereas 12% increased to a higher severity group, and 42% remained the same from Time 2 to Time 3 (Z=−4.88, p<0.001). Whereas these analyses suggest that most youth are decreasing at Time 3, there does appear to be a subsample who are increasing or staying the same.
Cluster analyses were next used to identify groups based on the theoretical expectations about the nature of trajectories noted. Results of these analyses using a log-likelihood distance measure and examination of clustering parameters (i.e., the pseudo-F statistic; see Milligan and Cooper 1985; and information criterion measures, specifically the Schwarz Bayesian Information Criterion; BIC, see Fraley and Rafferty 1998), indicated that a five cluster solution provided an acceptable model for the data (i.e., high pseudo-F's and BIC's similar to or lower than two, three, four, and six cluster solutions; see Fraley and Rafferty 1998). Importantly, this solution was also consistent with theoretical predictions and past research, consistent with the trends reported, and had adequate group sizes. The five different trajectories with group sizes are depicted in Figure 1, and help point out potentially important subgroups. In particular, although the general trend was one of decline, there was a group of youth with increasing symptoms. Moreover, there was a group of steep decreasers as well as those with relatively stable high symptoms. The replicability of the five cluster solution trajectory pattern was tested by drawing random 70% subsamples from the data similar to previous research (see Wills et al. 1996; Weems et al. 2002). The essential same patterns of trajectories were evident across the five clusters across subsamples.
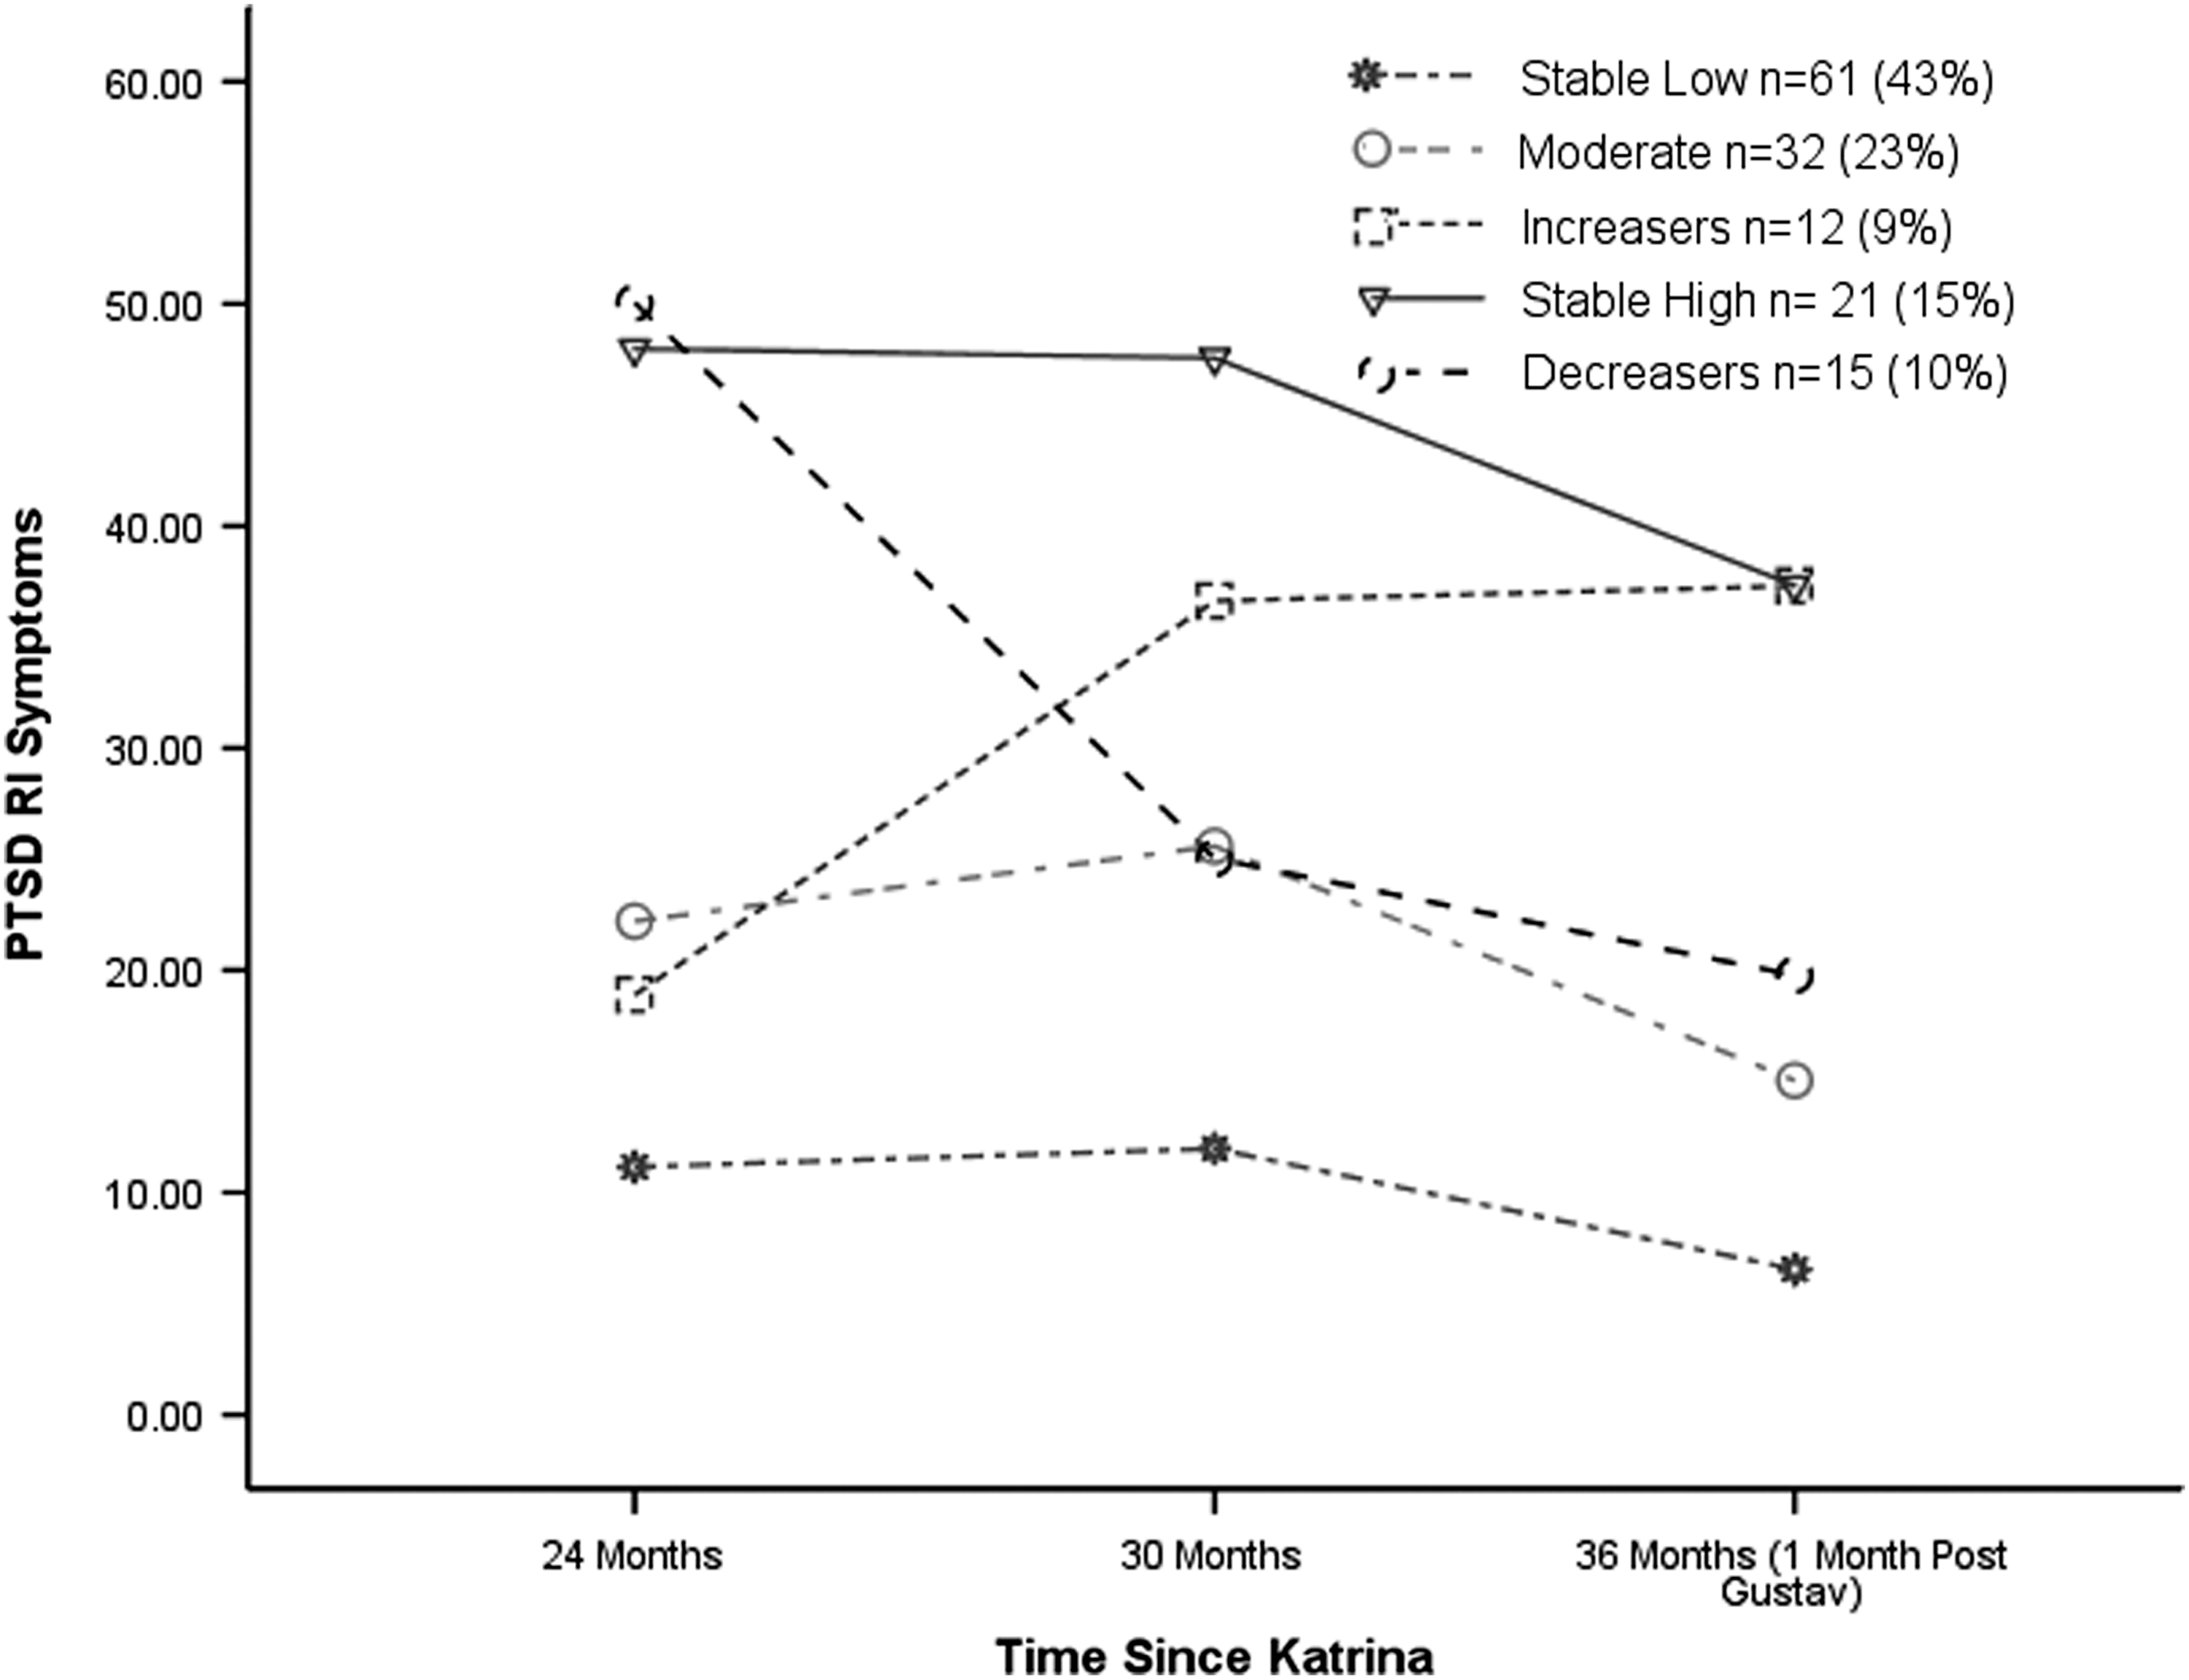
Cluster analysis defined Post Traumatic Stress Reaction Index for Children (PTSD-RI) symptom trajectories.
As seen in Figure 1, the largest group was the stable low group with n=61 or 43% estimated as being potentially resilient. The cluster-defined groups were then compared on level of Katrina and Gustav exposure levels using ANOVA, and results are summarized in Table 2. The groups differed in levels of both Katrina and Gustav exposure, with the stable low group reporting the lowest levels of exposure. This stable low group also appears to have reported significantly less avoidant coping than the chronic high group (Table 2).
p<0.05; ** p<0.001.
Like superscripts across columns indicate significant differences (p<0.05).
PTSS, posttraumatic stress symptoms.
Within the stable low group, there were 22 youth with average or above average levels of Katrina exposure (i.e., seven or more events reported). This estimates the number of resilient youth at only 16% of the sample as opposed to 43% (i.e., they had low symptoms but high exposure experiences). Next, the sample was regrouped based on the distribution of exposure into low (stable low symptoms, low Katrina exposure), resilient (stable low symptoms but high Katrina exposure), and chronic (stable high symptoms) subsamples. Reanalysis (again see Table 2) shows that only the resilient group had significantly low levels of avoidant coping use, with the low (low symptoms, low exposure) group actually reporting similar levels of avoidant coping to those in the chronic stable high group. Further comparisons indicated that the resilient group had significantly lower levels of avoidant coping (p's<0.05) than the moderate and increaser groups (the difference between those in the resilient group and those in the decreaser group was p=0.056).
Additional analyses were conducted to further illustrate and confirm the nature of PTS trajectories by exposure levels. First, linear regression analysis tested if Gustav exposure interacted with initial PTSD symptoms (Time 1) to predict post-Gustav PTSD symptoms (Time 3). Results indicated a significant interaction of PTSD at Time 1 by level of Gustav exposure (β=0.30, p<0.01). Post-hoc probing of the interaction (as suggested by Holmbeck 2002; i.e., simple slopes conditional analyses,±1 SD) indicated that among those with high Gustav exposure, there was a stronger association between Time 1 and Time 3 PTSD symptoms (β=0.67, p<0.01), and a smaller association among those with low Gustav exposure (β=0.30, p<0.01).
The effect of Katrina exposure on initial PTS levels and Gustav exposure on the trajectory of PTS symptoms was next examined with multilevel modeling analyses (using hierarchical linear modeling [HLM] 7; Raudenbush et al. 2011) to test the full Time 1, Time 2, to Time 3 trends. Specifically, the HLM analyses nested level 1 change (slopes) in PTS as a function of Gustav exposure (level 2) controlling for the effect of Katrina exposure (level 2) on PTS intercepts. The results of the HLM analysis indicated that there was a significant effect of Katrina exposure on PTS levels (intercepts; coefficient=2.18; t[139]=6.29, p<0.001) and a significant effect of Gustav exposure on the slopes (coefficient=0.87; t[278]=2.88, p<0.01; overall model random effects χ2[139]=451.74, p<0.001). The results are depicted in Figure 2. High levels of Katrina exposure were associated with relatively high levels of PTS (differences in intercepts). Low levels of Gustav exposure were associated with relative decreases in symptoms over time, whereas high levels of Gustav exposure were associated with relatively more stable PTS over time (differences in slopes).

Multilevel modeling Post Traumatic Stress Reaction Index for Children (PTSD-RI) trajectories as a function of Hurricanes Katrina and Gustav exposure levels.
Discussion
The results of this study advance the understanding of youth acute reactions to disaster, and point to the need to empirically define resilience as more than stable low levels of symptoms in disaster-exposed samples. Focusing only on symptom levels may hide group differences in the level of exposure and thus lead to erroneous conclusions about predictors of resilience. Findings also add to the understanding of long-term symptom expression of PTS symptoms in disaster-exposed youth and the role of subsequent exposure to a relatively less traumatic disaster (i.e., Hurricane Gustav). As noted, research on previous disaster-exposed samples suggests that youth symptoms tend to significantly remit over time (La Greca et al. 2002), but not for all youth, and not for many youth exposed to Hurricane Katrina (Weems et al. 2010). A number of factors may influence rates of decline, and the typical pattern of remission may be less evident in certain circumstances and contexts (Yule et al. 2000). In this study, we found significant declines in symptoms 1 month post-Gustav. This might initially be seen as rather unexpected and unintuitive (La Greca et al. 1998; Harville et al. 2011). However, results of longitudinal studies often differ with conclusions based on cross-sectional results (e.g., Harville et al. 2011), and highlight the need for prospective analyses of the effect of multiple traumas on youth functioning.
Another reason for the general declines may be found in the idea that the Gustav experience provided a form of exposure therapy (Silverman et al., 2008) in which youth confronted a similar situation but with generally better outcomes. Comparison of these youths' disaster-related experiences and fear during the two events (between Gustav and Katrina) are consistent with this interpretation. Whereas this interpretation should be viewed as theoretical speculation until replicated in additional samples of youth, there is also research to suggest that, for some individuals, a traumatic experience can be associated with positive outcomes (termed posttraumatic growth; see e.g., Calhoun and Tedeschi 2006; Kilmer and Gil-Rivas 2010). The findings in this article, therefore, may be seen as consistent with posttraumatic growth theory (Calhoun and Tedeschi 2006; Kilmer and Gil-Rivas 2010) with the caveat that this seems to be mainly for those who experienced Gustav as a relatively low-level stressor. That is, Gustav's ultimate consequences proved to many involved to be a reassurance that the emergency system was working (e.g. improvement in evacuation and levees) and a less traumatic event.
In terms of subsamples, 10% of the sample reported severe or very severe symptoms at Time 3, indicating that a number of the youth were dealing with significant distress. La Greca et al. (2010) similarly reported that 10% of their school-based sample reported severe or very severe symptoms on the PTSD-RI at 21 months post Hurricane Charley (landfall in Florida). The person-centered analyses in this study suggest that, for subsamples of the youth, symptoms are not remitting as quickly, or may be increasing (see Figs. 1 and 2). The results in this sample were consistent with theoretical syntheses about the nature of trajectories post-disaster (Bonanno et al. 2010, 2011) and also with models of childhood anxiety symptom trajectories more broadly (Weems et al. 2002; Feng et al. 2008; Weems 2008). These results point to the practical importance of identifying predictors of those whose symptoms are likely to remit (i.e., the decreasers in Fig. 1) versus those who initially may not look in need of intervention but later go on to develop worsening symptoms (i.e., the increaser group).
A trajectory approach to examining acute reactions (i.e., to Gustav) emphasizes that each individual's acute mental health reactions to disaster are partially determined by their preexisting symptom levels and preexisting exposure to stress (McEwen and Stellar 1993; La Greca et al. 1998; McEwen 2003; Weems et al. 2007). Findings were highly consistent with this notion. Specifically, the present findings augment previous research showing that pre-hurricane trait anxiety levels predict elevated PTS symptoms above and beyond exposure to the trauma (La Greca et al. 1998; Weems et al. 2007) by showing that that pre-existing PTS and Katrina exposure were strongly associated with elevated post-Gustav PTS.
A relatively large group (43%) with a stable low trajectory was identified, and, whereas on the surface these youth might all have been considered resilient, the group was not homogeneous in terms of their level of exposure. When a resilient group was defined according to both low symptoms and levels of Katrina experiences (group average or higher) comparable to a non-resilient group (i.e., chronic/stable high), a much smaller portion (n=16%) would actually be considered resilient. Comparability, in terms of level of exposure, seems critical to defining true resilience such that labeling groups “resilient” who do not have similar levels of exposure to the risk is at odds with definitions of resilience. The empirical importance of this proposition was highlighted by the findings that a comparison of all stable low with stable high subjects would have led to an erroneous conclusion about the use of avoidant coping strategies. It was only the truly resilient (low symptoms and high exposure) who reported low levels of avoidant coping strategies.
Findings also have potential policy implications in terms of accurate estimation of services needed. Drury et al. (2008) have suggested that even though the federal government allocated a large amount of funding for disaster-related mental health response to Katrina through the Federal Emergency Management Association (FEMA), the funds were not effectively used to provide increased treatment services in the region or to expand the training of clinicians in evidence-based approaches. This is because the Stafford Disaster Relief and Emergency Assistance Act, which provided the federal assistance, delegated such funds for “crisis counseling” (i.e., short-term services) instead of investing in mental health services or infrastructure (which have long-term implications). The data in this study point to the importance of developing longer-term strategies for allocation of disaster funds, to help reduce the mental health burden in disaster-exposed communities (see also Weems 2010).
Limitations
Although this study has several methodological advances, including the use of prospectively collected data, this study is not without limitations. The main limitation is that causal conclusions about the linkages reported in this study cannot be made. Moreover, all of the data came from youth report. Youth have consistently been found to be valid reporters (and sometimes better reporters than their parents) of their own internalizing distress (see e.g., Weems et al. 2005). However, it might be the case that reports from other sources (i.e., parents) would have resulted in different findings. Finally, a limitation to generalizing results to other populations is that the study sample was composed of predominantly minority youth. Whereas this is a positive aspect in that it extends the literature to a population that has been largely understudied (Rabalais et al. 2002), the potential effect on majority youth is less clear from this sample.
Footnotes
Disclosures
No competing financial interests exist.