




Abstract
Objective:
An imbalance of excitatory and inhibitory neurotransmission in autism spectrum disorder (ASD) has been proposed. We compared glutamate (Glu), glutamine (Gln), and γ-aminobutyric acid (GABA) levels in the anterior cingulate cortex (ACC) of 13 males with ASD and 14 typically developing (TD) males (ages 13–17), and correlated these levels with intelligence quotient (IQ) and measures of social cognition.
Methods:
Social cognition was evaluated by administration of the Social Responsiveness Scale (SRS) and the Reading the Mind in the Eyes Test (RMET). We acquired proton magnetic resonance spectroscopy (1H-MRS) data from the bilateral ACC using the single voxel point resolved spectroscopy sequence (PRESS) to quantify Glu and Gln, and Mescher–Garwood point-resolved spectroscopy sequence (MEGA-PRESS) to quantify GABA levels referenced to creatine (Cr).
Results:
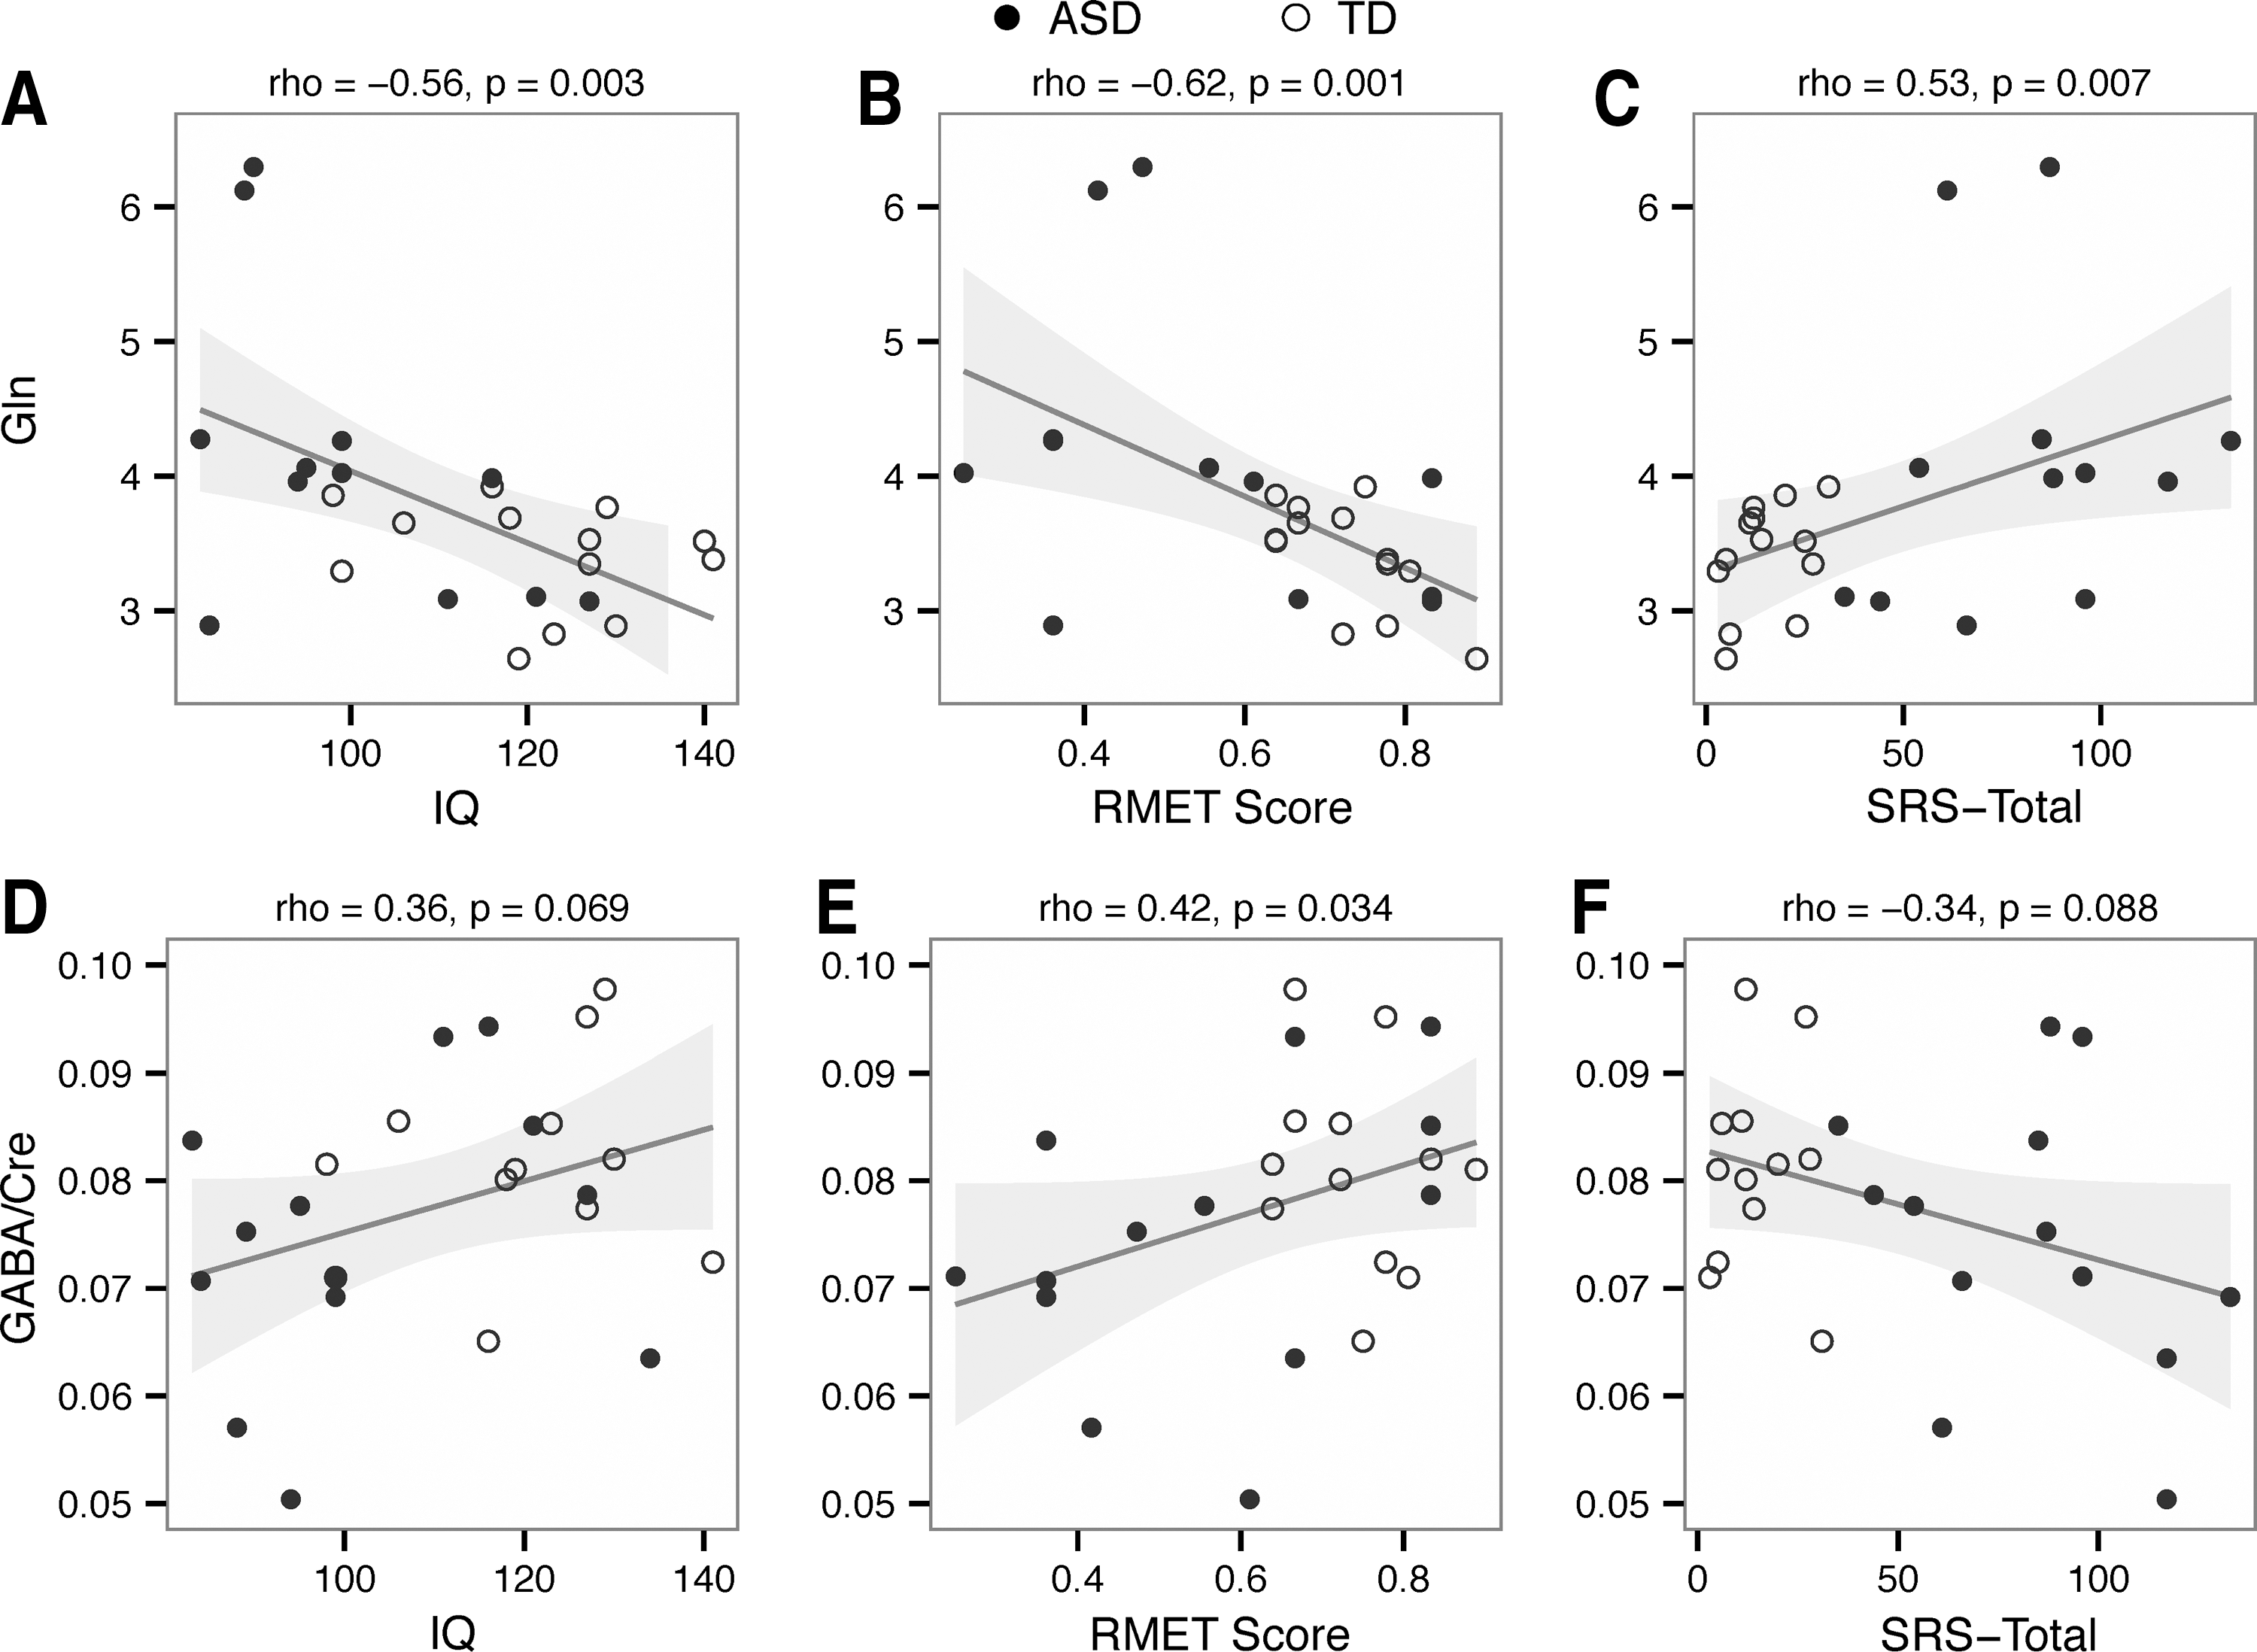
There were higher Gln levels (p=0.04), and lower GABA/Cre levels (p=0.09) in the ASD group than in the TD group. There was no difference in Glu levels between groups. Gln was negatively correlated with RMET score (rho=−0.62, p=0.001) and IQ (rho=−0.56, p=0.003), and positively correlated with SRS scores (rho=0.53, p=0.007). GABA/Cre levels were positively correlated with RMET score (rho=0.34, p=0.09) and IQ (rho=0.36, p=0.07), and negatively correlated with SRS score (rho=−0.34, p=0.09).
Conclusions:
These data suggest an imbalance between glutamatergic neurotransmission and GABA-ergic neurotransmission in ASD. Higher Gln levels and lower GABA/Cre levels were associated with lower IQ and greater impairments in social cognition across groups.
Introduction
A
Nevertheless, there are no medical therapies to target the core social cognition deficits in ASD. The development of such treatments depends upon an understanding of the pathophysiology of ASD, which has been proposed to be characterized by an imbalance in excitatory glutamatergic and inhibitory γ-aminobutyric acid (GABA)-ergic neurotransmission (Fatemi 2008). Molecular targets in the glutamate- (Glu) and GABA- signaling pathways have been the focus of recent efforts to develop such medical treatments, but development has been hampered by the lack of valid biomarkers to identify those most likely to respond to these treatments.
Glu and GABA abnormalities in ASD include postmortem differences in the expression of Glu transporters (Purcell et al. 2001), GABA-A (Fatemi et al. 2009b) and GABA-B receptors (Fatemi et al. 2009a), enzymes that convert Glu to GABA (Yip et al. 2007, 2009), metabotropic (Fatemi and Folsom 2011) and ionic (Purcell et al. 2001) Glu receptors, and regulatory proteins affecting Glu receptor activity (Fatemi and Folsom 2011). Multiple GABA receptors are underexpressed in ASD in multiple brain regions, including the anterior cingulate cortex (ACC) (Oblak et al. 2009, 2010). In clinical trials of glutamate receptor antagonists and GABA receptor agonists in individuals with Fragile X syndrome (more than half of whom had comorbid ASD), a subset of patients showed improvement in social impairments (Jacquemont et al. 2011; Berry-Kravis et al. 2012). However, there is a critical need for biomarkers that can be used a priori to predict which individuals will respond to these treatments.
After synaptic reuptake into astrocytes, Glu is stored as glutamine (Gln) until being recycled within the presynaptic terminal (Magistretti and Pellerin 1999). Because of this rapid recycling of excess Glu and the large metabolic pool of Glu that is not involved in neurotransmission, Gln concentration may be a more sensitive measure of synaptic glutamatergic neurotransmission than Glu (Ongur et al. 2008). Other studies in mood disorders have implicated the Gln/Glu ratio as a more sensitive marker of glutamatergic function (Yuksel and Ongur 2010).
Proton magnetic resonance spectroscopy (1H-MRS) quantitatively measures regional cortical levels of Glu, Gln, and GABA, although frequently Glu and Gln are reported together as Glx because of difficulty separating out the resonances. Previous 1H-MRS studies have demonstrated variable changes in Glx by region and age in ASD, with the majority demonstrating elevated levels. In children and adolescents with ASD, Glx has been reported to be decreased in the frontal and occipital gray matter and cerebellum (DeVito et al. 2007), and increased in the ACC (Bejjani et al. 2012). In adults with ASD, Glx has been reported to be increased in the amygdala/hippocampal region (Page et al. 2006) and auditory cortex (Brown et al. 2013), and decreased in the ACC (Bernardi et al. 2011) and basal ganglia (Horder et al. 2013). Joshi and colleagues (Joshi et al. 2013) reported increased Glu in the ACC in adolescents with ASD (similar age range to our study).
GABA levels have been studied less frequently because of the specialized editing techniques needed to segregate the GABA content; however, three studies have found decreased levels in youth with ASD (Harada et al. 2011; Gaetz et al. 2014; Rojas et al. 2014). Neither Glx nor GABA has been associated with intelligence quotient (IQ). No published studies to date have simultaneously measured Glu, Gln, and GABA in regions known to be involved in social cognition. Moreover, no studies have reported correlation of these 1H-MRS parameters with clinical phenotype.
The ACC has been implicated in the neural basis of social impairments in ASD (Mundy 2003). Abnormalities in the ACC have been demonstrated in individuals with ASD through structural (Hyde et al. 2010), functional (Agam et al. 2010), and diffusion tensor (Thakkar et al. 2008) imaging studies, as well as neuropathologically (Oblak et al. 2009, 2010). Glucose metabolism measured by positron emission tomography in the ACC is also lower in individuals with ASD (Haznedar et al. 2000). Therefore, we have chosen the ACC as an ideal brain region to investigate glutamatergic and GABA-ergic abnormalities in ASD and their association with social cognition deficits.
We measured Glu, Gln, and GABA levels in the ACC of adolescents with ASD and a typically developing (TD) control group. We investigated correlations with IQ, clinical measures of social cognition, and other clinical internalizing and externalizing symptoms. We hypothesized that adolescents with ASD would have higher Glu and/or Gln levels and lower GABA levels than the TD group, and that social cognition would be negatively correlated with Glu and/or Gln and positively correlated with GABA in the ACC.
Methods
Participants
Thirteen males with ASD (mean±SD age: 14.9±1.5 years, range: 13.1–17.5 years) and 14 TD male controls (age: 14.7±1.8 years, range: 13.1–17.4 years) participated in the study. The participants were recruited through the Child and Adolescent NeuroDevelopment Initiative (CANDI) at the University of Massachusetts Medical School (UMMS) from the current pool of clinic patients, word of mouth, advertisements in local newspapers, and online advertising. A telephone screen was administered to determine participant eligibility.
Inclusion criteria for the study were: Males 13–17 years of age with Full Scale Intelligence Quotient (FSIQ) >70 as estimated by two subtests of the Weschler Abbreviated Scales of Intelligence (WASI) (Weschler 1999). Exclusionary criteria included major medical or neurological illness, primary psychiatric diagnosis other than ASD, with the exception of mild anxiety disorder (not requiring medication) and/or attention-deficit/hyperactivity disorder (ADHD), use of anticonvulsant medication or psychoactive medication with the exception of stimulants, past or current history of claustrophobia, exquisite sensitivity to noise, metal fragments or implants, or any other contraindication to magnetic resonance imaging (MRI). Parents and participants ≥16 years of age provided written consent, and participants <age 16 provided written assent, as approved by UMMS Institutional Review Board (Docket # H-14247).
Clinical assessment
Five individuals met Diagnostic and Statistical Manual of Mental Disorders, 4th ed. (DSM-IV) criteria for autistic disorder, six met criteria for Asperger's disorder, and two met criteria for pervasive developmental disorder-not otherwise specified, as determined by unstructured clinical interviews with a child psychiatrist (D.M.C.) and administration of the Autism Diagnostic Observation Schedule (ADOS) by a research- reliable trained clinician (A.F.) (American Psychiatric Association 1994). Psychiatric comorbidities were assessed by unstructured clinical interviews with a child psychiatrist (D.M.C.) and the Child Behavior Checklist (CBCL) was used to assess multiple domains of psychiatric functioning (Achenbach and Rescorla 2001).
Neurocognitive testing and measures of social cognition
All adolescents were administered two subtests of the WASI (Vocabulary and Matrix Reasoning) to obtain an estimate of FSIQ (Weschler 1999). The Social Responsiveness Scale (SRS) was administered to the primary caregiver. The SRS is a quantitative measurement of various dimensions of interpersonal behavior, communication, and repetitive/stereotypic behaviors, including subscales for Social Awareness, Social Cognition, Social Communication, Social Motivation, and Autistic Mannerisms (Constantino and Gruber 2005). Higher scores reflect greater deficits in each area. Adolescent participants were also administered the Reading the Mind in the Eyes Test (RMET) (Baron-Cohen et al. 2001). The RMET has been validated to demonstrate deficits in individuals with ASD in the ability to infer emotional state from viewing the eye region of photographed faces, which has been used in individuals as young as 12 years of age (Guastella et al. 2010). Scores are given as percentage of correct responses, so that a lower score indicates greater impairment.
NeuroImaging data collection
NeuroImaging data were acquired using a 3.0 Tesla Philips Achieva whole-body MR system (Philips Healthcare, Best, The Netherlands) with an eight-element phased-array head coil at the Advanced MRI Center, UMMS. T1-weighted anatomical MRI (MPRAGE sequence, 256×256 voxels; TR: 6.985 msec; TE: 3.15 msec; field of view [FOV]: 240 mm×256 mm×180 mm; 180 slices) were collected for diagnostic and localization purposes. 1H-MRS data were acquired using the single voxel PRESS (TE: 28 msec; TR: 2000 msec; 128 averages) to quantify brain Gln, Glu, and Glx levels and MEGA-PRESS (Mescher et al. 1998; Waddell et al. 2007) (TE: 68 msec; TR: 2000 msec; 16 averages×20 dynamic scans) to quantify brain GABA levels. Voxels (PRESS: 20 mm×20 mm×20 mm; MEGA-PRESS: 30 mm×30 mm×20 mm) were placed in the bilateral pregenual ACC by a trained spectroscopist (E.M.S.) (Fig. 1). Participants taking stimulant medication for ADHD were allowed to receive their medication on the day of the scan.
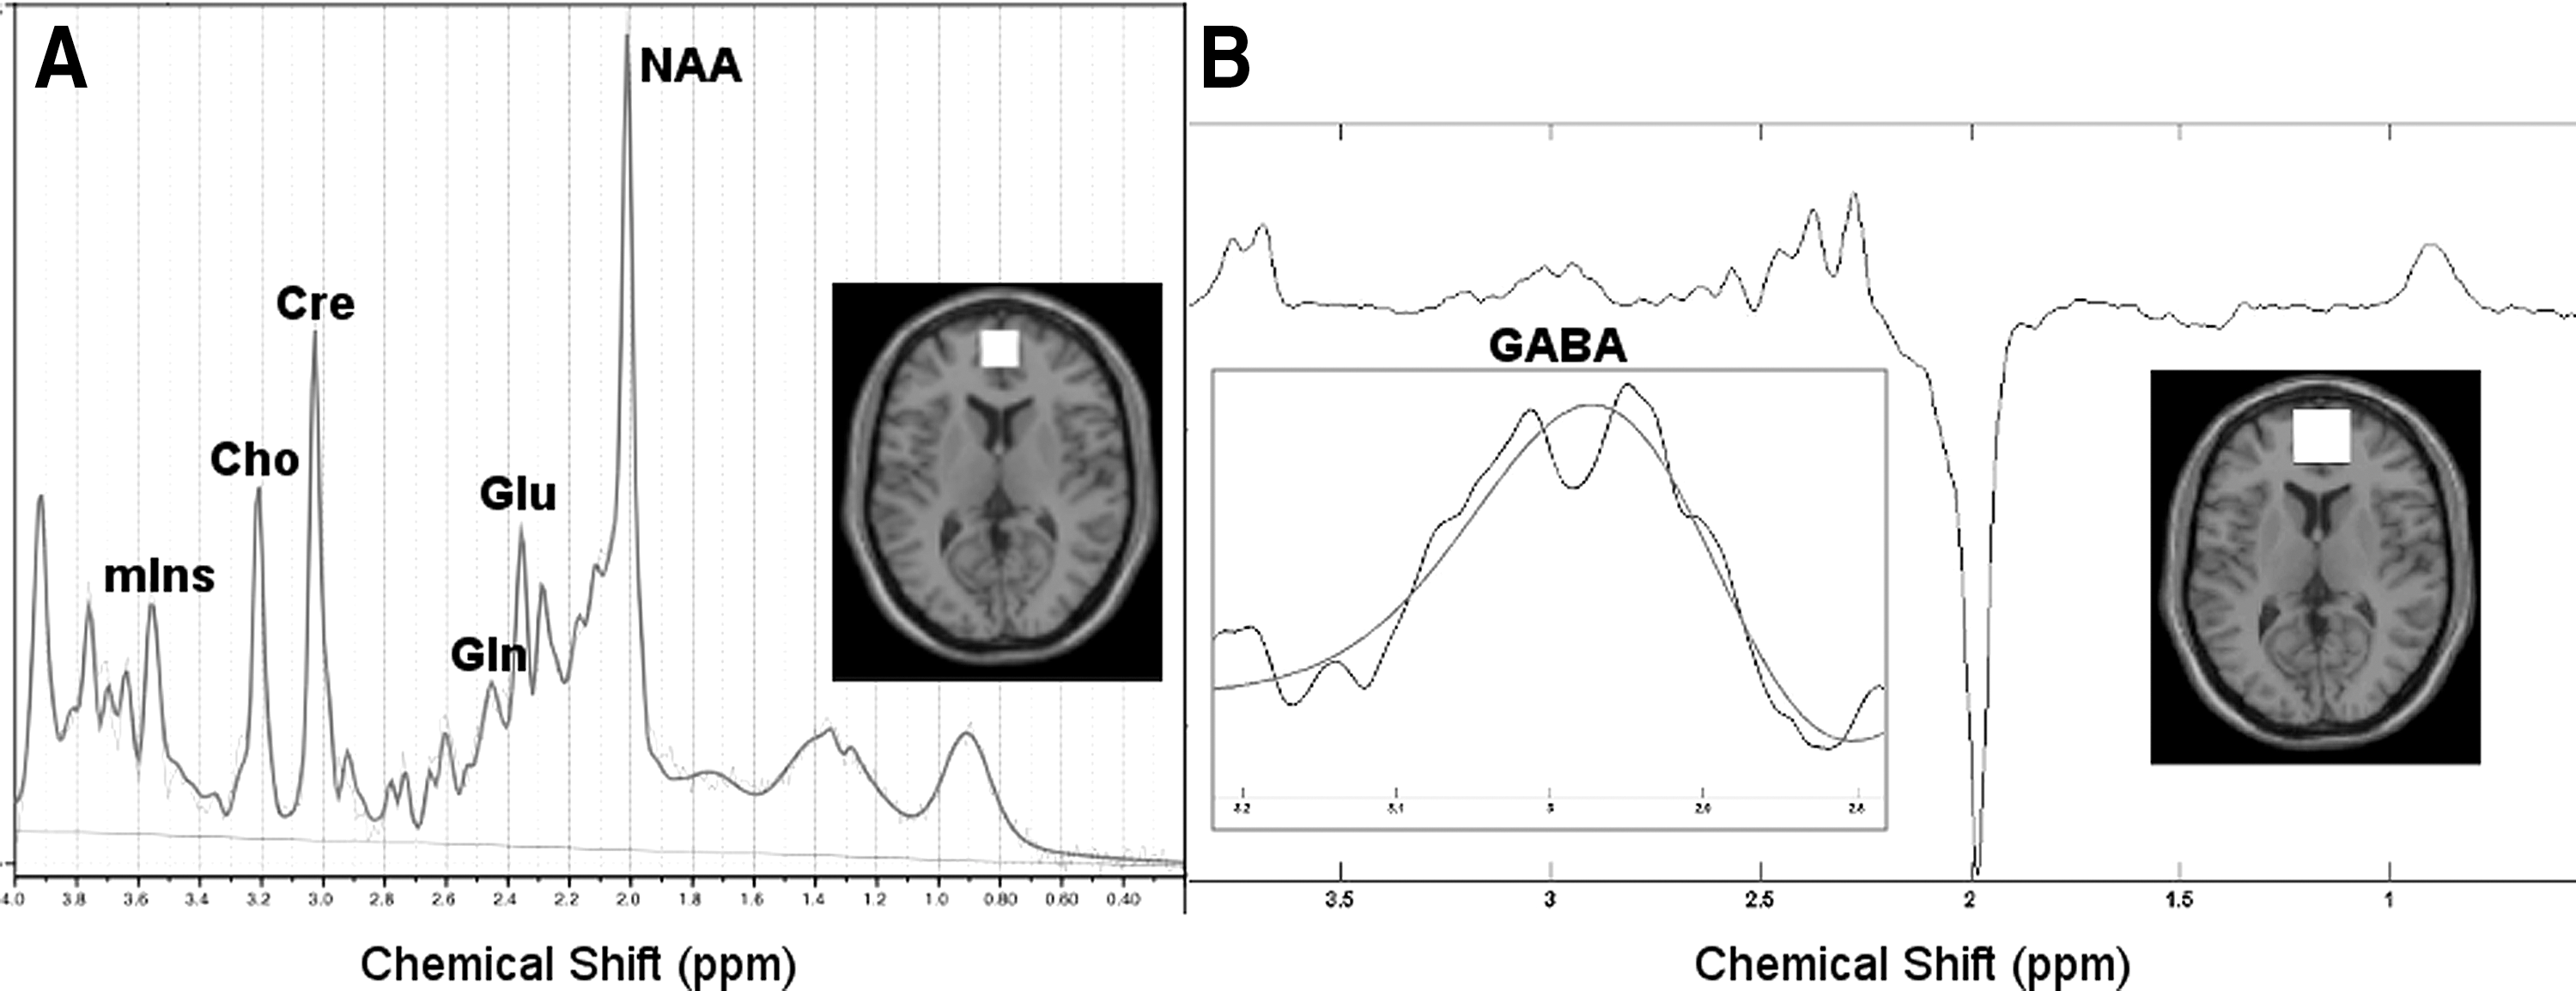
Sample proton magnetic resonance spectroscopy (1H-MRS) spectrum acquired using
Neuroimaging data analysis
A board certified UMMS neuroradiologist read the anatomic MRI scans diagnostically, and no abnormalities were identified. The spectra acquired using PRESS were fit using LCModel (Version 6.2-4E) to quantify the metabolite concentrations (Provencher 1993, 2001). LCModel analyzes in vivo proton spectra as a linear combination of model in vitro spectra from individual metabolite solutions by utilizing built-in (simulated) radial basis sets. The basis set used for this study included alanine, aspartate, creatine (Cr), phosphocreatine (PCr), GABA, glucose, Glu, Gln, glycerophosphocholine (GPC), phosphocholine (PCh), glutathione (GSH), inositol (Ins), lactate, N-acetyl aspartate (NAA), N-acetyl aspartyl glutamate (NAAG), scyllo-inositol, taurine, total creatine (tCr: Cr and PCr), total choline (tCh: GPC, and PCh), total NAA (tNAA: NAA and NAAG), and Glx (Glu and Gln) as well as the macromolecules and lipids. Cramer–Rao lower bounds (CRLB, estimated error of the metabolite quantification) of >25% for Gln and >10% for all other metabolites were classified as not reliably detected and were excluded from further analysis.
Quantification of GABA concentrations was done using in-house MATLAB (The Mathworks, MA) software for obtaining the ratios with respect to Cr levels. MEGA-PRESS enables us to detect the GABA peak of the spectra by eliminating the signal from Cr. Prior to Fourier transformation of the MRS signal, 3 Hz exponential line broadening was applied. The difference-edited GABA signal at 3 ppm and the Cr peak from unsuppressed PRESS signal were fit with Gaussian and Lorentzian models respectively (r>0.95) and the area under these model peaks was calculated to obtain GABA to tCr (GABA/Cr) ratios (Edden and Barker 2007; Dydak et al. 2011; Zhu et al. 2011; Edden et al. 2014).
In addition, structural MRI scans were analyzed using Statistical Parameter Mapping (SPM8-
Statistical analysis
Demographic and clinical characteristics of the participants were compared using parametric t tests. One participant with ASD had a CRLB for Gln>25% and was excluded from further analysis. Data for each metabolite concentration were screened for values that were beyond two standard deviations of the respective group mean. No more than one value was excluded for any metabolite. Analyses were performed using the R statistical programming language (R Core Team 2014) and the contributed packages “coin” (Hothorn et al. 2006, 2008) and “ggplot2” (Wickham 2009).
Comparisons of MRS values across groups and subsequent correlations of those values with clinical measures (without regard to group membership) were made with rank-based statistics: the Wilcoxon rank sum test with p value based on the exact distribution of the test statistic and Spearman rank-order correlations. Tabular and graphic displays of the data show parametric means and standard deviations. Nonparametric methods were used for between-group comparisons and correlations given the small sample size and non-normal distribution of data. Mean MRS values and associated standard deviations were similar to median values and median absolute deviation (MAD). The former are shown in the tables because of their familiarity. For all analyses, the threshold for statistical significance (α) was 0.05. A Bonferroni correction was applied for multiple comparisons of a priori hypothesized correlations of a subset of metabolites (Glu, Gln, GABA/Cr) with primary clinical measures of FSIQ, RMET score, and SRS Total Score. Exploratory correlations of these metabolites with subscales of the clinical measures were uncorrected.
Results
Demographics and clinical characteristics of the participants are listed in Table 1. The two groups did not differ significantly in age. Two participants were diagnosed with an anxiety disorder (one ASD, one TD), and seven were diagnosed with ADHD (six ASD, one TD). Three participants in the ASD group were currently taking stimulant medication (two methylphenidate extended release [ER], one lisdexamfetamine dimesylate), and no other participants were taking psychoactive medication. Mean estimated FSIQ was 103.1±17.0 in the ASD group, and 121.6±13.4 in the TD group (p=0.006, Wilcoxon rank sum test), a clinically significant between-group difference. The ASD group demonstrated clinically significant lower accuracy on the RMET test and higher scores on the SRS compared to the TD group. All clinical scales except Somatic Complaints and Aggressive Behaviors on the CBCL were significantly higher in the ASD group, although the mean scores for all subscales remained below the threshold for clinical significance (t≥70). Seven individuals in the ASD group had clinically significant t scores in at least one subscale of the CBCL (two Attention Problems, two Withdrawn-Depressed, one Social Problems, one Thought Problems, one Anxious-Depressed/Thought Problems/Attention Problems).
ADHD, attention-deficit hyperactivity disorder; ASD, autism spectrum disorder; CBCL, Child Behavior Checklist; FSIQ, Full-Scale Intelligence Quotient; RMET, Reading the Mind in the Eyes Test; Soc Awr, Social Awareness; Soc Cog, Social Cognition; Soc Comm, Social Communication; Soc Mot, Social Motivation; Aut Man, Autistic Mannerisms; SRS, Social Responsiveness Scale; TD, typically developing.
Table 2 lists the 1H-MRS Glu, Gln, and GABA levels in the ACC in the two groups. There was no between-group difference in Glu levels. There were significantly higher Gln levels (p=0.04), and a trend toward lower GABA/Cr levels (p=0.09) in the ASD group (Table 2) in comparison with the TD group. There were no significant differences in levels of other metabolites (NAA, Cr, myo-inositol [mIns], choline [Cho]) between groups (data not shown; p>0.05). In addition, there was no significant difference between the two groups for voxel tissue content (i.e., gray matter, white matter, and CSF; p>0.05).
ASD, autism spectrum disorder; GABA/Cr, γ-aminobutyric acid/creatine; Gln, glutamine; Glu, glutamate; TD, typically developing.
The association between Glu, Gln, and GABA levels and IQ and social cognition measures was examined (see Table 3). The main analysis focused on the FSIQ, RMET score, and total SRS score. Correcting for multiple comparisons (p=0.0055 corresponds to α=0.05), there were significant negative correlations between Gln level and IQ (rho = −0.56, p=0.003, Fig. 2A) and between Gln level and RMET score (rho = −0.62, p=0.001, Fig. 2B). There was a trend toward significance (rho=0.53, p=0.007, Fig. 2C) for a positive correlation between Gln levels and SRS total score. There was a nonsignificant positive correlation between GABA/Cr levels and IQ (rho=0.36, p=0.07, Fig. 2D) and between GABA/Cr levels and RMET score (rho=0.42, p=0.034, Fig. 2E) and a nonsignificant negative correlation between GABA/Cr levels and SRS total score (rho = −0.34, p=0.09, Fig. 2F). There were no significant correlations or trends for Glu levels and clinical characteristics. Follow-up analyses were performed with Gln/Glu ratios, with similar but less significant group differences and correlations compared with analysis of Gln alone (data not shown).
Uncorrected p values in parentheses.
Trend to significance at p<0.1 level, uncorrected for multiple comparisons.
Significant at p<0.05 level, uncorrected for multiple comparisons.
Significant at α <0.05 level, after Bonferroni correction for nine comparisons.
CBCL, Child Behavior Checklist; FSIQ, Full-Scale Intelligence Quotient; GABA/Cr, γ-aminobutyric acid/creatine; Gln, glutamine; Glu, glutamate; RMET, Reading the Mind in the Eyes Test; RMET, Reading the Mind in the Eyes Test; Soc Awr, Social Awareness; Soc Cog, Social Cognition; Soc Comm, Social Communication; Soc Mot, Social Motivation; Aut Man, Autistic Mannerisms;SRS, Social Responsiveness Scale.
In exploratory subanalyses (Table 3), the most significant correlations for the various SRS subscales were for the Social Communication scale with Gln and the Social Cognition scale with Gln and GABA/Cre (rho=0.58, p=0.002; rho=0.53, p=0.006; and rho = −0.42, p=0.03, respectively). For the CBCL subscale scores, there were positive correlations between Gln levels and scores in Social Problems (rho=0.55, p=0.005), Attention Problems (rho=0.55, p=0.005), Rule-Breaking Behavior (rho=0.50, p=0.01), Anxiety/Depression (rho=0.41, p=0.04), and Thought Problems (rho=0.42, p=0.04). There were trends toward negative correlations between GABA/Cr levels and Rule-Breaking Behavior (rho = −0.37, p=0.06), Thought Problems (rho=−0.34, p=0.09), and Attention Problems (rho=−0.34, p=0.09). Given the exploratory nature of these subanalyses, attempts were not made to correct p values for multiple comparisons.
Discussion
Adolescents with ASD had higher Gln levels in the pregenual ACC and a trend toward lower GABA/Cr levels than the TD control group. However, there was no difference in Glu levels between the two groups. Lower IQ and greater impairment in social cognition (lower RMET score, higher SRS score) were associated with higher Gln levels and lower GABA/Cre levels across groups (see Fig. 2).
Our findings support the growing literature indicating an imbalance in excitatory (glutamatergic) and inhibitory (GABA-ergic) neurotransmission in ASD. This is the first report to our knowledge suggesting that the increased glutamatergic activity may be best characterized spectroscopically by an increase in Gln levels rather than by Glu. Gln is involved in the Glu-Gln cycle, in which Glu released by neurons is taken up by astrocytes and then converted into Gln and stored. Gln is eventually returned to neurons where it is hydrolyzed to Glu (Bak et al. 2006; Schousboe and Waagepetersen 2006). Thus, Gln exists as an intracellular buffer to prevent the buildup of excessive glutamate. This, in addition to the large metabolic pool contributing to Glu levels, may contribute to Gln being a more sensitive marker of glutamatergic activity (Mlynarik et al. 2008; Pereira et al. 2008; Iltis et al. 2009). Elevated Gln may suggest an abnormality in glial cell number or function in ASD. Increased glial cell numbers and upregulation of glial cell gene expression have been demonstrated in postmortem brain tissue from individuals with ASD (Edmonson et al. 2014). 1H-MRS studies in mood disorders have implicated the Gln/Glu ratio as a more accurate and sensitive marker of glutamatergic neurotransmission (Yuksel and Ongur 2010). However, in the current study, an analysis of Gln/Glu ratios yielded similar but less significant results than the analysis of Gln alone, likely because of a very high correlation between Gln/Glu and Gln (r=0.96, p<0.0001; data not shown).
Previous 1H-MRS studies in ASD are equivocal in the direction of abnormality of glutamatergic compounds, particularly when measuring combined Glx compounds (Page et al. 2006; DeVito et al. 2007; Bernardi et al. 2011; Bejjani et al. 2012; Brown et al. 2013; Horder et al. 2013; Joshi et al. 2013). Differences may be associated with regional differences or age-related changes in Glx; however, the current study suggests that differences may also reflect a lack of sensitivity for combined Glx to adequately reflect glutamatergic neurotransmission, which may be better characterized by Gln levels. Joshi and colleagues (Joshi et al. 2013) reported increased Glu in the ACC in adolescents with ASD (similar age range to that in our study). However, limitations of the previous study include a smaller sample size (approximately half the size of our sample) and greater psychiatric comorbidity, including anxiety disorder, ADHD, mood disorder, or a combination. Also, 57% of the ASD group were taking antidepressant and/or antipsychotic medications, which are known to affect glutamatergic activity (Golembiowska and Dziubina 2000; Tarazi et al. 2003; Musazzi et al. 2010; Goto et al. 2012).
Only three previous studies have examined GABA levels in ASD using 1H-MRS, and our findings support the previous results of decreased GABA levels in the frontal lobe (Harada et al. 2011), auditory (Gaetz et al. 2014; Rojas et al. 2014), and motor (Gaetz et al. 2014) cortices. Decreased cortical GABA levels appear to be the most consistent and reproducible 1H-MRS finding in ASD.
Our study is the first to investigate concurrent Glu, Gln, and GABA levels in a cortical region known to be associated with social cognitive deficits in ASD, and to correlate these levels with social cognition and IQ. Those individuals with lower IQ and greater social cognitive deficits tended to have higher Gln levels and lower GABA/Cr levels in the ACC. Exploratory analyses indicated that the correlation was most significant for SRS subscales measuring social cognition (Gln and GABA/Cr) and social communication (Gln). Therefore, these 1H-MRS measures may provide a neuroimaging biomarker for social cognition deficits in ASD.
There are several limitations to the current study. First, there were clinical differences between the two groups aside from the ASD characteristics (Table 1). Most problematic was the difference in IQ between the groups, a confounding limitation of this study. The significant group difference in IQ and the relatively small sample size precludes the ability to separate out the effect size of IQ and social cognition on the 1H-MRS measures, as it would be inappropriate to include IQ as a covariate (see Miller and Chapman [2001] for a review of this misapplication of analysis of covariance). However, there is no prior literature suggesting a relationship between Gln and/or GABA levels and intelligence. Future studies are needed with a larger sample size in which groups are matched for IQ to determine whether the association between social cognition and 1H-MRS measures remains significant.
Another difference between the groups was the comorbidity of ADHD. Almost half the ASD group had diagnoses of ADHD, but only three were taking stimulant medication on the day of the imaging acquisition. By contrast, in the TD group, one had a diagnosis of ADHD and none were taking medication. Prior studies have demonstrated decreased Glx (Perlov et al. 2007) and increased Glu (Hammerness et al. 2012) in the ACC of individuals with ADHD, with evidence that treatment with stimulants normalizes the difference in Glu (Hammerness et al. 2012). Therefore, our ability to discern differences in Glu may have been hampered by the impact of the stimulant medications in the small subgroup. No ADHD studies have examined Gln or GABA in the ACC, although decreased GABA levels have been reported in somatosensory and motor cortices (Edden et al. 2012). The current study did not have sufficient sample size to statistically control for differences in medication or diagnosis between groups.
Despite excluding anyone with a psychiatric diagnosis other than ADHD or mild anxiety disorder, all of the clinical subscales on the CBCL were significantly higher in the ASD group. Seven individuals in the ASD group had at least one CBCL subscale score in the clinically significant range, although these score elevations could be attributed to ASD (Social Problems, Thought Problems, Withdrawn-Depressed), ADHD (Attention Problems), or Anxiety Disorder (Anxious-Depressed). For example, two individuals were clinically elevated on the Withdrawn-Depressed subscale, but did not meet diagnostic criteria for a depressive disorder. Correlations of 1H-MRS parameters with CBCL subscale scores were much less significant than the correlations with social cognition measures, with the exception of a strong positive correlation between Gln and CBCL-Attention Problems (rho=0.55, p=0.005).
Another limitation in this study is the inherent variance associated with Gln measurements. For all reported peaks other than Gln, we included only the findings where CRLB was<10%. For Gln, we included data when CRLB was<25%; two thirds of the CRLB values were between 15% and 25%. Therefore, the values for Gln are not as precise as those of other 1H-MRS parameters. However, the novel findings of differences in Gln associated with ASD and its correlation with social cognition deficits provide further impetus for the refinement of 1H-MRS analysis techniques to better characterize Gln as a separate metabolite in future studies.
Conclusions and Clinical Significance
This study further highlights the potential importance of an imbalance in glutamatergic and GABA-ergic neurotransmission driving the social cognition deficits in ASD. The novel finding of a correlation of 1H-MRS parameters with social cognition suggests that 1H-MRS can be used to develop neuroimaging biomarkers of ASD as a measure of severity of the social deficits, although larger studies are needed that control for IQ, psychiatric diagnosis (particularly ADHD), and medication effects.
Our findings have interesting treatment implications for individuals with ASD. If further research supports the connection between excitatory-inhibitory imbalance and social cognitive deficits in ASD, then further development of medications that target glutamatergic and GABA-ergic function may provide treatments that impact the core social deficits of ASD. Likewise, repetitive transcranial magnetic stimulation (rTMS) has been postulated to address excitatory-inhibitory imbalance. A promising randomized controlled trial of rTMS in the bilateral dorsomedial prefrontal cortex in adults with ASD demonstrated a reduction in social-relating impairment and socially related anxiety (Enticott et al. 2014). Importantly, treatment studies thus far have demonstrated response in only a subset of patients, and 1H-MRS may provide a noninvasive method of investigating differences in treatment responders and nonresponders, thus providing information that may allow for the prediction of individualized treatment response.
The integration of 1H-MRS methods into future clinical studies should be an ongoing area of research development, as the potential for medical interventions targeting the core social communication deficits in ASD could revolutionize management of these chronic, debilitating disorders.
Footnotes
Disclosures
Dr. Frazier has received research grant support from Glaxo Smith Kline, Pfizer, Inc., Neuren, Roche, and Seaside Therapeutics. She currently serves on a data safety monitoring committee for a clinical trial through Forest Pharmaceuticals. The manuscript and data analysis were completed solely by the authors.