
Abstract
Background:
Childhood depression is often chronic and recurrent, with only modest improvements after optimal treatments. Novel approaches are needed for accurate diagnosis, timely selection of the best treatment for childhood depression, and improvement of remission rates. An important part of diagnosis is to determine how many consistent dimensions underlie childhood depression and what impact treatment may have on these dimensions.
Objective:
The goal of the current study is evaluate the consistency of the number of depressive symptom dimensions and examine the effect of depression treatment on the change in dimensions by seeing if this dimensional structure is the same for groups that were given a placebo and groups that were given an active drug, fluoxetine.
Methods:
We examined a combined sample of three clinical trials data sets with a total of 269 placebo patients and 261 fluoxetine patients at baseline, and 253 placebo patients and 249 fluoxetine patients at exit. Principal components analysis with associated parallel analysis followed by a ProMax oblique rotation was conducted on each week's scores. The similarity of the rotated structures between treatments and between weeks was then assessed using Wrigley and Neuhaus' (1955) degree of factorial similarity measure, which is a correlation-like statistic that takes two solutions based upon the same measures and assesses how similar they are.
Results:
Preliminary analysis indicated that mean scores of both treatment groups declined from baseline to exit, but the decline was greater for the fluoxetine group. There were four dimensions at baseline and two dimensions at exit in each treatment group. Hence the numbers of dimensions were the same in the two groups, whereas the content of the components was the same at baseline for the two groups, but was different at exit. Basically, the factorial similarities of the rotated factors were very high at baseline between the two groups for both factors (Ψ = 0.97 for factor I and 0.94 for factor II) before they were treated differently. However, at exit, the respective similarities dropped to 0.58 and −0.04 for factors I and II. Therefore, time had a large effect in changing both groups' factor structure, but it was especially large when there was an active treatment.
Conclusions:
In comparing the baseline and exit dimensions in a forced two factor solution of two treatment groups, it was revealed that treatment did have an impact on the change in dimensions. These results further the generality of the simplification of the factor structure of the Childhood Depression Rating Scale- Revised (CDRS-R) over time. In addition, these results show the effect of time and therapy on the factor structures. The fluoxetine group followed the trend of the content of the dimensions revealed in a previous study, whereas the placebo group had a less distinct change over time.
Introduction
C
Novel approaches are needed for accurate diagnosis and timely selection of the best treatment for childhood depression, which are critical to improving remission rates of depression. It is clearly evident that depression populations are a heterogeneous group; as such, an important part of diagnosis is to determine how many dimensions underlie childhood depression. One technique to infer dimensionality is with principal component analysis (PCA), a form of exploratory factor analysis. PCA is concerned with combining measures sequentially to account for the most variance at each step. Therefore, the first principal component accounts for the most variance in the individual measures; the second principal component accounts for the most leftover variance, and exploratory factor analysis is advantageous in examining the heterogeneity of disease syndromes and discovering structure in the absence of preexisting hypotheses about subtypes. The model identifies interrelationships among observed variables by grouping the variables examined into smaller sets (data reduction). The subsets with common characteristics form factors, subscales, or dimensions (Lubke and Muthen 2005).
Prior studies provide inconsistent evidence about the number of dimensions in existence for childhood depression. In particular, the number of dimensions reported in childhood depression studies using the Childhood Depression Rating Scale- Revised (CDRS-R) varies from two to five (Guo et al. 2006; Jain et al. 2007; Bernstein et al. 2010). Only one dimension, the observed depression/signs (depressed facial affect, listless speech, and hypoactivity) is consistent across these studies. Some reasons for the differences in dimensions across studies include population differences (depressed versus nondepressed), the use of a single session/cross-sectional data for analyses, and theoretical modeling choices (common factor analyses vs. PCA), and the criteria for defining the number of factors.
The CDRS-R is frequently used in child depression clinical trials for measuring depression severity and symptom improvement over the course of treatment. The first 14 items are rated based on reported symptoms from the child's, parent's, and clinician's assessment, whereas the last 3 items are the clinician's assessment of the child's nonverbal behavior during the interview (Poznanski and Mokros 1996, 2005).
In a recent study (Isa et al. 2014), we examined the CDRS-R's dimensionality in 234 depressed children who were prescribed fluoxetine over a 12 week period. A pattern of progressive reduction in the number of dimensions from five at baseline to two at week 3 was observed. The two dimension solution remained consistent thereafter until the end of the study. The dimensions revealed included observed depression/signs dimension (depressed facial affect, listless speech, hypoactivity), in addition to a reported depression/symptoms dimension (sleep problems, appetite disturbance, physical complaints, irritability, excessive guilt. and weeping). The results implied that the change in observed signs varied somewhat independently from changes in reported symptoms. The reduction in the number of factors was a result of the increased item intercorrelation with successive sessions. In other words, subjects began to perceive individual symptoms as connected to each other and their overall depression.
It is yet unclear whether these dimensions observed are constant or if they vary as a result of extraneous factors, raising further inquiry. Did depression treatment decrease specific symptoms and not others, resulting in fewer dimensions? Or was the reduction in the number of dimensions the result of a change in the patient's perception? In general, what are the effects of repeated testing in subjects? Understanding these perspectives will contribute to our understanding of childhood depression and, invariably, to the development of effective treatments for depression.
The first goal of the current study is to compare the effect of depression treatment in two groups, one of which was administered an active treatment and the other of which was administered a placebo. The two groups were evaluated at baseline and at exit in RCTs designed to evaluate the difference. If a consistent two-dimension solution was discovered at exit in this sample, as was found in a prior study using a different sample (Isa et al. 2014), a second goal would be to compare a two factor solution at baseline with this exit solution, thereby providing a means of evaluating a consistent continuum across time. The factor pattern of both groups could then be evaluated for the similarities to previously obtained patterns.
Methods
We merged and examined three previously studied clinical trial data sets of depressed youth. The rationale, design, methods, and sample characteristics have been described in prior reports (Emslie et al. 1997; 2002; March et al. 2004, 2006; Mayes et al. 2007). A brief summary of these studies is as follows. In the first two studies (n = 309. ages 7–18) subjects were randomized into the two arms (placebo-152 and fluoxetine-157 groups) (Emslie et al. 1997, 2002; Mayes et al. 2007). In the third study, subjects (n = 439, ages 12–17) were randomized into four arms; placebo (n = 112), fluoxetine only (n = 109), cognitive behavior therapy (CBT) (n = 111) and combined fluoxetine and CBT (n = 107) (Treatment for Adolescents With Depression Study Team 2003; March et al. 2004, 2006). Only the fluoxetine (n = 109) and placebo (n = 112) arms were extracted from this sample and merged with the first data set, creating a larger homogenous data set.
Measures
Across both trials, youth were randomized into a fluoxetine and placebo group. A clinician assessed the severity of their depression symptomatology at baseline and throughout treatment using the CDRS-R. The last visit attended was defined as “exit.”
The CDRS-R is a 17 item semistructured clinician-rated scale that incorporates depressive symptoms described by the patient, caregiver, and clinician for the first 14 items. The last three items are inferred from the clinician alone. The items for sleep, appetite, and tempo of speech are rated 1–5, but all others are rated from 1 to 7 with higher scores indicating increased pathology (Poznanski and Mokros 1996, 2005). Individual items on the CDRS-R are summed to create a total score (range 17–113). A score ≥40 corresponds to moderate to severe depression, and is often defined as eligibility for entry into studies.
Statistical Analysis
SAS version 9.3 was used for all analyses.
There are three main sections to the data analysis. The first compares the various groups' mean scores to see if differences exist between combined placebo and fluoxetine groups at baseline, at exit, and in terms of the difference between baseline and exit. This section is included to see if the drug treatment did produce a difference in CDRS-R scores relative to those of the placebo group.
The second part of the analysis addresses the successive eigenvalues (scree) at baseline and at exit for the two treatment groups. As in the second author's (Bernstein) recent work using principal component analysis, parallel analysis (Horn 1965; Humphreys and Ilgen 1969; Humphreys and Montanelli 1975; Montanelli and Humphreys, 1976) was employed to infer the number of factors. For each of the four conditions (baseline vs. exit and placebo vs. fluoxetine), matrices of random normal deviates were generated consisting of 17 columns and rows corresponding to the condition in question. This was repeated 50 times and the screes averaged to produce four composite screes. The real data were then compared with the random data and the number of components whose real eigenvalues exceeded the random eigenvalue defined the dimensionality. These principal components were then rotated obliquely to a ProMax criterion. When rotated, the variance of each factor was made as equal as possible; that is, factors I and II accounted for approximately the same amount of variance. In addition, the factors were allowed to correlate, unlike the original components.
The third section of the article addresses the similarities of the resulting rotated component patterns both between groups and between time periods. This was accomplished using Wrigley and Neuhaus' (1954) degree of factorial similarity measure (Ψ). The similarity between two sets of pattern weights defined on the same set of variables but for either different groups or time periods was defined as the sum of the cross products of the respective pattern weights divided by the square root of the product of the sums of squares of those weights. It is a correlation-like measure (but not a true correlation) in that it ranges between −1 and +1 with the same interpretation as a correlation.
Because our prior results indicated that only the first two factors tended to remain consistently, attention was focused on these at both baseline and exit. Hence, we forced the baseline solutions to two factors to match the exit solutions in dimensionality.
Results
Sample characteristics and outcomes
A total of 530 youth was included in these analyses. There were 269 placebo and 261 fluoxetine patients at baseline and 253 placebo and 249 fluoxetine patients at the end of the study. Their average ages were 12.5–12.6 years in each group. They were divided nearly equally by gender (46.2% female in the placebo group and 47.0% female in the fluoxetine group) and largely Caucasian (76.5% in the placebo group and 80.8% in the fluoxetine group). The average baseline CDRS-R score reflected moderate to severe depression. The studies were 8–12 weeks in length. Table 1 describes the demographic and clinical variables.
Table 2 contains the means and standard deviations of the scale scores for the placebo and fluoxetine groups at baseline and exit, and the difference between them (change scores). The respective means at baseline were 58.1 and 58.2. At exit, these scores were 42.0 and 36.4; therefore, the mean decreases were 16.1 and 21.8 respectively. The difference between the two treatment groups was not significant at baseline, t(528) = 1.25, but was significant at exit, t(500) = 4.50, and the difference scores also differed significantly, t(500) = 4.25, both ps < 0.0001. Moreover, the difference scores were significant for both groups t(248) = 16.89 and t(254) = 23.03, both ps < 0.0001. Therefore, scores declined in both groups from baseline to exit, but more so for the fluoxetine group. In terms of Cohen's d, the change scores were both large (1.07 and 1.44), especially for those patients given the active drug. Table 3 contains the mean score of individual items on the CDRS-R at baseline and exit, and the difference in mean scores at the two time points for both groups.
CDRS-R, Childhood Depression Rating Scale- Revised.
CDRS, Childhood Depression Rating Scale.
Dimensions
Using the parallel analysis criterion as defined, there were four dimensions at baseline and two dimensions at exit for both groups. Figure 1 contains the scree plots for the four conditions. As can be seen, there is a major difference within baseline and exit for both the placebo and fluoxetine groups, and relatively little difference between the two baselines and between the two exits. The placebo and fluoxetine scree plots were highly similar at both measurement points. However, because of the stability of two factor solutions over time (Isa et al. 2014), discussion will be limited to two factors at both baseline and exit (as mentioned). The relevant factor patterns are presented in Table 4.
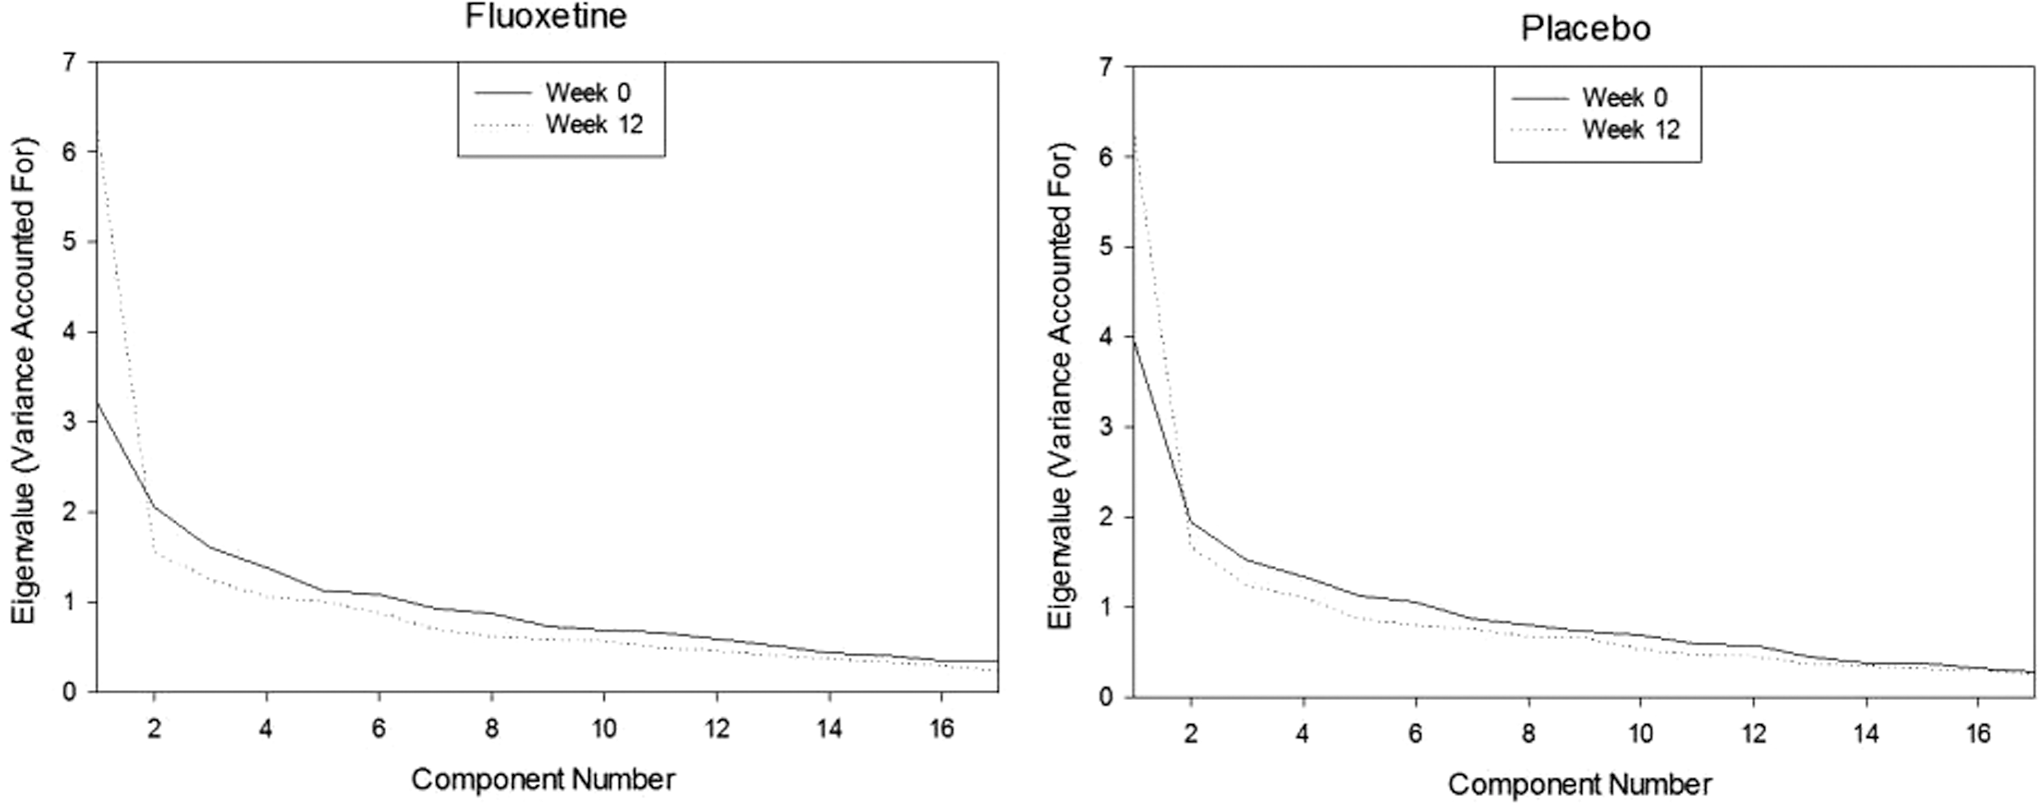
Component magnitudes as a function of component number (scree plots) for the fluoxetine and placebo groups at Week 0 (baseline) and Week 12 (exit).
CDRS, Childhood Depression Rating Scale.
Baseline results
Placebo group
At baseline, the items for the placebo group in factor I included anhedonia (difficulty having fun), social withdrawal, depressed mood, depressed (facial) affect, hypoactivity. and listless speech, whereas in factor II, the relevant items were impaired schoolwork, sleep and appetite disturbance, fatigue, physical complaints, guilt, irritability, low self-esteem, morbid and suicidal ideation, and weeping.
Fluoxetine group
The fluoxetine group had almost the identical pattern except that impaired schoolwork had a weaker loading on both factors and self-esteem, which loaded on factor I instead of II.
Exit results
Placebo group
At exit, the items in the placebo group that loaded on factor I were impaired schoolwork, anhedonia, social withdrawal, sleep disturbance, fatigue, depressed affect, hypoactivity, and listless speech, whereas factor II comprised appetite disturbance, physical complaints, guilt, morbid and suicidal ideations, and weeping. Irritability, low self-esteem, and depressed mood cross-loaded onto the two factors.
The results of individual item mean scores at exit in the placebo group also demonstrated that for symptoms reported by patients, (items 1–14) the mean scores of the items loading on factor I (range 2.77–3.48), although improved, were higher than those of factor II (1.44–2.34).
Fluoxetine group
In the fluoxetine group, all depression items loaded on factor I except for morbid ideation, depressed affect, hypoactivity, and listless speech, which loaded on factor II.
In the fluoxetine group, almost all reported symptoms had lower mean scores than the placebo group (range 1.43–2.96). The observed depression items (item 15–17) loaded on factor I, whereas all other items loaded on factor II except for morbid ideation, which cross-loaded on factors I and II. These three observed depression items consistently loaded together on the same factor.
Baseline versus exit factor comparisons between groups
Factor I in the placebo group is nearly identical to factor I in the fluoxetine group at baseline (0.97) in terms of the Wrigley and Neuhaus similarity measure (see black bar on the left of Fig. 2), which is a between-groups comparison. The same is true of the corresponding factor II similarity (0.94) (see gray bar at left of Fig. 2). Both results are to be expected, because the groups differed but randomly at this point.
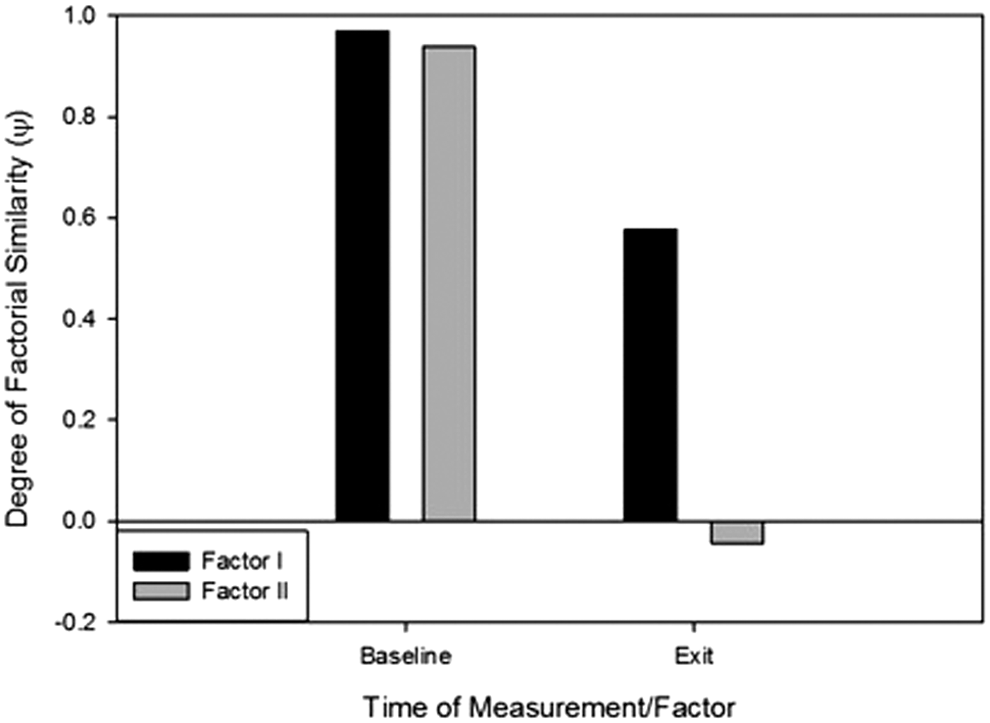
Degree of factorial similarity (y) between fluoxetine and placebo groups for factor I and factor II at Week 0 (baseline) and Week 12 (exit).
However, factor I was moderately dissimilar (0.58), and factor II was totally dissimilar (0.04) at exit (see right sides of Fig. 2).
Baseline versus exit factor comparisons within groups
A within-groups comparison is an alternative way of looking at these data. The black bar on left side of Figure 3 compares the similarity of factor I between baseline and exit, and the gray bar on the left compares the similarity of factor II between baseline and exit for the placebo group. As can be seen, both are very similar to one another. The similarities of factor I at baseline and exit (black bar) and the similarities of factor II at baseline and exit (gray bar) in the placebo group are nearly equal to one another (0.89 and 0.87, respectively). However, the corresponding similarities in the fluoxetine group are quite different (0.44 and −0.05, respectively). Lack of similarity in this case simply reflects the effects of time. In contrast, the right side depicts the corresponding results for the fluoxetine group. Factor I changes at least moderately and factor II changes substantially. This reflects the joint effects of time and treatment. Therefore, time and treatment each have a major effect on the factor structure. There is, therefore, more to the effect of time and therapy on CDRS scores than simple changes in their magnitude.
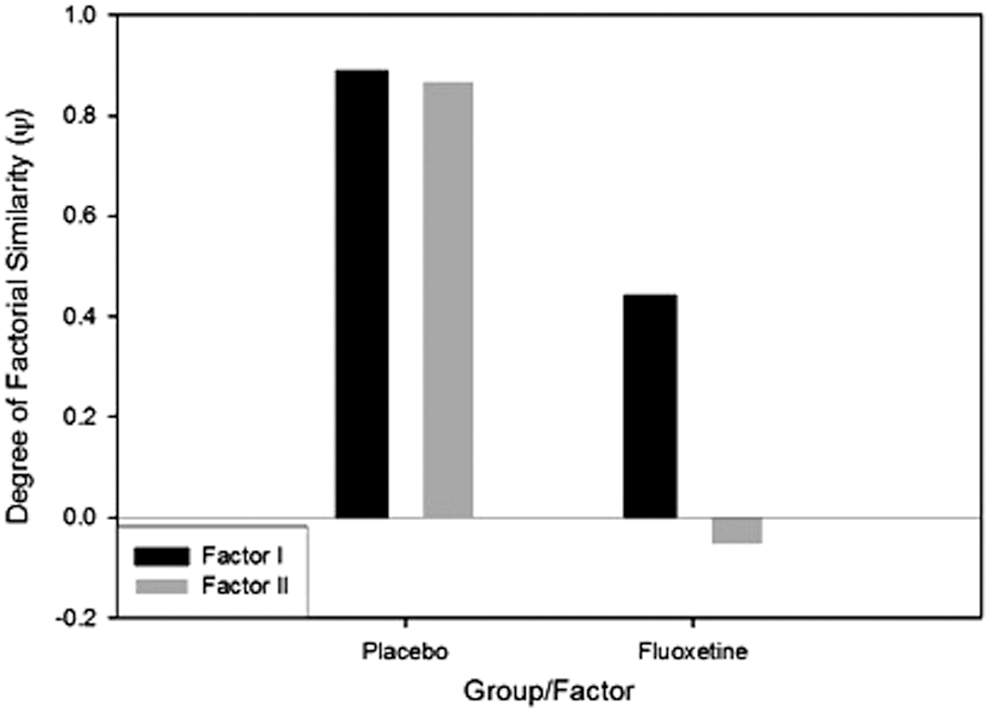
Degree of factorial similarity (y) between Week 0 (baseline) and Week 12 (exit) for factor I and factor II for the placebo and fluoxetine groups.
Discussion
Both groups improved over time, but the change was especially large for the fluoxetine group. More crucially, we have replicated the decrease in number of dimensions over time. The placebo and fluoxetine functions (as far as number of dimensions) are far more similar than they are different at each measurement point, but the groups differ significantly in the item loading and factor pattern.
In our previous article, we noted that there were at least two mechanisms by which the factor structure could be simplified over time. One was that patients were becoming more knowledgeable about their depression. An alternative was that subjects adopted a “halo” by responding to the overall characteristic of the symptoms and signs and therefore failed to differentiate among them. Clinicians would then echo this change in patient perceptions. The difference between these two explanations is that the former attributes the simplification of the factor structure to increased knowledge as a result of the effects of time; the latter attributes it to a decreased effort in providing information to the interviewer (or in responding in self-report inventories). In the present case, a third mechanism is being tested, the therapeutic effects of fluoxetine, which we know exist from the difference in change scores between the two groups. The present data do not speak to differentiating alternative 1 from alternative 2, but the treatment effect of fluoxetine speaks to alternative 3.
Clearly, the number of factors decreased over time from four to two, replicating our previous findings (Isa et al. 2014). There is a distinct difference between the fluoxetine and placebo groups when we look closely at the factor patterns and item loadings. The fluoxetine group replicated the findings at exit in our previous article. The results of this group once again showed that observed signs (depressed affect, hypoactivity, and listless speech) varied independently from reported symptoms (Isa et al. 2014). Moreover, this group changed in a more coherent manner over time compared with the placebo group, whose changes were not this orderly. In the placebo group, observed signs and reported symptoms intermingled, providing no clear demarcation between them. These results may be the result of treatment response versus nonresponse, or may be peculiar to fluoxetine, the active treatment used in both studies.
We looked at mechanisms that might be responsible for the change over time and the treatment effect at exit. One important point emerged of a purely statistical nature: Items that had a large mean at baseline; that is, which were rated as most severe, showed the largest difference between groups at exit. Specifically, the correlation between the two sets of mean scores measured was 0.83. For example, item 2 (anhedonia) had the highest mean at baseline and the fifth largest difference at exit. In contrast, item 13 (suicidal ideation) had the lowest mean at baseline and the second lowest mean change score.
Items 2 and 13, therefore, differentially loaded on the two factors. This suggests that the underlying reason for the difference between factors may be the subject/clinician's perception of symptoms that improve versus those that do not improve.
Limitations
Three separate studies/databases were merged for the analyses performed. Perhaps the most important limitation is that the first group's exit was at 8 weeks whereas the second group's exit was at 12 weeks. However, both were alike in that the patients knew they were exiting the study at this point. The first data set used last observation carried forward in the data analysis whereas the second group did not use this procedure. The clinician evaluations differed for each of these studies. All evaluators had previously been trained in use of the CDRS and were at least at the master's level. The Treatment for Adolescents with Depression Study (TADS) employed multiple sites, and the evaluators were independent of the treating clinicians. These treating clinicians were also provided training prior to the onset of the study. These clinicians were child psychiatrists, psychologists, and masters level counselors. The Lilly studies were at a single site, used the treating clinicians as the evaluators; therefore, they had more access to the patients than those in the TADS study. All studies were randomized and double blinded. The likelihood that the clinicians and subjects predicted the correct treatment was by chance. Some of the data from the Lilly study were presented in the study by Hughes et al. (2000), who evaluated the degree of blindness as seen by clinicians, parents, and subjects. They found that all three groups were unable to guess whether they were in the placebo or fluoxetine group when asked directly. However, they were above chance when the clinical response and condition assignment were controlled; that is, patients who improved were seen as being in the fluoxetine group and patients who failed to improve were seen as being in the placebo group.
Conclusion
One hopes that the present results in toto contribute to our knowledge of the effects of repetitive measurement of depression. Furthermore, we hope that we have helped dissociate changes over time from therapeutic change. We also found a two dimensional solution at exit in this study in the fluoxetine group, replicating the dimensions and factor pattern seen in Isa et al. (2014).
Clinical Significance
Even though patients may improve over time and with a therapeutic agent, the nature of the change is not necessarily caused by the same mechanism.
Footnotes
Disclosures
Madhukar H. Trivedi is or has been an advisor/consultant to: Abbott Laboratories, Inc., Abdi Ibrahim, Akzo (Organon Pharmaceuticals Inc.), Alkermes, AstraZeneca, Axon Advisors, Bristol-Myers Squibb Company, Cephalon, Inc., Cerecor, Concert Pharmaceuticals, Inc., Eli Lilly & Company, Evotec, Fabre Kramer Pharmaceuticals, Inc., Forest Pharmaceuticals, GlaxoSmithKline, Janssen Global Services, LLC, Janssen Pharmaceutica Products, LP, Johnson & Johnson PRD, Libby, Lundbeck, Meade Johnson, MedAvante, Medtronic, Merck, Mitsubishi Tanabe Pharma Development America, Inc., Naurex, Neuronetics, Otsuka Pharmaceuticals, Pamlab, Parke-Davis Pharmaceuticals, Inc., Pfizer Inc., PgxHealth, Phoenix Marketing Solutions, Rexahn Pharmaceuticals, Ridge Diagnostics, Roche Products Ltd., Sepracor, SHIRE Development, Sierra, SK Life and Science, Sunovion, Takeda, Tal Medical/Puretech Venture, Targacept, Transcept, VantagePoint, Vivus, and Wyeth-Ayerst Laboratories. In addition, he has received research support from: Agency for Healthcare Research and Quality (AHRQ), Corcept Therapeutics, Inc., Cyberonics, Inc., National Alliance for Research in Schizophrenia and Depression, National Institute of Mental Health, National Institute on Drug Abuse, Novartis, Pharmacia & Upjohn, Predix Pharmaceuticals (Epix), and Solvay Pharmaceuticals, Inc. Graham Emslie has received research support from Biobehavioral Diagnostics Inc., Bristol-Myers Squibb, Eli Lilly, Forest Laboratories, GlaxoSmithKline (formerly SmithKline Beecham), Novartis, Organon, Repligen, Shire Pharmaceuticals, Somerset, and Wyeth Pharmaceuticals; has served as a consultant for Biobehavioral Diagnostics Inc., Eli Lilly, Forest Laboratories, GlaxoSmithKline, Pfizer, Shire Pharmaceuticals, Validus Pharmaceuticals, and Wyeth Pharmaceuticals; and has been on the speakers bureau for Forest Laboratories and McNeil. Ira Bernstein owns stock in Bristol Myers Squibb and Merck, has received a grant from the National Council of Licensure Examination for Registered Nurses (NCLEX-RN)/National Council Licensure Examination for Practical Nurses (NCLEX-PN), is a member of the NCLEX-PN Board of Advisors with regard to their test construction, and receives textbook royalties from Sage publications. Ameena Isa, Betsy Kennard, and Taryn Mayes have no financial relationships to disclose. Eli Lilly provided the medication for the Emslie study, but had no role in the study design or implementation, analysis of data, or authorship of this manuscript.