
Abstract
Objective:
The measurement of aggression in its different forms (e.g., physical and verbal) and functions (e.g., impulsive and instrumental) is given little attention in subjects with developmental disabilities (DD). In this study, we confirm the factor structure of the Children's Scale for Hostility and Aggression: Reactive/Proactive (C-SHARP) and demonstrate measurement invariance (consistent performance across clinical groups) between clinic-referred groups with and without autism spectrum disorder (ASD). We also provide evidence of the construct validity of the C-SHARP.
Methods:
Caregivers provided C-SHARP, Child Behavior Checklist (CBCL), and Proactive/Reactive Rating Scale (PRRS) ratings for 644 children, adolescents, and young adults 2–21 years of age. Five types of measurement invariance were evaluated within a confirmatory factor analytic framework. Associations among the C-SHARP, CBCL, and PRRS were explored.
Results:
The factor structure of the C-SHARP had a good fit to the data from both groups, and strict measurement invariance between ASD and non-ASD groups was demonstrated (i.e., equivalent structure, factor loadings, item intercepts and residuals, and latent variance/covariance between groups). The C-SHARP Problem Scale was more strongly associated with CBCL Externalizing than with CBCL Internalizing, supporting its construct validity. Subjects classified with the PRRS as both Reactive and Proactive had significantly higher C-SHARP Proactive Scores than those classified as Reactive only, who were rated significantly higher than those classified by the PRRS as Neither Reactive nor Proactive. A similar pattern was observed for the C-SHARP Reactive Score.
Conclusions:
This study provided evidence of the validity of the C-SHARP through confirmation of its factor structure and its relationship with more established scales. The demonstration of measurement invariance demonstrates that differences in C-SHARP factor scores were the result of differences in the construct rather than to error or unmeasured/nuisance variables. These data suggest that the C-SHARP is useful for quantifying subtypes of aggressive behavior in children, adolescents, and young adults with DD.
Introduction
M
One reason why IDD researchers have not studied subtypes of aggressive behavior may be limitations in available scales. Popular scales for typical populations are frequently inappropriate for use in people with IDD. Measures that were developed for patients with IDD are useful for a broadband understanding of problem behaviors (e.g., the Aberrant Behavior Checklist) (Aman et al. 1985), but do not provide a detailed assessment of aggressive behavior. The Children's Scale for Hostility and Aggression: Reactive/Proactive (C-SHARP) (Farmer and Aman 2009) is an empirically derived informant checklist of several types of aggressive behaviors. The C-SHARP addresses five types of aggression, and it also attempts to determine the valence of aggression (i.e., reactive versus proactive). Therefore, the C-SHARP may be better suited for clinical and research settings in which aggressive behavior is the primary target of assessment or intervention. The C-SHARP was developed in a sample of children with IDD, in which it was shown to have adequate reliability and validity (Farmer and Aman 2010). The subjects, identified through special education classes within Iowa, had a range of diagnoses and intellectual functioning. Although the preliminary psychometric properties were acceptable, no data were available on the comparability of the psychometric properties of the C-SHARP between more homogenous groups, such as those with and without autism spectrum disorders (ASD).
In order to compare groups of individuals on a certain trait, or to evaluate whether correlates of that trait differ between groups, one must assume that the quantification of that trait is on the same measurement scale in both groups (Widaman and Reise 1997). Scores on a questionnaire should accurately quantify the construct of interest in an individual compared with other individuals, without being distorted by demographic characteristic, subgroup, diagnostic status, or other constructs that may be irrelevant. This is referred to as measurement invariance, and when measurement invariance is demonstrated, researchers may compare and contrast the occurrence, determinants, and consequences of a latent score (i.e., the underlying construct) with confidence (van de Schoot et al. 2012). Measurement invariance is most commonly evaluated when adapting measures for a new language or culture, but only occasionally for differences between clinical and nonclinical conditions. Many studies in ASD have assumed that measurement properties of scales designed for typically developing individuals are adequate, an assumption that is only now starting to be empirically assessed (e.g., Frazier et al. 2014; White et al. 2015).
Like other psychometric statistics, there are varying levels of measurement invariance. Meredith (1993) distinguished between increasing degrees of measurement invariance in a multiple-group confirmatory factor analysis framework. Meredith used the terms configural, weak, strong, and strict to characterize levels of invariance. Configural invariance is the weakest form of measurement invariance, and establishes only that the basic pattern of relationships between the indicators and latent variables is similar between groups. This is equivalent to similar results of separate confirmatory factor analyses (CFAs) in two groups. Weak invariance refers to equivalent factor loadings between groups, but is not sufficient evidence to assume the equivalent scale of latent mean scores between groups. In other words, the strength of relationships between items (indicators) and the factor score (the latent construct) are equivalent between groups, but the groups' latent means still cannot be compared. However, strong invariance, which constrains the intercepts of the measured variables to be equal, is sufficient to allow comparisons of latent mean scores between groups. Finally, the strongest form of measurement invariance, strict, also constrains the residual variances across groups to be equal. This means that the researcher can be confident that differences in scores are a true reflection of differences in the latent (underlying) construct, and not a result of unmeasured or irrelevant influences.
This study was designed to evaluate the psychometric properties, including measurement invariance, of the C-SHARP (Farmer and Aman 2009). It was conducted in a sample of clinically referred children, adolescents, and young adults with and without ASD. In addition to the sequential evaluation of configural, weak, strong, and strict measurement invariance, we present data on the construct validity of the C-SHARP subscales. The C-SHARP has five Problem subscales that assess the amount of aggression in different domains. In addition, it has a Provocation Scale, which indicates the extent to which the aggression is reactive or proactive. First, we predicted that the factor structure of the C-SHARP would be confirmed, and that there would be strong measurement invariance across ASD and non-ASD groups. Second, we hypothesized that the C-SHARP Problem subscales would correlate more strongly with the Child Behavior Checklist (CBCL) (Achenbach and Rescorla 2001) Externalizing Total than with the Internalizing Total. Third, we hypothesized that subjects classified as Proactive and Reactive by the Proactive/Reactive Rating Scale (PRRS) (Dodge and Coie 1987) would have higher scores on the C-SHARP Proactive and Reactive subscales, respectively, than other subjects.
Methods
Participants
Participants were 644 children, adolescents, and young adults 2–21 years of age (7.58 ± 4.19 years) recruited from six United States clinics/research centers. This sample, which excluded participants <2 years, was reported in Farmer et al. (2015). The ASD group (n = 406) was primarily male (n = 339, 84%) and approximately half (n = 194, 48%) had intelligence quotients (IQs) >70. The non-ASD group (n = 238) was 69% male (n = 164) and 59% (n = 141) had IQs >70. Approximately 20% of each group had no IQ data available (ASD, n = 83; non-ASD, n = 47). No data were available on the verbal abilities of the sample.
Primary diagnoses in the ASD group were Diagnostic and Statistical Manual of Mental Disorders, 4th ed., Text Revision (DSM-IV-TR) Autistic Disorder (n = 277, 68%), Pervasive Developmental Disorder-Not Otherwise Specified (NOS) (n = 99, 24%), and Asperger's disorder (n = 30, 7%) (American Psychiatric Association 2000). The non-ASD group was composed of subjects referred to specialty ASD clinics for concerns about neurodevelopmental disability, but for whom ASD was ultimately ruled out. Approximately 20% (n = 54) of the non-ASD group received no DSM-IV-TR diagnosis; the remainder had a primary diagnosis of intellectual disability (n = 49, 21%), developmental delay (n = 25, 11%), attention-deficit/hyperactivity disorder (ADHD) (n = 67, 28%), disruptive behavior disorder (n = 21, 10%), or anxiety/mood disorder (n = 22, 9%).
Measures
The C-SHARP (Farmer and Aman 2009) is an informant report measure of aggressive behavior for children with DD. Each item is given a Problem Scale rating (four point scale from Doesn't Happen to Severe/Frequent) and a Provocation Scale rating (five point scale from Provoked to Not Provoked). Problem Scale item ratings are summed to make empirically derived subscale scores: Verbal Aggression (12 items), Bullying (12 items), Covert Aggression (10 items), Hostility (9 items), and Physical Aggression (8 items). No scoring conventions are established for the Provocation Scale, which is scored for a given item only when the corresponding Problem Scale rating is not zero. The informant rated the Provocation item on a scale from −2 (reactive) to +2 (proactive), but we used a simplified scoring for the current analyses. Provocation Scale item ratings were coded as Proactive (>0), Reactive (<0), or neutral (= 0). The number of items rated as Proactive and Reactive was summed across all algorithm items (51 possible ratings; 48 items with 3 counted on two subscales each).
Proactive and reactive aggression were also measured with the PRRS (Dodge and Coie 1987). The original version of this six item scale was rated by teachers on a five point scale (never to almost always) to reflect how frequently the statement applied to the subject. Average scores of ≥3 on either the proactive or reactive item set are considered high. In the current study, the response scale was modified to match the C-SHARP's Problem Scale (ratings of 0–3), so that average ratings of ≥2 were considered high. The PRRS items were administered on the same form as the C-SHARP.
The CBCL (Achenbach and Rescorla 2001) is a widely used parent report measure of problem behaviors. Children <6 years of age received the Preschool version and children ≥6 years of age received the School-Age version. Both versions produce age- and sex-based standard scores. To facilitate the combination of the Preschool and School-Age versions, only the Externalizing Total and Internalizing Total were used in the current analyses.
Procedure
This study was approved by the Institutional Review Boards at the following institutions: Ohio State University (coordinating site), Nationwide Children's Hospital of Columbus, University of Missouri, University of Illinois at Chicago, University of Utah, Seattle Children's Hospital, and the Children's Medical Center of Dayton. At all sites, parents were asked to complete the C-SHARP, the PRRS, and the CBCL about their child, considering the child'behavior over the preceding month.
Statistical analysis
The first goal was to confirm the factor structure of the C-SHARP and to evaluate the measurement invariance across clinic-referred samples with and without ASD. We used several data preparatory methods prior to analysis. In order to ensure an adequate number of responses per category for each C-SHARP item, rarely endorsed (<5%) response categories were collapsed with the next lowest category. Missing data (<5% for each subject) were imputed in five complete data sets using the Amelia package (Honaker et al. 2011). The imputed data sets were evaluated using the lavaan package (Rosseel 2012), and pooled according to standard multiple imputation rules (Rubin 2004).
All CFA procedures were completed using R software (R Core Team 2014). The general structure of the C-SHARP is shown in Figure 1. We performed a sequential series of tests of increasingly restricted parameters. First, we tested configural (structural) invariance, followed by weak (equivalent factor loadings), strong (weak plus equivalent intercepts), strict 1 (strong plus equivalent residuals), and strict 2 (strict 1 plus equivalent latent factor variance/covariance). In other words, the initial CFA model shown in Figure 1 was iteratively run with increasing levels of restrictions on parameters, setting them to equality between groups. Models were estimated using maximum likelihood with robust standard errors.
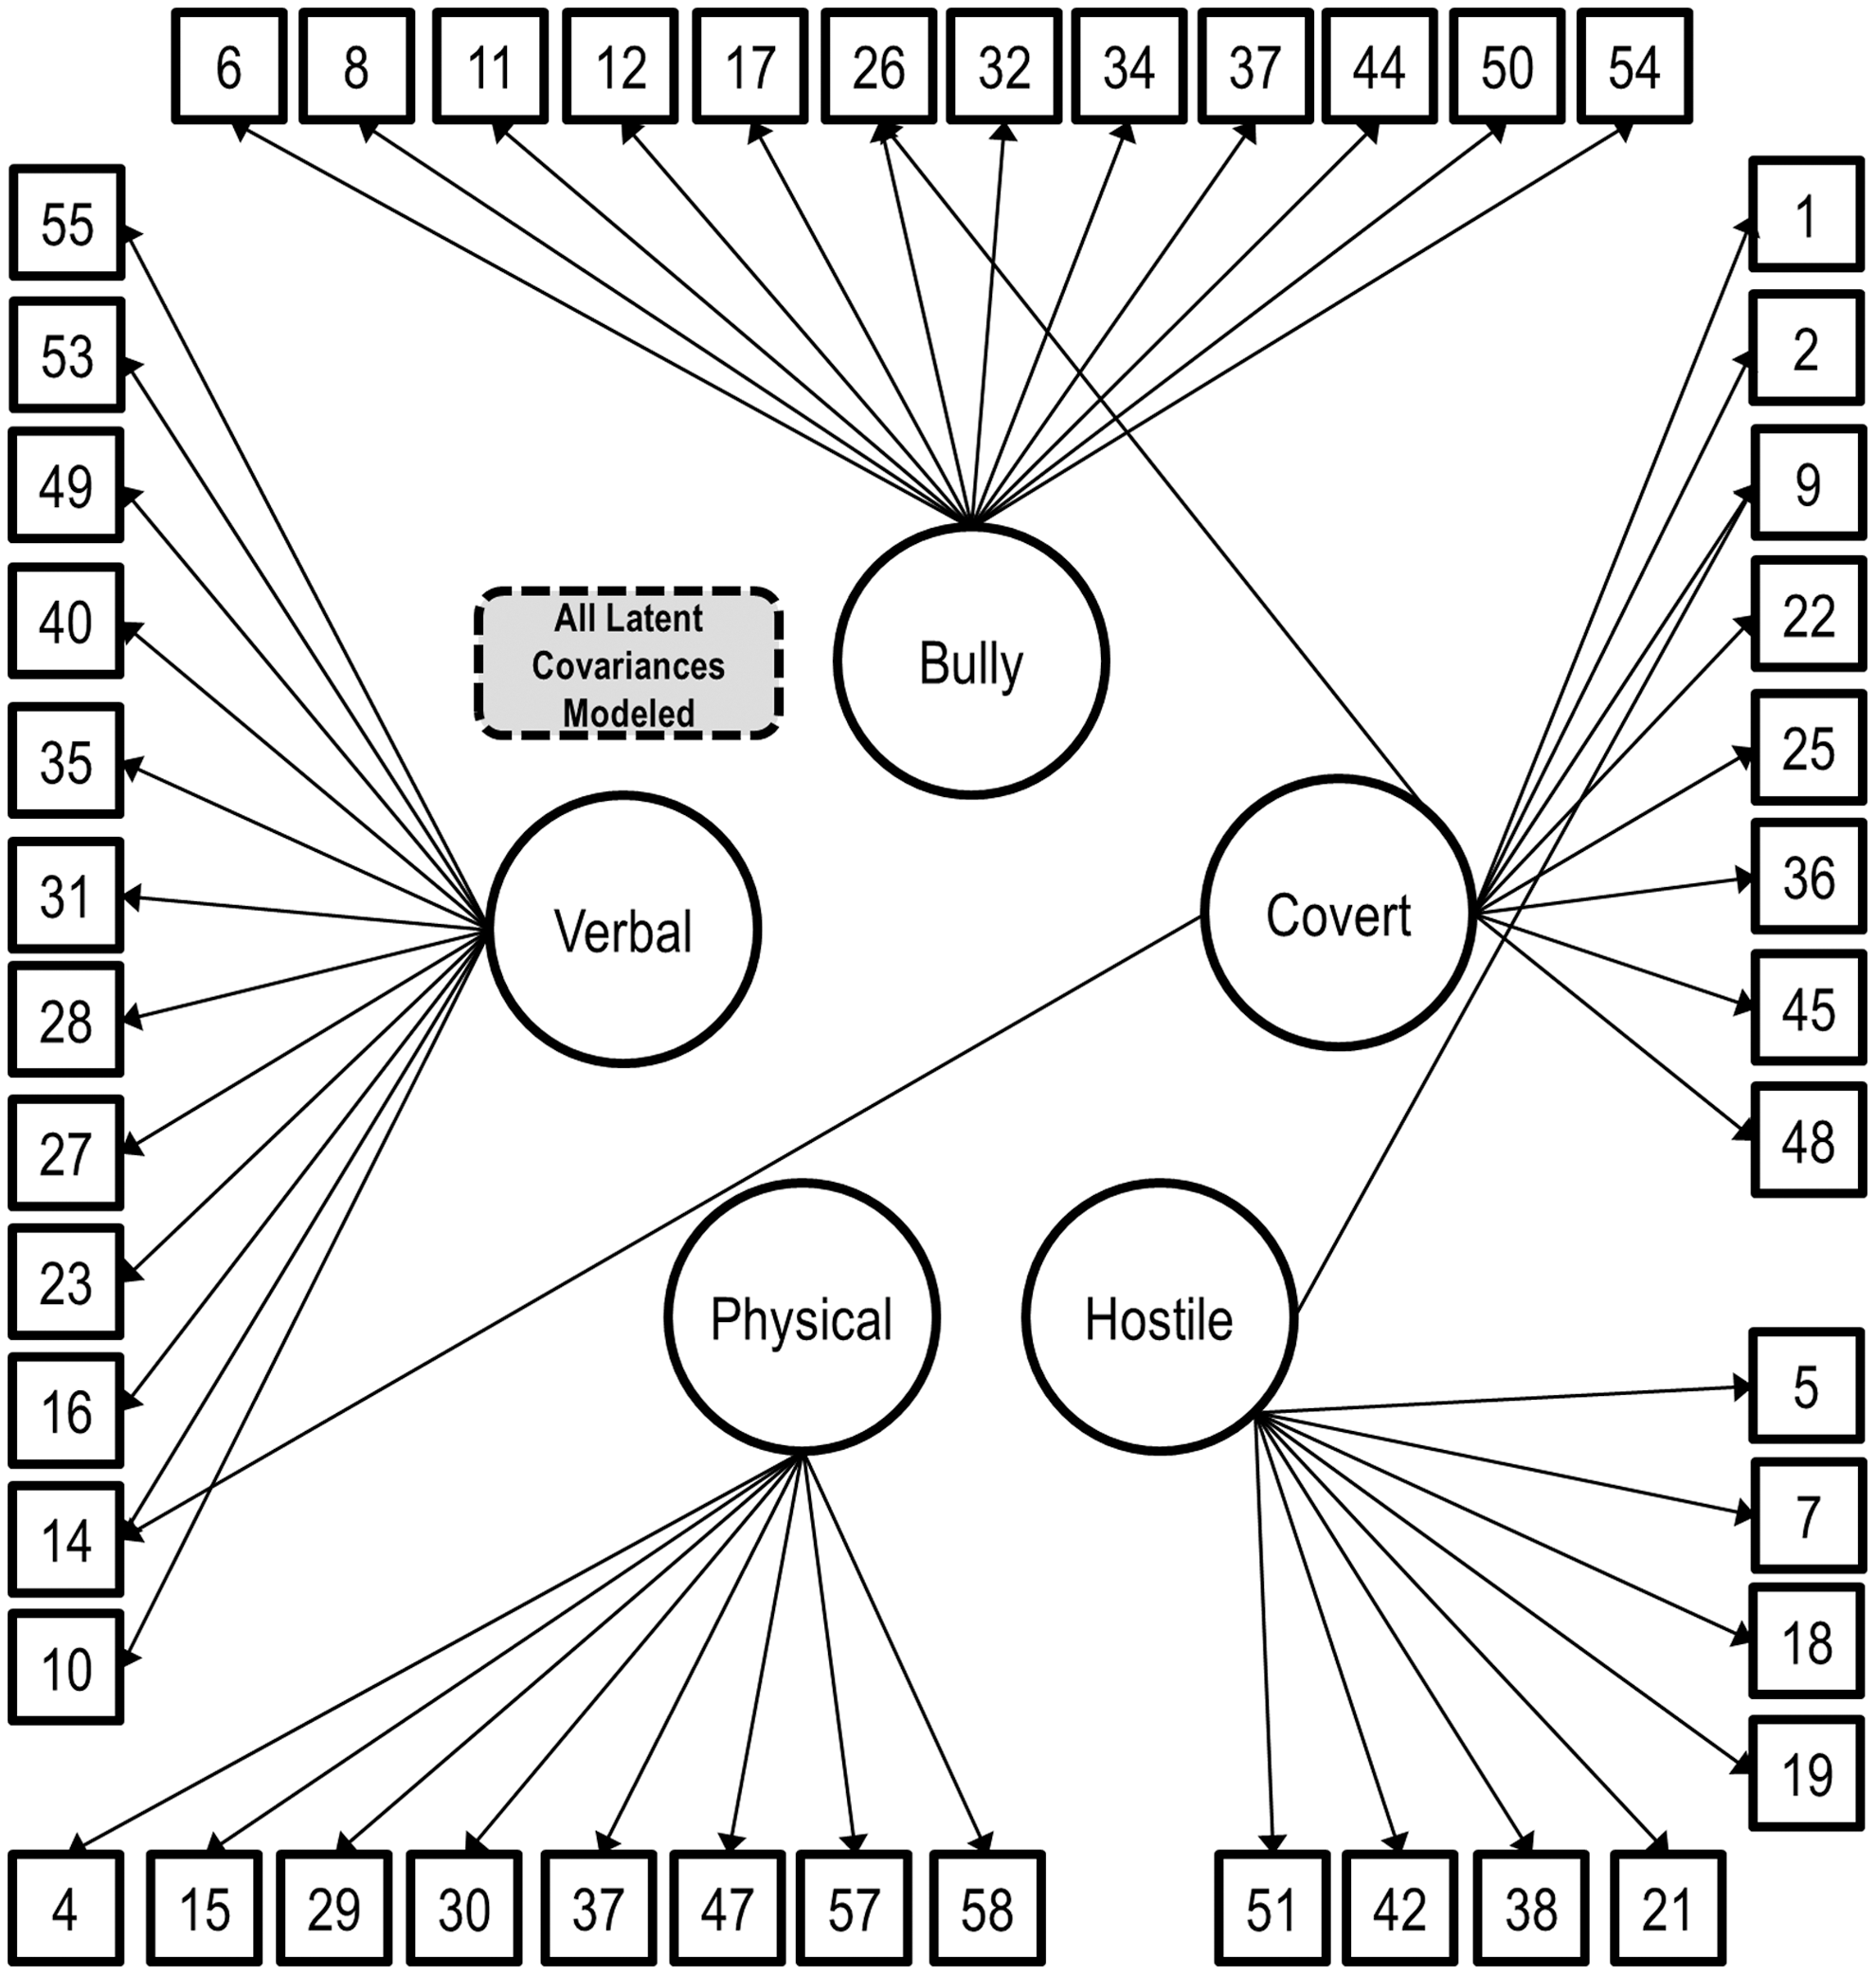
General structure of the Children's Scale for Hostility and Aggression: Reactive/Proactive (C-SHARP). All covariances were modeled, but were excluded from the diagram for clarity. This path diagram reflects the factor structure of the C-SHARP (including three cross-loadings), which was tested in the current analyses. The measurement invariance analyses in the current study placed restrictions on some of these paths (and some not illustrated here) to equality between groups.
A combination approach was used to evaluate model fit. Satorra–Bentler (SB-) χ2 was used to evaluate absolute model fit, and χ2 difference tests were used to compare nested models. Also calculated was the χ2 per degrees of freedom for each model, where lower values indicated better fit. However, χ2 tests are very sensitive to large sample sizes. As such, other fit statistics were calculated based on their frequency of use in the literature and expert recommendation for use in measurement invariance testing. The root mean square error of approximation (RMSEA) and standardized root mean residual (SRMR) are reported as goodness of fit measures for individual models (though their utility in model comparisons is less clear). Lower values indicate better fit (preferably <0.05 and <0.08, respectively). The Akaike information criterion (AIC) is reported as a measure of nested or nonnested comparative fit, where lower values are preferred. Finally, the comparative fit index (CFI) and McDonald's non-centrality index (McNCI) are reported, as they measure fit of an individual model (with values closer to 1.0 preferred) and have recommended cutoffs for evaluating nested measurement invariance tests. Simulation studies suggest that measurement invariance should be rejected at the p < 0.05 level when ΔCFI <−0.005 or when ΔMcNCI <−0.010 (Cheung and Rensvold 2002; Chen 2007). Although these simulation studies also suggested cutoffs for changes in RMSEA, SRMR, AIC, and other goodness of fit statistics, these were not considered in this article, as the evidence of their utility is less consistent, whereas the greatest support exists for ΔCFI and ΔMcNCI.
Two structural equation modeling reliability estimates were calculated: Raykov's (2001) method uses covariance structure analysis with nonlinear constraints to estimate the reliability of a factor, controlling for another factor. Bentler's lower bound (Bentler 2009) is interpreted as the unconditioned reliability of a factor. This method does not adjust for cross-loadings, and was, therefore, expected to be lower than the Raykov estimate. In both cases, possible values range from 0.0 to 1.0, with higher values indicating greater reliability. Traditional cutoffs are applied: Values >0.70 are acceptable, values >0.80 are good, and values >0.90 are very good.
The remainder of the validity analyses was completed in SAS version 9.3 (SAS Institute 2012). Pearson correlations or one way ANOVA with post-hoc Scheffe tests were used where appropriate. Differences in dependent correlations were tested using the method described by Steiger (1980), implemented using an online calculator (Lee and Preacher 2013). Alpha was set to p < 0.05.
Results
Measurement invariance of the Problem Scale
Fit statistics for the models of sequential invariance testing are presented in Table 1. As expected with the large sample size, the SB-χ2 was significant for each model, suggesting the data did not fit the model. However, other fit measures were acceptable, confirming the fit of the C-SHARP structure described in Figure 1. First, configural invariance was considered. The RMSEA (0.053) and SRMR (0.083) suggested that the model performed well, given the number of items and the multidimensional factor structure of the scale. In other words, the fit of the model described in Figure 1 was similar between groups. Next, we tested for weak invariance by restricting the factor loadings to be equal across groups. The nested χ2 test suggested that weak invariance did not fit the data as well as configural invariance (p = 0.007). However, ΔCFI and ΔMcNCI did not reject the weak invariance model. Therefore, the data indicated that the model met or exceeded assumptions for weak invariance.
Models are additive and were tested sequentially, left to right. Constraints for equality across groups placed on each model are as followed: Configural, structure; weak, loadings; strong, intercepts; strict V1, residuals; strict V2, latent variance/covariance. Low values are better for the RMSEA (good: <0.05) and the SRMR (good: <0.08). The AIC is a comparative measure of fit with no intrinsic meaning; lower values indicate better fit. CFI and McNCI are measures of absolute and relative fit; measurement invariance is rejected when ΔCFI <−0.005 or when ΔMcNCI <−0.010. The statistic associated with the preferred model for each index is bolded. Ultimately, the strict V2 model was judged superior and was used as the final model.
C-SHARP, Children's Scale for Hostility and Aggression: Reactive/Proactive; CFI, comparative fit index; McNCI, McDonald's non-centrality index, AIC, Akaike information criterion, RMSEA, root mean square error of approximation, SRMR, standardized root mean residual.
As such, we proceeded to evaluate strong invariance by equating the item intercepts across groups. Again, the nested χ2 test suggested that the less restrictive model (weak invariance) fit better, but ΔCFI and ΔMcNCI were in the acceptable range. Next, the residuals were equated across groups to evaluate strict invariance. In this analysis, the nested χ2 test suggested that strict invariance fit better than strong invariance, and all goodness of fit measures improved. Hence, the fit indices indicated that strict invariance characterized the obtained factor structure as well or better than the weaker versions of invariance. Finally, a stricter form of invariance, equating the latent covariances, further improved the model on all indices. In summary, the best-fitting model was one that restricted to equivalence between ASD and non-ASD groups the following parameters: General structure, specific factor loadings, item intercepts and residuals, and latent variances/covariances. This model had the most preferred χ2/df, CFI, McNCI, AIC, and RMSEA. The SRMR, however, was higher than preferred. Additionally, although the McNCI favored this model, the absolute fit was still relatively weak (i.e., it is preferable for the McNCI to be closer to 1.0 than was actually achieved). Factor covariances were moderate to high (range 0.50–0.90). The strongest relationship was between the Physical and Bullying factors, which was unsurprising, as many of the Bullying behaviors take a physical form. The factor loadings, intercepts, and latent covariance matrix and latent means for this final model are presented in Tables 2 and 3.
Some items are paraphrased. Cross-loadings are intentional. For brevity, non-algorithm items are omitted. Item intercepts are a latent representation of the observed item mean. Therefore, they are similar but not identical to the mean rating on each item. Item residuals reflect the error variance, or variance in the observed item for which the structural model cannot account. Reliability estimates are interpreted on the conventional scale: >0.7, acceptable; >0.8 good; >0.9 very good.
ASD, autism spectrum disorder.
Reliability of the Problem Scale
The reliability estimates are found in Table 2. Factors 1, 2, and 4 (Verbal, Bullying, and Hostility subscales) had reliability estimates in the good range, indicating that these factors are appropriate for research and clinical studies on aggression. Factor 5, Physical Aggression, achieved an acceptable level of reliability on both metrics. The only factor on which the two reliability methods did not agree was Factor 3 (Covert), which had a Raykov estimate in the good range (0.83) and a Bentler's lower bound estimate in the poor range (0.60).
Validity of the Problem and Provocation Scales
CBCL scores were available for 457 (71%) participants. C-SHARP Problem Scale scores were significantly and positively correlated with CBCL Externalizing and Internalizing Syndrome Scales (Fig. 2). Consistent with expectations, Pearson correlations for all C-SHARP subscales were significantly (p < 0.001) stronger with the CBCL Externalizing Scale than with the Internalizing Scale.
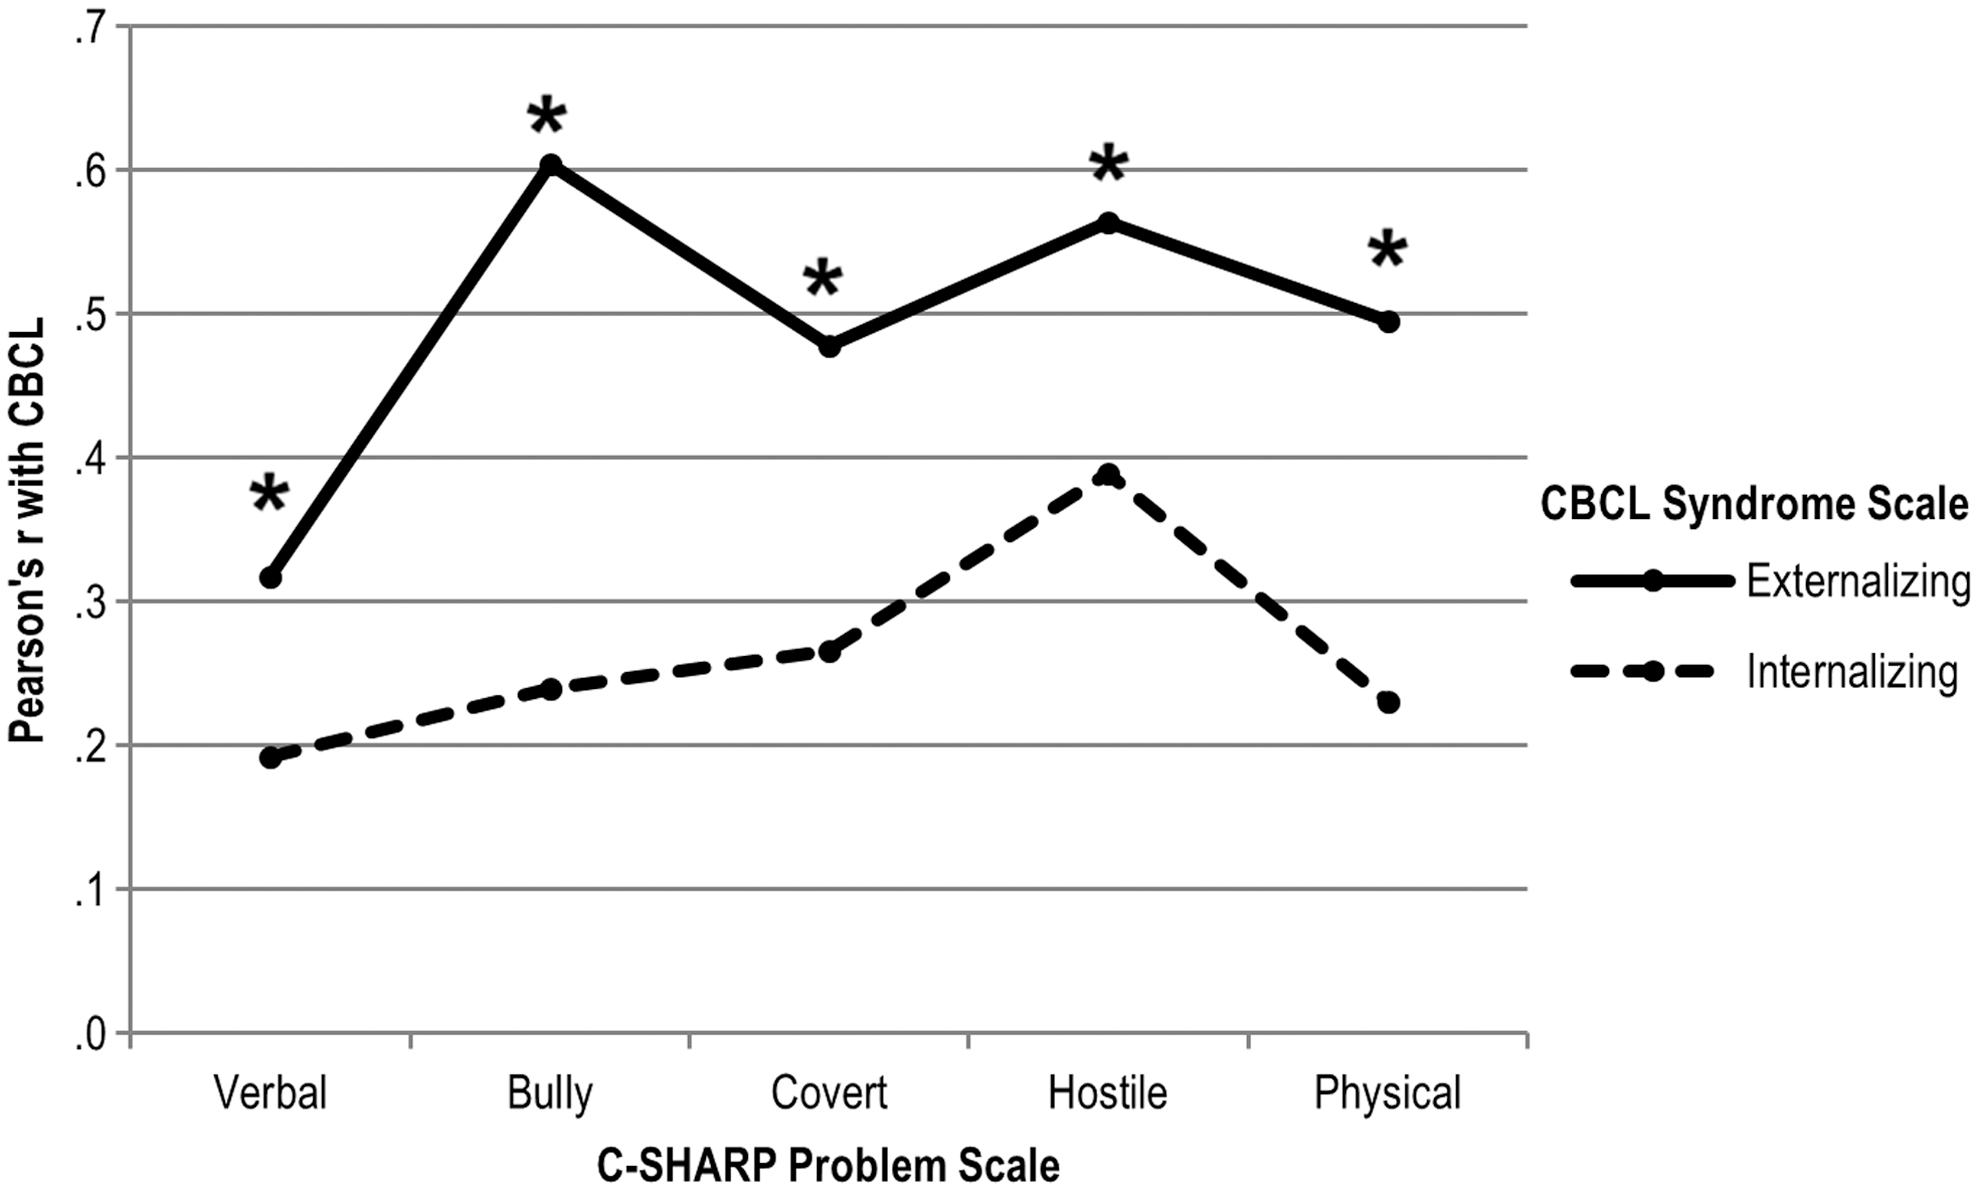
Pattern of Pearson correlations between the Children's Scale for Hostility and Aggression: Reactive/Proactive (C-SHARP Problem Scale) and the Child Behavior Checklist (CBCL) Syndrome subscales; n = 457 (some children missing CBCL); all correlations p < 0.0001; test of difference in dependent correlations all p < 0.001.
Initially, the threshold for categorization as PRRS Reactive and PRRS Proactive was set at 2; however, only nine of 644 subjects had a PRRS Proactive item mean score that exceeded this threshold. Therefore, subjects were considered Proactive or Reactive if the item-mean score was >1 on the PRRS Proactive and Reactive subscales, respectively. The majority of the sample (n = 410, 64%) was classified as neither Proactive nor Reactive (see Fig. 3). Approximately 35% (n = 228) of the sample surpassed the threshold for Reactive, as did 9% (n = 58) for Proactive. PRRS Proactive and Reactive classifications were not mutually exclusive; only six (<1%) participants were classified as Proactive only. Because of its small size, this group was excluded from further analysis.

Comparison of Proactive/Reactive Rating Scale (PRRS) classifications and Children's Scale for Hostility and Aggression: Reactive/Proactive (C-SHARP) Provocation Scale scores; *p < 0.05. Figure shows relationship between PRRS classifications and C-SHARP Provocation Total Scores. PRRS-Proactive Only was excluded from C-SHARP analysis because of the small sample size (n = 6). Error bars are standard deviation. F values correspond to omnibus test; post-hoc Scheffe tests were used to evaluate between-group differences. C-SHARP Provocation Proactive and Reactive Scores are the total number of items rated by the parent as Proactive or Reactive, respectively (out of a possible 51). Neutral scores are excluded.
C-SHARP Provocation Total scores were compared between the PRRS groups (Reactive Only, Combined Proactive + Reactive, and Neither Reactive nor Proactive). Consistent with expectations, subjects in the Combined Proactive and Reactive group received higher scores on C-SHARP Proactive Total than the Reactive only group, who received significantly higher scores than the Neither group (Fig. 3). A similar pattern was observed for the C-SHARP Reactive Total; both the Combined Proactive and Reactive group and the Reactive group had higher C-SHARP scores than the Neither group; however, the Combined and Reactive only groups did not differ.
Discussion
The primary goal of this study was to confirm the factor structure and establish the measurement invariance of the C-SHARP between clinic-referred samples, namely subjects diagnosed with ASD and those without. We demonstrated acceptable-to-good fit of the C-SHARP factor structure, as well as strict invariance in both ASD and non-ASD samples, indicating that differences between groups on observed (factor) scores may be interpreted as resulting directly from differences on the underlying constructs measured by the C-SHARP. The secondary goal was to evaluate the construct validity of the C-SHARP by comparing it to two existing scales, the CBCL and the PRRS. Consistent with our hypotheses, the C-SHARP Problem Scale was more strongly associated with the Externalizing subscale of the CBCL than with the Internalizing one, and the C-SHARP Provocation scales were predictably related to the PRRS Proactive and Reactive ratings.
The demonstration of measurement invariance of the C-SHARP is an important step that has only recently been commonly acknowledged in ASD research (e.g., White et al. 2015). In this study, the best-fitting model constrained to equality between groups the latent variance/covariance matrix between factors on the C-SHARP. This indicates that the correlations between C-SHARP scores are similar between groups. Such evidence is not required to compare scores between groups, but Widaman and Reise (1997) characterized it as more “elegant” (p. 298). Researchers disagree on whether strict invariance should be expected or required, arguing that perhaps only strong invariance should be expected with clinical data (Meredith 1993; Widaman and Reise 1997). However, strict invariance provides excellent evidence for the comparability of scores between groups (ASD and non-ASD, in our case), which is a cornerstone of clinical research. For example, a previous study published on this data set found mean differences between the ASD and non-ASD groups on all C-SHARP subscales, the interpretation of which depends upon measurement invariance (Farmer et al. 2015).
Factor reliability was generally in the good range, indicating that the C-SHARP is appropriate for research and clinical studies of aggression. Given that strict invariance was demonstrated, the reliability estimates are identical across groups. One note of caution is warranted regarding Factor 3 (Covert): Raykov's method indicated that the reliability of this factor was good, provided that the other scales are considered. However, Bentler's lower bound estimates the unconditioned reliability of a factor, independent of the other factors, and found the reliability of Factor 3 to be poor. This is perhaps unsurprising, as successful covert behavior should be, by its secretive nature, difficult to rate reliably. In practice, this means that Factor 3 may be used confidently by clinicians and researchers as long as the full C-SHARP is administered, but it should be interpreted with caution if it is used alone.
Scores on the C-SHARP Problem scale were more strongly related to the CBCL Externalizing total than to the Internalizing total, supporting the construct validity of the instrument. The Externalizing total comprises the Aggression and Attention Problem subscales, as well as Rule Breaking Behavior for school-age participants; therefore, it is unsurprising that C-SHARP scores are related to this index. However, the C-SHARP goes into much greater detail (48 items about aggression versus about 20 items on the CBCL); therefore, it is unsurprising and even encouraging that the correlations were generally moderate. Stronger correlations might suggest that the scales are redundant. The weak correlations between the C-SHARP and the CBCL Internalizing scale (Emotionally Reactive [preschool only], Anxious/Depressed, Somatic Complaints, and Withdrawn subscales) confirm that the two constructs are only loosely related. Thus, the divergent validity of the C-SHARP was supported.
This was the first study to evaluate the construct validity of the C-SHARP Provocation scales, which are intended to measure the degree to which a subject's aggressive behavior is reactive/impulsive or proactive/instrumental. Patterns of scores on the C-SHARP reactive and proactive scales were consistent with expectations based on PRRS classifications, supporting their validity. However, there were several other noteworthy results of these analyses. First, a very small proportion of subjects (∼1%) met the established criterion for PRRS Proactive classification, which was stricter than the criterion we ultimately employed. Although one may not expect high rates of proactive aggression in a sample referred for developmental assessment, this rate differs dramatically from the 9% of schoolchildren classified as Proactive in both the PRRS development study and a subsequent study (Dodge and Coie 1987; Salmivalli and Nieminen 2002), and the 59% of subjects classified as Proactive in a study of psychiatrically referred children and adolescents (Connor et al. 2004). It may be that the PRRS is simply not sensitive enough to assess a more nuanced presentation of proactivity in patients presenting for developmental evaluation. If this is true, the practical utility of the PRRS might be quite limited in this context.
Second, in contrast to the few subjects classified as Proactive, a sizeable proportion (35%) of subjects were categorized by the PRRS as Reactive, suggesting that impulsive or reactive aggression is a salient construct in the developmental clinic-referred population. Subjects classified by the PRRS as Reactive were also rated more frequently as Reactive on the C-SHARP. Importantly, the C-SHARP gathers specific information only about the parents' impression of whether the behavior was planned or not, and not about other flags of impulsive aggression, such as negative emotions such as frustration, regret, guilt, or fear (Donovan et al. 2003). Still, experts in the field suggest that the gold standard of impulsive aggression measurement may be a battery that combines measurement of specific behaviors with measures of impulsive traits (Jensen et al. 2007). Therefore, it may be that the combination of the C-SHARP Problem and Provocation scales will be a useful tool in the increasing number of studies of impulsive aggression in youth with DD.
A major criticism of aggression scales is the degree to which they fail to separate the form and function of behaviors (Little et al. 2003). This is common, and may be a limitation of instruments such as the C-SHARP and the CBCL. Other limitations of this study include the heterogeneous nature of the non-ASD comparison group; although the uniting aspect was that they were all referred with suspicion of ASD, the final diagnoses varied. The instruments selected to demonstrate the validity of the C-SHARP scales are widely used and researched, but there are other (more detailed) measures of impulsive/reactive and proactive/instrumental aggression (for review, see Polman et al. 2007). One group has isolated an impulsive aggression subscale from the CBCL items (Jensen et al. 2007); however, we did not have access to item-level data for this instrument, and hence could not use this more refined score in the current study.
The results of this study suggest that the C-SHARP may be a useful scale for researchers studying aggressive behavior in children with DD. Future research should establish the sensitivity to treatment, in order to determine the utility of the instrument for use in clinical trials. Furthermore, correspondence between the C-SHARP and its adult counterpart, the A-SHARP (Matlock and Aman 2011), should be explored.
Conclusions
Subtypes of aggression are useful in characterizing patients and predicting outcome, and the C-SHARP is one of the few measures designed to assess subtypes of aggression in individuals with DD. We confirmed the factor structure of the C-SHARP and demonstrated its measurement invariance across clinic-referred samples with and without ASD. With measurement invariance established, users may be confident that between-group differences are reflective of differences in the construct, rather than error or unmeasured influences. We also presented evidence of construct validity; C-SHARP Problem Scale scores were associated with both the CBCL Externalizing and Internalizing scales as expected, and the C-SHARP Provocation scores were associated with the External Proactive/Reactive ratings as expected. Users should feel confident of the psychometric profile of the C-SHARP in children with DD, and may find it to be an excellent alternative to broadband assessments such as the CBCL or Nisonger Child Behavior Rating Form (NCBRF).
Clinical Significance
Based on this and previous research, the C-SHARP has substantial data attesting to its validity and reliability. When used with its adult counterpart, the A-SHARP, the scale can be used to trace the course of aggression over much of the lifespan. Together, the C-SHARP and the A-SHARP may be good options for identifying clinically problematic aggression, for comparing levels of aggression among clinic-referred samples, and for monitoring treatment effects in patients requiring intervention.
Footnotes
Acknowledgments
We thank Dr. Charles Cowan (Seattle Children's Hospital), who contributed substantial data to this study. The following individuals assisted in data collection and entry: Christopher Cope, Meghan Ellingsworth, Caroline Sansbury, Annahir Cariello, Alyson Froehlich, Denise Ward, and Kristina Butler. This work was prepared from the doctoral dissertation of Cristan Farmer, Ohio State University.
Disclosures
No competing financial interests exist.