




Abstract
Objective:
The purpose of this study was to investigate the clinical effect and safety of a broad spectrum, 36 ingredient micronutrient (vitamins and minerals) in treating children with attention-deficit/hyperactivity disorder (ADHD).
Methods:
This open-label, on-off-on-off (reversal design) study followed 14 participants (8–12 years of age) with ADHD, diagnosed using standardized instruments, for 6 months with no dropouts. Following baseline assessment, including hematology and biochemistry screening, participants began an 8 week treatment phase with micronutrients titrated up to maximum dose (15 capsules/day). Treatment was withdrawn for 4 weeks, reinstated for a further 8 weeks, and then withdrawn for 4 weeks. Primary outcomes included the Conners' Parent Rating Scale, the Clinical Global Impressions Scale (CGI), and the Strengths and Difficulties Questionnaire – Parent version (SDQ). Secondary outcomes were mood and global functioning.
Results:
Modified Brinley plots revealed a reduction in ADHD symptoms, improved mood, and improved overall functioning during intervention phases, and deterioration in ADHD symptoms, mood, and overall functioning during the withdrawal phases. Reliable change analyses, Cohen's d and percent superiority effect sizes, 95% confidence intervals and t tests confirmed clinically and statistically significant change between the intervention and withdrawal phases, with large effect sizes observed pre- to post-exposure of micronutrients (d = 1.2–2.2) on ADHD symptoms during intervention phases. Seventy-one percent of participants showed at least a 30% decrease in ADHD symptoms by the end of the second treatment phase, and 79% were identified as “much improved” or “very much improved” at the end of the second phase (5 months) based on the clinician-rated CGI when considering functioning generally. The SDQ showed that these benefits occurred across other areas of functioning including emotional symptoms, conduct problems, and prosocial behaviours. The children's self-reports confirmed the improvements. Excellent adherence to treatment occurred throughout, side effects were mild and transitory, and no safety issues were identified through blood analyses.
Conclusions:
This study demonstrates the clinical benefit, feasibility, and safety of broad-spectrum micronutrients in the treatment of childhood ADHD. Replications utilizing double-blind placebo-controlled studies are warranted. Trial is registered with the Australia and New Zealand Clinical Trial Registry: ACTRN12612000645853
Introduction
A
Notwithstanding the negative trials using micronutrients in the 1970s and 1980s (Arnold et al. 1978; Haslam et al. 1984), recent research highlights the importance of considering nutritional factors in the development and expression of ADHD (Oddy et al. 2009; Howard et al. 2011). Investigations range from the impact of processed foods (Howard et al. 2011) and food dyes (Pelsser et al. 2011; Arnold et al. 2012), to the role of essential fatty acids (Milte et al. 2012), and early malnutrition (Galler et al. 2012). Although it was likely that the earlier studies used micronutrient doses too high and too toxic for the children to benefit from taking them, these studies, nevertheless, were viewed as demonstrating a negative association, probably explaining the loss of interest in the field. Another factor likely impeding research into nutrient treatments for ADHD has been the focus on single nutrients, such as zinc or iron (Bilici et al. 2004; Konofal et al. 2008; Cortese et al. 2012), given that these studies yielded modest and often inconsistent findings (Rucklidge et al. 2009, 2013).
In contrast, there is growing evidence that micronutrients (vitamins and minerals) given in larger combinations may be beneficial in the treatment of various psychiatric disorders, including autism, bipolar disorder, anxiety, and ADHD (Rucklidge and Kaplan 2013), and nutrient supplementation is emerging as a potentially effective, low-risk, and minimally invasive treatment for children with ADHD (Rucklidge and Kaplan 2014).
EMPowerplus 1 (EMP+), the broad-based micronutrient formula used in the current research, consists of 36 ingredients (14 vitamins, 16 minerals, 3 amino acids, and 3 antioxidants – see Table 1 for full ingredient list) and is the most-researched micronutrient formula for the treatment of psychiatric symptoms (Popper 2014). The formula has been investigated in more than 20 peer-reviewed publications (Rucklidge and Kaplan 2013) and has an established safety record (Popper 2014). Although there has been an increase in research showing the effectiveness and efficacy of EMP+ on the reduction of symptoms in adults with ADHD (Rucklidge and Harrison 2010; Rucklidge et al. 2014a), research in children with ADHD is currently limited to a few case studies and open-label trials (Popper 2001; Kaplan et al. 2002, 2004). Further, product safety, through assessment of blood biochemistry, was not directly investigated in previous trials.
Plus a proprietary blend of: dl-phenylalanine, glutamine, citrus bioflavanoids, grape seed, choline bitartrate, inositol, ginkgo biloba, methionine, germanium sesquioxide, boron, nickel, and vanadium.
This article presents data from an open-label, single-case design (Morgan and Morgan 2009; Dallery et al. 2013) assessing the feasibility, clinical effect, and safety of EMP+ on medication-free children with ADHD over a 6 month period. Outcome measures included widely validated parent-, clinician-, and child-rated measures designed to capture difficulties with attention, hyperactivity/impulsivity, mood, and overall functioning.
Methods
Participants
Participants were recruited in Canterbury, New Zealand, from September 2011 to January 2013 through current research databases at the University of Canterbury; new referrals from family physicians, psychiatrists, psychologists, and local mental health services; and self-referrals from advertisements. Out of 20 referrals, 14 children, 8–12 years of age at their initial visit, participated in this study. See Figure 1 for the CONSORT diagram.

CONSORT flow diagram indicating participant inclusion/exclusion, completion, and dropout over the course of the study.
Informed consent and assent
After the experimental nature of the trial was described, including a review of the available conventional treatments, written consent was obtained for each participant from one parent or guardian. Details of the proposed study were also explained to the participants in language appropriate for their age, and their assent was obtained. Consent and assent included study participation and permission to publish. The study was approved by both the statutory regional Health and Disability Ethics Committee and the University of Canterbury Human Ethics Committee. The trial was registered with the Australia and New Zealand Clinical Trial Registry (ACTRN12612000645853).
Inclusion and exclusion criteria
Participants met criteria for ADHD based on the Diagnostic and Statistical Manual of Mental Disorders, 4th ed., Text Revision (DSM-IV-TR) (American Psychiatric Association 2000) and the Kiddie Schedule for Affective Disorders and Schizophrenia for School-Aged Children-Present and Lifetime version, a semistructured interview conducted with participants and their parents/caregivers (Kaufman et al. 1997). All baseline clinical interviews were conducted by a clinical psychologist, and participants were tracked over time, either by a clinical psychologist, or by an experienced clinical psychology trainee under clinical supervision. Participants were also required to have an elevated level (T score >70) on one or more of the ADHD subscales of the Parent or Teacher Conners' Rating Scales (Conners 1997). Nine of the participants (64%) had been previously diagnosed with ADHD by other mental health professionals. Participants were required to be free from psychiatric medication for at least 4 weeks prior to beginning the study. We purposefully included participants with other Axis I disorders, acknowledging the limitations thereby imposed, but also appreciating that the clinical utility and generality of the results would be increased if the sample was representative of children affected with ADHD.
Participants with a neurological disorder involving brain or other central functioning, or abnormal baseline biochemistry/hematology results, as assessed by the study's physician, were excluded. Participants unable or unwilling to have their blood taken were also excluded. These criteria resulted in exclusion of five participants (Figure 1).
Safety data and psychiatric assessment
Participants with a confirmed ADHD diagnosis underwent baseline hematology/biochemistry screening, monitored by a physician, before beginning the trial, and again at the end of the initial micronutrient phase (at 8 weeks). The screening included testing thyroid function, serum lipids, blood clotting, iron, copper, zinc, prolactin, and fasting glucose. The hematology/biochemistry screening determined if there were any abnormalities that may have precluded participation in the trial (e.g. Wilson's disease) and enabled individual safety monitoring. As part of the baseline screening, previous evaluations (i.e., medical records, psychological assessments) were reviewed as necessary, and questionnaires were completed by the participant's current teacher with parental consent.
Measures
Demographic variables
Demographic variables, collected from each parent/caregiver, included ethnicity of the child, marital and occupational status of the parents/caregivers, and the family's yearly household income. Using the New Zealand Socioeconomic Index of Occupational Status (NZSEI) (Milne et al. 2013), family socioeconomic status (SES) was estimated. Scores ranged from 10 to 90, with higher scores indicating higher SES.
Primary outcome measures
ADHD was assessed with the first two scales.
1. The Conners' Parent Rating Scale-Revised: Long Form (CPRS-R:L) (Conners 1997) contains 80 questions and 10 subscales. The three subscales that focus on ADHD symptoms – Inattention, Hyperactivity/Impulsivity, and the Total scale – were used as primary outcome measures. Parents answered questions concerning their child's behavior over the past month using a four point Likert scale (0 = not very true at all to 3 = very much true). Scores were converted to T scores based on the gender and age of the child, with scores >65 indicating clinically elevated symptoms. The CPRS scale was completed at baseline and also at switch points when the participant resumed or stopped taking the micronutrients. The standard error of measurement (SEM) values used to compute the reliable change index (RCI) for plotting this measure (discussed subsequently) were taken from Table 7.21 in the Conners' Manual (1997), specifically those for males 9–11 years of age, on the three DSM scales.
2. ADHD Rating Scale-IV (ADHD-RS-IV) (DuPaul et al. 1998): This is a norm-referenced 18 item checklist that measures inattention and hyperactivity-impulsivity symptoms of ADHD (according to Diagnostic and Statistical Manual of Mental Disorders, 4th ed. [DSM-IV] criteria) that was completed in the laboratory every 2 weeks by the parent/caregiver (American Psychiatric Association 1994). This scale was used to input data where the CPRS-R data were missing.
3. Clinical Global Impressions: The Clinical Global Impressions Scale (CGI) (Guy 1976) is a standardized assessment tool with two subscales: Severity of illness (CGI-S) and global assessment of improvement (CGI-I), modified for use with ADHD participants. The CGI-S identifies the clinician's impression of the participant's state of illness severity during that assessment period. Scores range from 1 = normal, not ill, to 7 = very severely ill. The CGI-I is used to measure the participants' change from their baseline assessment. Ratings span 1–7, (“very much improved” to “very much worse”). Ratings at switch points were done as a consensus rating between a clinical psychologist and the clinician who was following the child, based on all the available data. Ratings were based on the entire symptom presentation of a child.
4. Strengths and Difficulties Questionnaire (SDQ): (Goodman 1997) The SDQ is a brief parent-rated screening questionnaire with 25 items divided among five scales: Emotional symptoms, conduct problems, hyperactivity/inattention, peer relationship problems, and prosocial behaviour (Stone et al. 2010). A Total Difficulties Score ranging from 0 to 13 falls within the normal range, 14–16 within the borderline range, and 17–40 in the abnormal range. The SDQ also provides an Impact score showing how much a participant's present difficulties are interfering with life, obtained using a four point Likert scale (0, not at all to 3, a great deal) in four different categories: Home life, friendships, classroom learning, and leisure activities. An Impact Score of 0 is normal, 1 is borderline, and ≥2 is abnormal.
A concerted effort was made to also gather data from the teacher versions of the Conners' and SDQ scales, but this was unsuccessful because of changes in teachers, timing of school holidays, the trial duration (spanning over two school years from the end of one year to the beginning of the next), and the short reversal phase.
Secondary outcome measures
1. Young Mania Rating Scale (YMRS) (Young et al. 1978): The YMRS is a clinician- administered checklist designed to assess the severity of manic symptoms as well as measuring the effect of treatment on mania severity, validated for use in children and adolescents 5–17 years old (Youngstrom et al. 2002). The YMRS includes 11 items, namely elevated mood, increased motor activity or energy, sleep, irritability, speech (rate and amount), language-thought disorder, disruptive-aggressive behavior, sexual interest, thought content, appearance, and insight, ranked on a scale of 0–4 or 0–8. These behaviors are all of interest when assessing individuals with ADHD. Scores of 0–13 indicate minimal severity, 20 mild severity, 26 moderate severity, and 38 severe illness (maximum score = 60). SEM for this measure was calculated using variability and reliability data from Youngstrom et al (2002). It is important to note that although the YMRS is used to assess mania symptoms, our clinical experience has been that children with ADHD score high on the measure, not because of the presence of bipolar symptoms, but because of the overlap in symptoms between ADHD and bipolar disorder, for example, high energy, racing thoughts, irritability, and oppositional symptoms. We used the measure to tap into changes in particular in these overlapping symptoms. Interrater reliability on a subset of these interviews (intraclass correlation coefficient) was estimated at 0.99.
2. Children's Depression Rating Scale (CDRS) (Poznanski et al. 1979): This is a 16 item scale for children 6–12 years of age that measures severity of depression and monitors treatment response (Shanahan et al. 1987). Ratings are based on clinical impressions obtained from an interview and direct questions of the child and caregiver. The CDRS items vary from 3 to 5 point scales, with 1 indicating “normal/not ill.” Participants functioning within a normal range across all items on the CDRS receive a score of 15 (one point per item; with reversal of affect not included in total score); scores of 20–30 indicate borderline depression and 30+ indicates significant depression. Data to compute SEM were from Overholser et al. (1995). Interrater reliability on a subset of these interviews (intraclass correlation coefficient) was estimated at 0.99. Because of the limited funds available to conduct the study, we chose to use the CDRS rather than the CDRS-R, as it is freely available to researchers.
3. Children's Global Assessment Scale (CGAS) (Shaffer et al. 1983): This unidimensional/global measure of social and psychiatric functioning for children and adolescents 4–16 years of age is an adaption of the Global Assessment Scale for adults (Endicott et al. 1976) and was used by the clinician to assess the overall severity of disturbance in each participant. Scores range from 1 (most impaired) to 100 (healthiest), separated into 10 point sections indicating the participant's level of functioning. For example, a child who has some difficulty in a single area, but is generally functioning pretty well would receive a score between 61 and 70. Those individuals scoring at the lower end of the scale (1–10) are judged to need constant supervision, whereas those who score ≥70 are considered to be within the normal range. The SEM used was from Shaffer et al. (1983). Ratings at switch points were done as a consensus rating between a clinical psychologist and the clinician who was following the child, based on all the available data.
4. The Measure Yourself Medical Outcome Profile (MYMOP) (Paterson 2004). This measure was adapted as a self-report measure for the children to report any problems over the past week, and covered hyperactivity, attention, and impulsivity symptoms, as well as mood and sleep. Children rated themselves on each item, on a five point Likert scale (0 = no problems, 4 = major problems).
5. Side Effects Questionnaire: Participants and their caregivers were asked about potential side effects such as nausea/vomiting, stomach aches, skin rashes, headaches, and dry mouth that the child may have experienced between visits, and were also asked if they noticed any other changes that could be attributed to the ingestion of the micronutrients, using a 0 (no problems) to 4 (major problems) Likert scale.
Procedure
The present study used a five phase reversal design with study phases of baseline, first treatment, first reversal, second treatment, and second reversal, replicated across the 14 participants. Baseline data were collected at recruitment. Participants then began taking the micronutrient formula for 8 weeks during the first treatment phase (On 1), which was followed by the first reversal phase off the micronutrients for 4 weeks (Off 1). Upon completion of this phase, the second treatment phase of 8 weeks was completed (On 2), followed by the second reversal phase of 4 weeks (Off 2).
In the first treatment phase, participants began by taking four capsules of EMP+ (see Table 1 for ingredients) per day, in two doses, and were instructed to take the capsules with food and plenty of water to reduce the potential of gastrointestinal upset and headaches. The dose was increased to eight capsules per day, in two doses, from day 4 onward. At the week 4 assessment, depending upon response, participants increased their dosage to a personalized therapeutic dose, with a maximum of 15 capsules/day, divided into three doses of five capsules, and stayed on this dose for the remainder of the On phases of the trial. Dosage could be reduced at any time for adverse side effects (two participants reduced the dose because of increased irritability). Participants identified as having trouble swallowing pills completed pill swallowing training (
All participants were monitored face-to-face at the university at screening, baseline, and every 2 weeks thereafter for the remainder of the study (6 months) by the same clinician. Telephone monitoring was used in the event that participants could not visit the university. Neither clinicians nor families were blind to the treatment. Families were given a $10.00 petrol voucher at each visit. No other incentives were provided. The EMP+ capsules were provided at no cost.
Data analysis
The primary outcome measures defined a priori were the ADHD rating scales, the CGI, and the SDQ. The data were analyzed using a three way combination of 1) visual analysis techniques of individual participant change in the form of modified Brinley Plots (Jacobson and Truax 1991; Rucklidge and Blampied 2011); 2) group mean analyses endorsed by the new statistics approach (Cumming 2012; Kline 2013), including 95% confidence intervals (CI) and effect sizes (ES); and 3) conventional null hypothesis repeated-measures t tests.
Visual analysis was based on modified Brinley plots (Jacobson and Truax 1991; Rucklidge and Blampied 2011). These plots (Fig. 2) are used to display individual change over time in order to identify systematic effects of an intervention. Each individual's data are displayed as a coordinate pair on a scatter plot, with time 1 (baseline/pretreatment) scores normally plotted on the X axis and time 2 (later times, typically posttreatment) scores on the Y axis. Using orthogonal X-Y coordinates with the same origin and scale, the data points will lie on or near the 45 degree diagonal line of no change (X = Y) if there are no systematic differences between the two conditions. However, if there are systematic differences between the two times/conditions, the data points for some or all participants will deviate from the line (either above or below). When a higher score indicates greater impairment, points that fall above the central diagonal line indicate greater impairment and those below the line indicate less impairment (Fig. 2a). When a higher score indicates better functioning, the reverse holds true (Fig. 2b). Interpretation is assisted by displaying an arrow to indicate the direction of desired change, and by showing clinical cutoffs if they exist for the particular measure. As Figure 2 shows, the zones on the graph created by the intersections of the cutoff lines and the diagonal line of no change can be directly interpreted in clinical terms. Of particular importance is the display of those participants who have made the transition from the clinical to the nonclinical sector of the graph, although noting those who deteriorate may also be important.
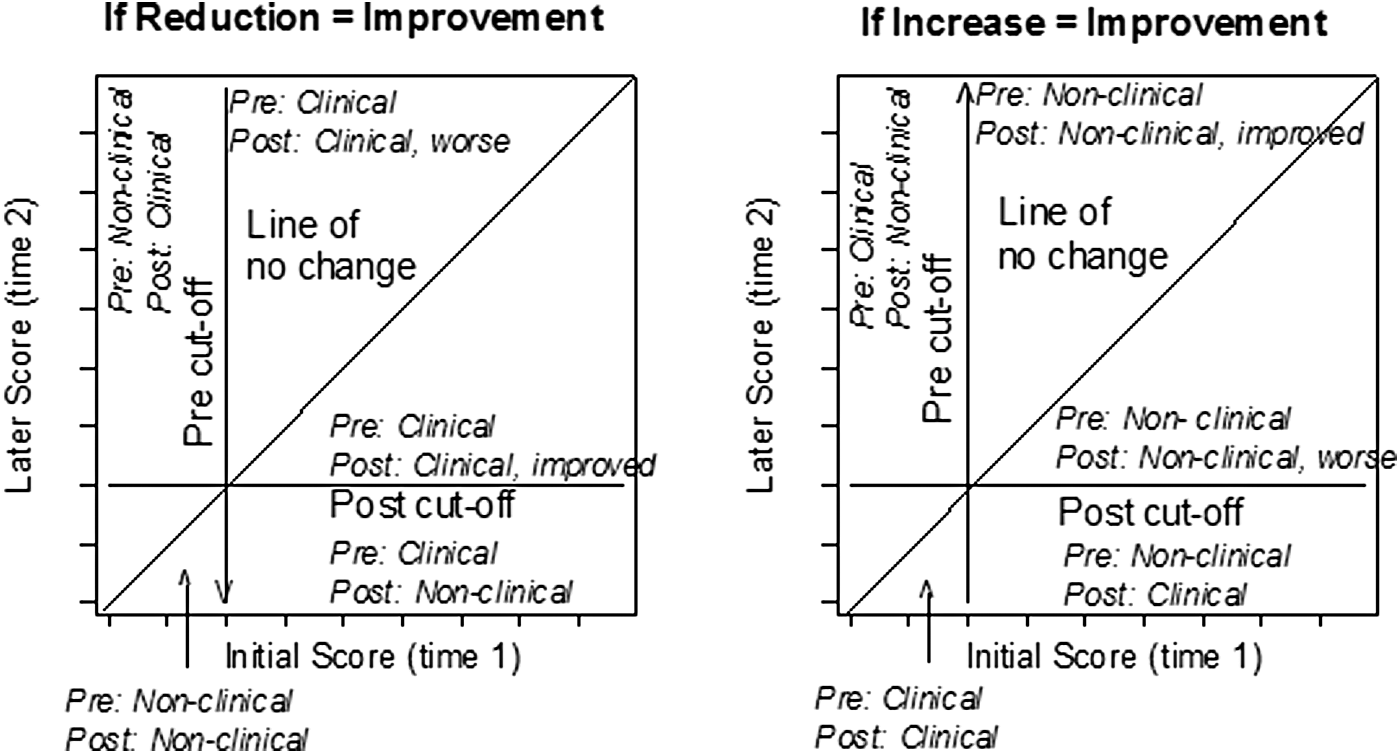
Interpretation of the graph zones in modified Brinley plots when reduction (left-hand graph) or increase (right-hand graph) in score represents clinical improvement.
Each participant's change from baseline to a second time/condition was classified using the RCI (Jacobson and Truax 1991). The RCI is based on the SEM for each measure, and indicates how much change is required for a change score to lie outside the range expected because of measurement error alone. Following Jacobson and Truax, we set the standardised RCI at ≥1.96; therefore, any individual whose standardized change score exceeds this value may be regarded as showing reliable change (p < 0.05). On the modified Brinley plots, the upper and lower bounds of the raw RCI are shown as a line parallel to the no-change line. Individuals whose data points lie within these boundaries have not shown reliable change. The percent of participants whose change is reliable in a clinically positive direction is shown as RC+ percentage.
Further, the phase mean values and 95% CI for the means are displayed as crosses on the graph, with the center of the cross at the coordinates of the X and Y means and the length of each line of the cross indicating ±95% CI of the relevant mean. The location of the means and the lengths of the CIs can be usefully interpreted, taking the extreme end of the CI as the location of the mean under the best- or worst-case scenario (Kline 2013). Therefore, if a limb of the CI line does not cross the central diagonal, we can have considerable confidence (i.e., p < 0.05) that the associated mean is different from what it would have been if there had been no change from time 1/condition 1 to time 2/condition 2. Similarly, if the CI does not cross the adjacent clinical cutoff line, we can have considerable confidence that the mean is different from the value represented by the cutoff.
In addition to RC+%, two other ES measures were computed: The standardized mean difference, Cohen's dav , and the Probability of Superiority (PS) also known as the Common Language ES (McGraw and Wong 1992). Cohen's dav expresses the mean difference between any two conditions (normally baseline vs. a treatment condition) standardized by the mean standard deviation (Lakens 2013). Positive values of d reported subsequently indicate change in a clinically desirable direction. The PS (reported as a percentage) represents the probability that, at time 2, individuals' scores are clinically superior to time 1 ( McGraw and Wong 1992; Lakens 2013). Cohen's dav is reported for each phase (relative to baseline) for each measure in Figures 3 and 4, and PS (calculated using Lakens, 2013 software) is reported for the treatment conditions alone in Figure 3, which shows the primary outcome measure (CPRS-R:L). Confidence intervals about dav (calculated using (Cumming 2011) were used to classify dav as statistically significantly different from zero (p < 0.05) and this is indicated by an asterisk in Figures 3 and 4.

Modified Brinley plots displaying change on parent-rated attention-deficit/hyperactivity disorder (ADHD) outcome measure, CPRS-R:L, Arrows indicate direction of desired change. CPRS-R:L, Conners' Parent Rating Scale-Revised: Long Form; RC+, reliable positive change; PS, probability of superiority; d, Cohen's d effect size.
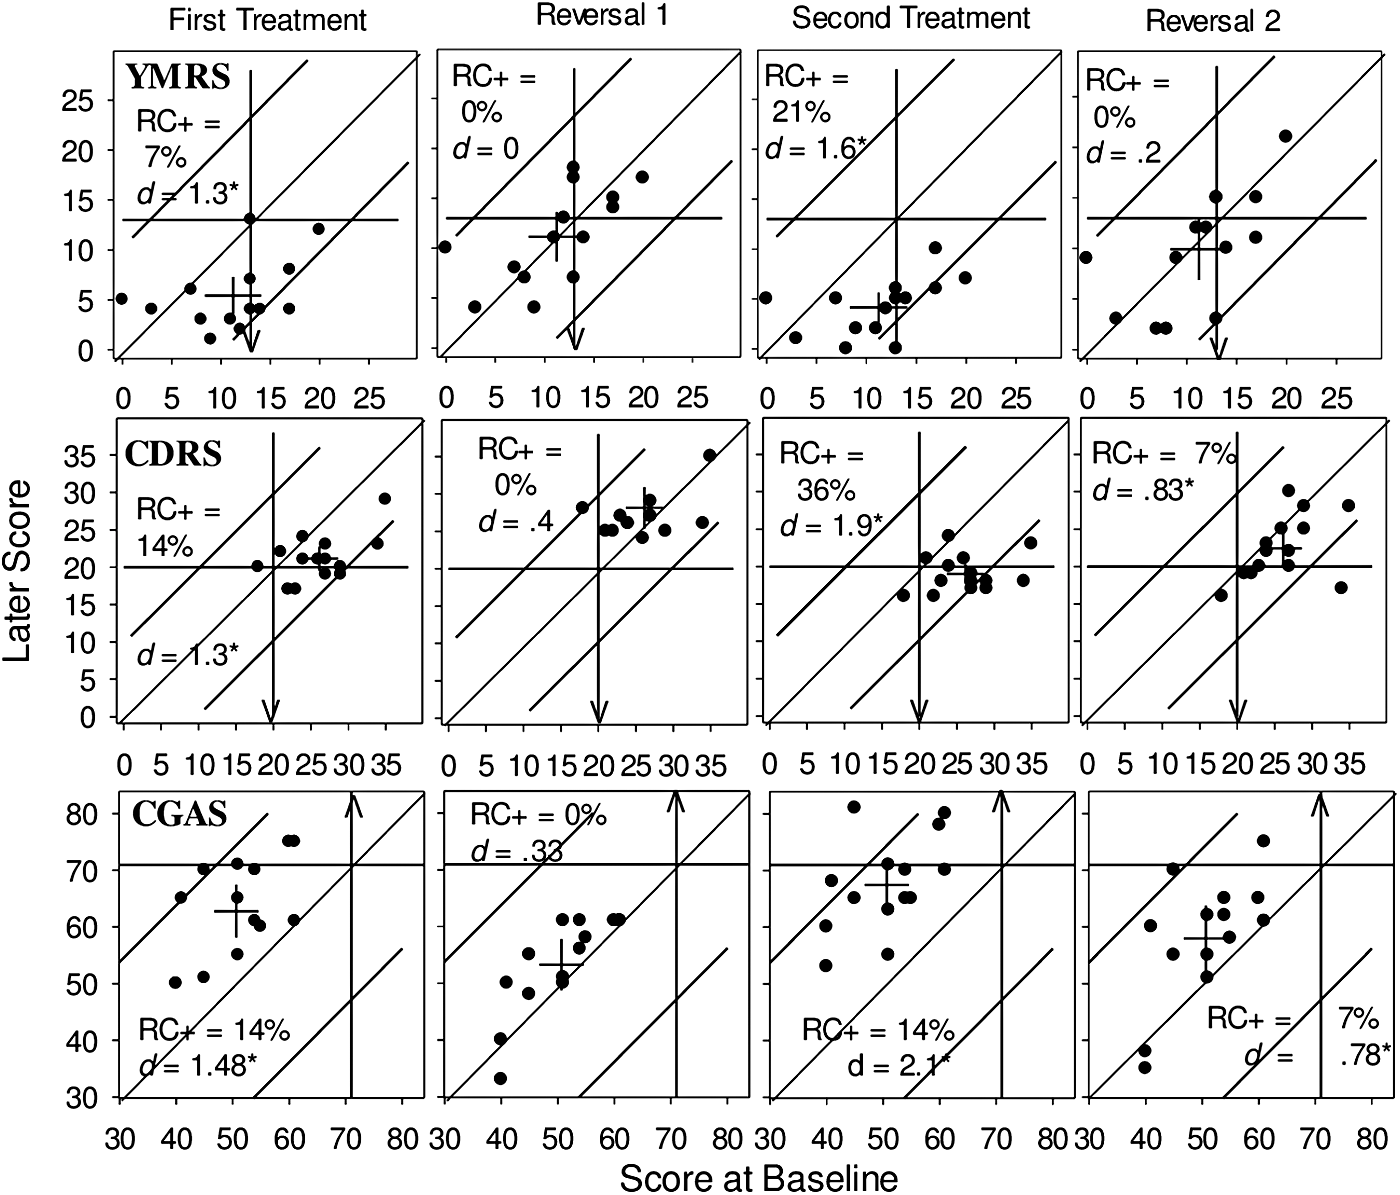
Modified Brinley plots displaying change in clinician-rated CDRS, YMRS, and CGAS scores. Arrows indicate direction of desired change. CDRS, Children's Depression Rating Scale; YMRS, Young Mania Rating Scale; CGAS, Children's Global Assessment Scale; RC+, reliable positive change, d, Cohen's d effect size.
Where paired sample t tests were used to compare group means, α was adjusted to p < 0.01 using the Bonferroni correction to reduce the risk of type I error (Kline 2013).
Results
Demographic characteristics, as well as current and past psychiatric diagnoses for the group, are presented in Table 2. The high male-to-female ratio reflects the preponderance of males diagnosed with ADHD in the general population. Fifty-seven percent of participants reported experiencing at least one additional concurrent psychiatric disorder, 10 (71%) reported having experienced at least one additional psychiatric disorder in the past, and 9 (64%) had trialled psychiatric medication prior to beginning this study; all findings consistent with the ADHD literature.
Dollars are in NZ dollars, 1 NZ = 0.7 US$, the poverty line would roughly be < $40,000.
Estimated household socioeconomic status (SES) was calculated as the mean household score on the New Zealand Socioeconomic Index of Occupational Status (scores range from 10 to 90; the higher the score the higher the SES).
Primary outcome measures
In a single-case reversal design, the inference that a treatment has caused a change in a dependent variable requires two things. First, a change must be observed relative to baseline during the first treatment phase, and ideally, to a clinically substantive degree. When the treatment is withdrawn in the first reversal phase, this change should reduce toward baseline levels. Second, this pattern of change must be replicated in the second treatment and subsequent second reversal phase. The degree to which other participants exposed to the same sequence of treatment and reversal phases replicate this pattern provides additional support for the inference.
The pattern of change over phases for each participant for the three key scales of the CPRS is shown in Figure 3 (with subsequent phases plotted relative to initial baseline), whereas Table 3 reports a group-level summary. At baseline, all participants scored above the clinical cutoff score (65) for Inattention and Total symptoms, and all but two scored above the cutoff for Hyperactivity/Impulsivity. At the end of the first treatment phase, a large majority had improved their symptom scores on each subscale as shown by the PS and RC+ percentages, and the ES were all large and statistically significant (Fig. 3 and Table 3). Figure 3 shows that nine, five, and six participants, respectively, had moved from clinical to non-clinical levels of Inattention, Hyperactivity/Impulsivity, and Total symptoms following the first treatment. These clinically positive changes all clearly reversed in the first reversal phase (Off 1), where none of the ES were statistically significant and the phase means were all in the clinical range.
CPRS-R:L, Conners' Parent Rating Scale-Revised: Long Form (means expressed as T scores).
For 5 of the total 56 switches, data for the CPRS-R was replaced by the ADHD Rating Scale-IV.
Mean difference (MD) compared with baseline.
MD 95% CI, 95% confidence interval of the mean difference.
ES = Cohen's d effect size = Mean baseline phase – Mean later phase/average SD.
ES 95% CI = 95% confidence interval of the Cohen's d.
p < 0.01; *** p < 0.001.
The positive effects of treatment were clearly replicated in the second treatment phase (On 2) and the number of participants in the nonclinical range increased from On 1 to On 2 by one for both Hyperactivity/Impulsivity and Total symptoms. In the second reversal (Off 2), the majority of participants returned to clinical levels of symptoms, with a group mean in the clinical range. However, this phase produced a more variable pattern of response than the first, as the ES remains large and statistically significant for both the Inattention and Total ADHD subscales. Also, for both the Inattention and Total Scores, there were no participants who showed reliable deterioration in any phase of the study.
Although the location of each individual's data points are fixed on the X axis across phases for each measure, the nature of the plots in Figure 3 make it somewhat difficult to track individuals' trajectories of change over phases and thus judge the extent of within-participant replication of any treatment effects. The extent to which the direction of change in treatment was consistently replicated can, however, be estimated. Given 14 participants reporting three measures over two treatment phases, there are 84 opportunities to observe whether change is therapeutically positive, or negative, or neutral (no change). For the data shown in Figure 3, the direction of change was therapeutically positive in 83 out of 84 instances (99%), thus indicating a highly consistent replication of positive effects during treatment. However, not all these changes were either reliable or clinically significant, in part because of measurement characteristics. Overall, the pattern of individual and group change across the phases, and its replication across participants, strongly supports the inference that the treatment was producing clinically and statistically significant reductions in ADHD symptoms.
This conclusion is supported by the CGI ratings. Clinician-rated severity of illness (CGI-S) decreased, with nearly 30% of the participants classified in the “normal” or “mildly ill” categories by the end of the second treatment phase (On 2). In addition, whereas 50% of the participants had been rated as “markedly ill” at baseline, none were in that category at the end of the trial. Comparing baseline severity to postintervention severity, a large, clinically significant treatment effect, d = 2.34 (95% CI [1.02, 2.82], t(13) = 7.23, p < 0.001), was recorded. As rated by the CGI-I, the overall clinical impression ratings (whereby improvement was rated based on improvement across not only ADHD symptoms but across mood and anxiety ratings as well) showed that 79% were identified as either “much improved” or “very much improved” at the end of the second treatment, and <10% of participants showed no change. No participant's symptoms worsened during the trial.
Figure 5 shows the time-series graphs for each participant over the entire course of the trial illustrating the gradual change over time when on the nutrients, as well as illustrating the reversal when off. Figure 5 shows a gradual decrease in ADHD symptoms during the first on phase (On 1), with all of the participants falling below their baseline score by the end of the first treatment phase. For some participants, the reintroduction of treatment resulted in immediate reduction of symptoms (i.e. 1, 11, 13, and 14); for others, the effect was more gradual (i.e. 4, 5, and 12). Figure 5 shows the return of ADHD symptoms when treatment was withdrawn. A similar pattern was found in the second off phase (Off 2) with a gradual return of ADHD symptoms for some and an immediate return of symptoms for others. Participants 3, 9, 10, and 13 chose to reintroduce the micronutrient formula early because of the return of ADHD symptoms.
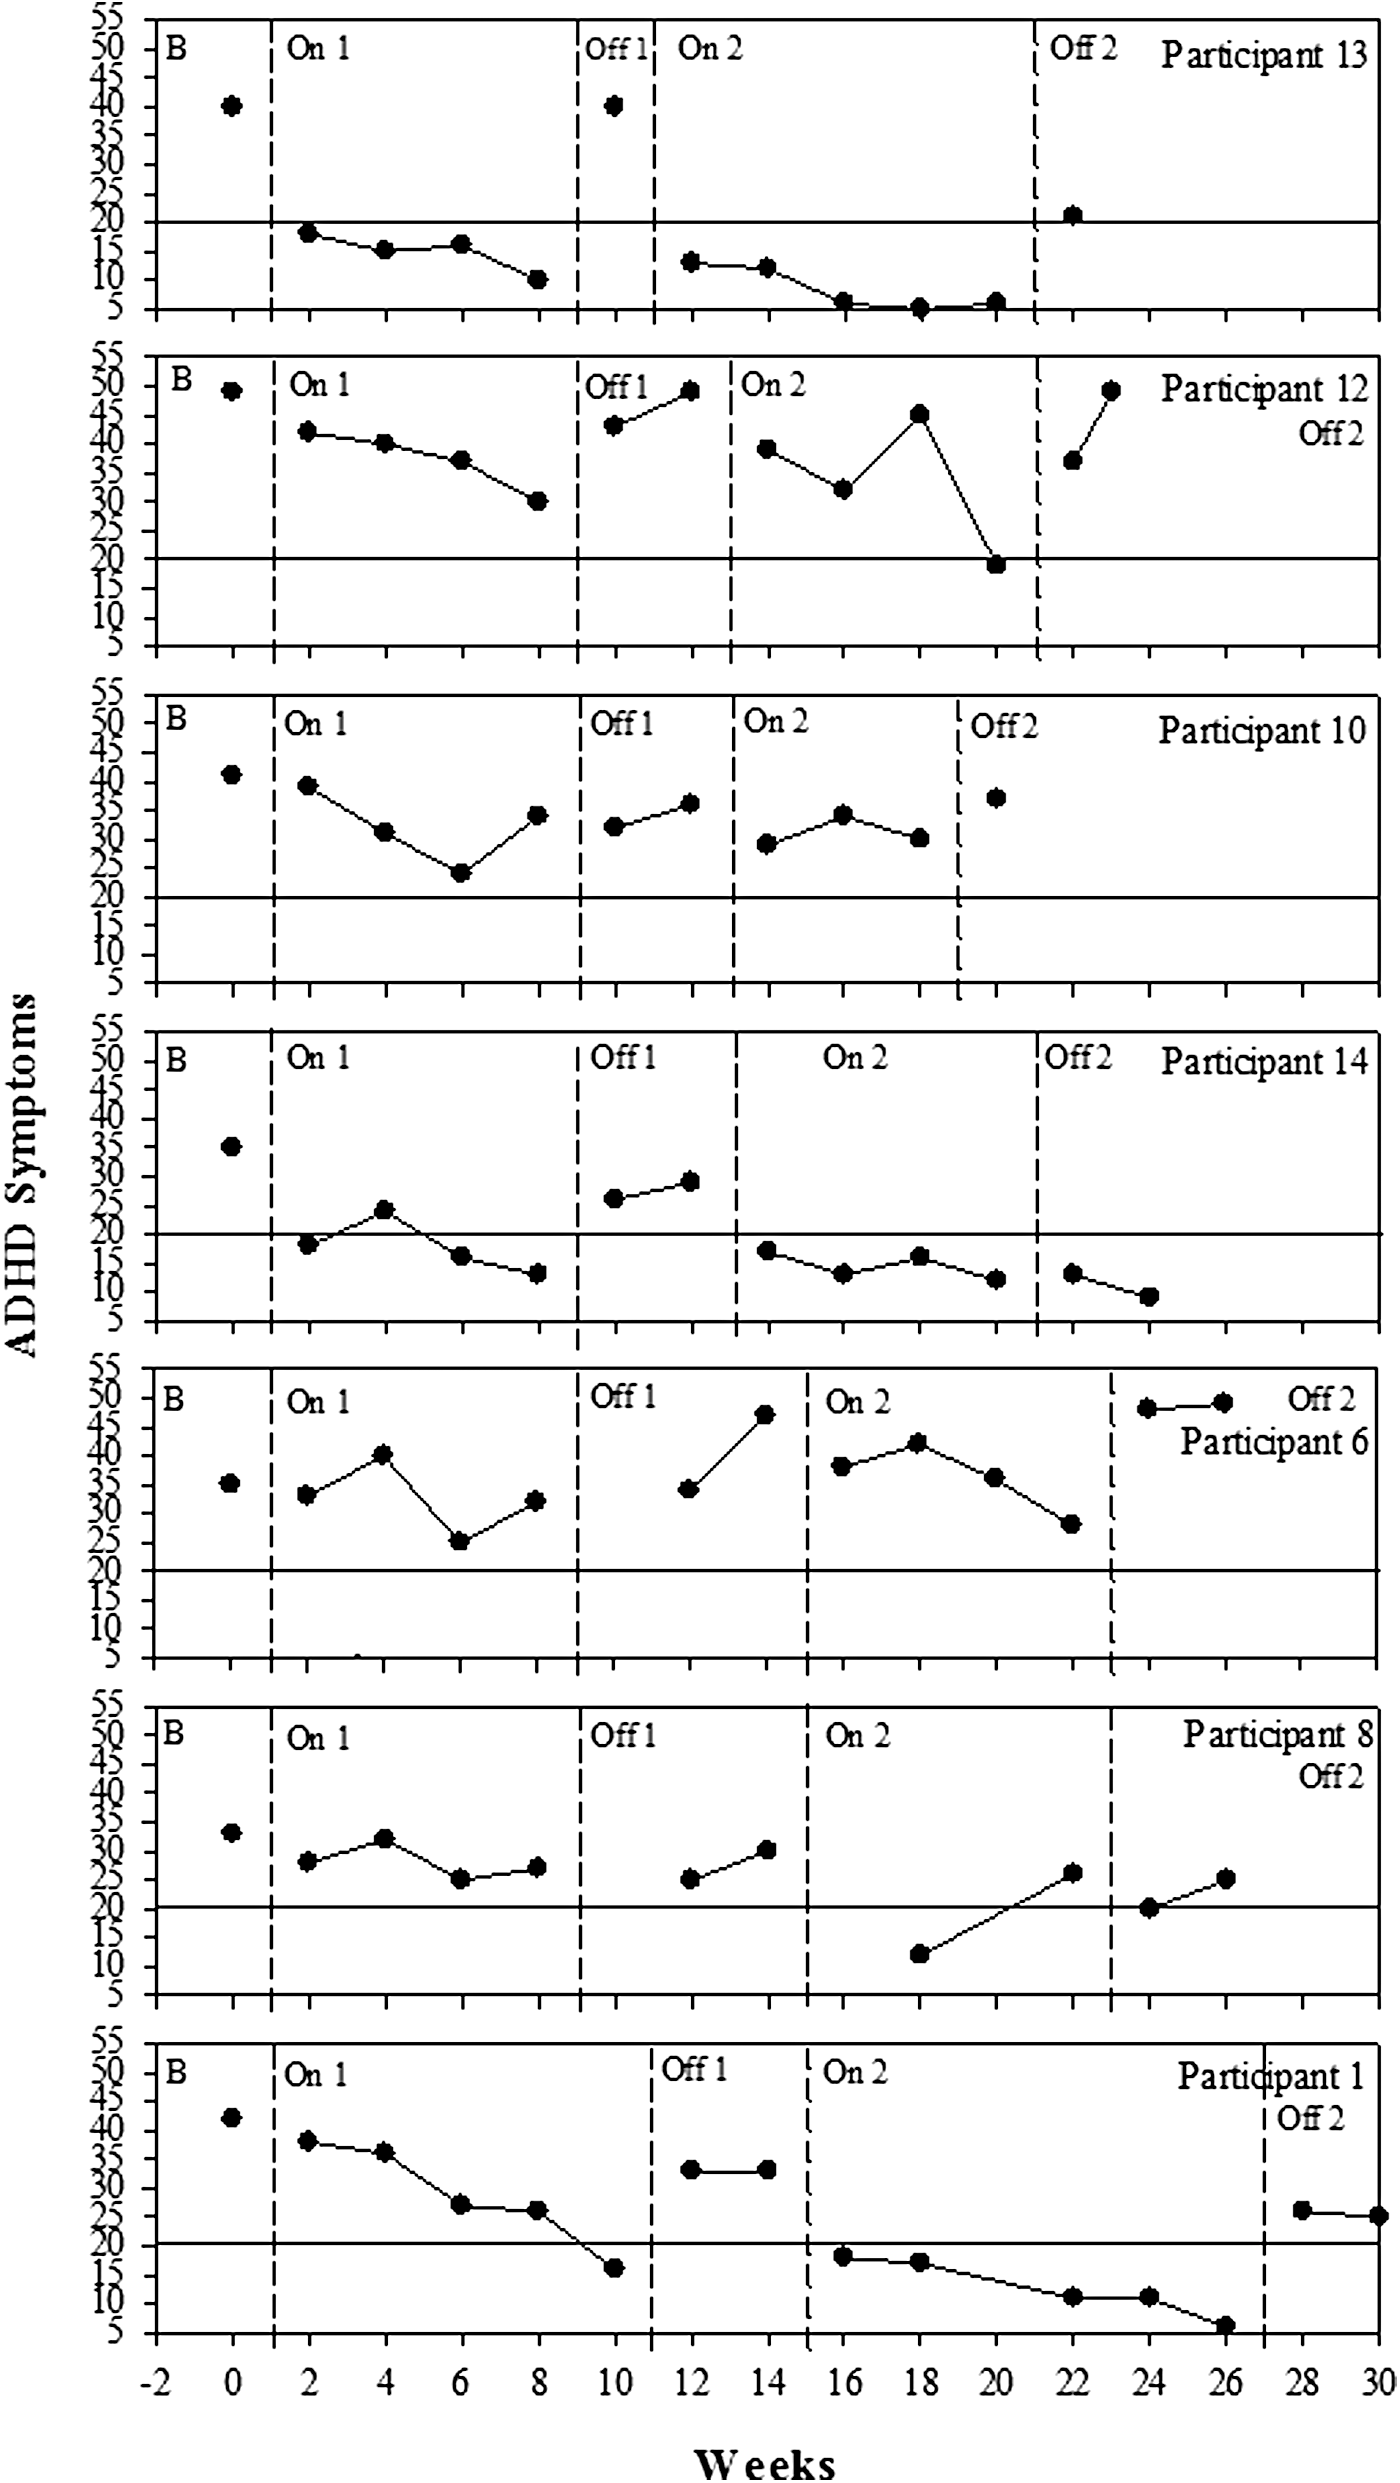
Changes in attention-deficit/hyperactivity disorder (ADHD) symptoms over time for each participant as measured by the ADHD Rating Scale (ADHD-RS) and the Conners' Parent Rating Scale-Revised: Long Form (CPRS-R:L). Dashed lines indicate different phases of the study, B, baseline, On 1, first phase on micronutrients; Off 1, first phase off micronutrients; On 2, second phase on micronutrients; Off 2, final phase off micronutrients; scores above solid line at 20 indicate the clinical cutoff for symptoms.
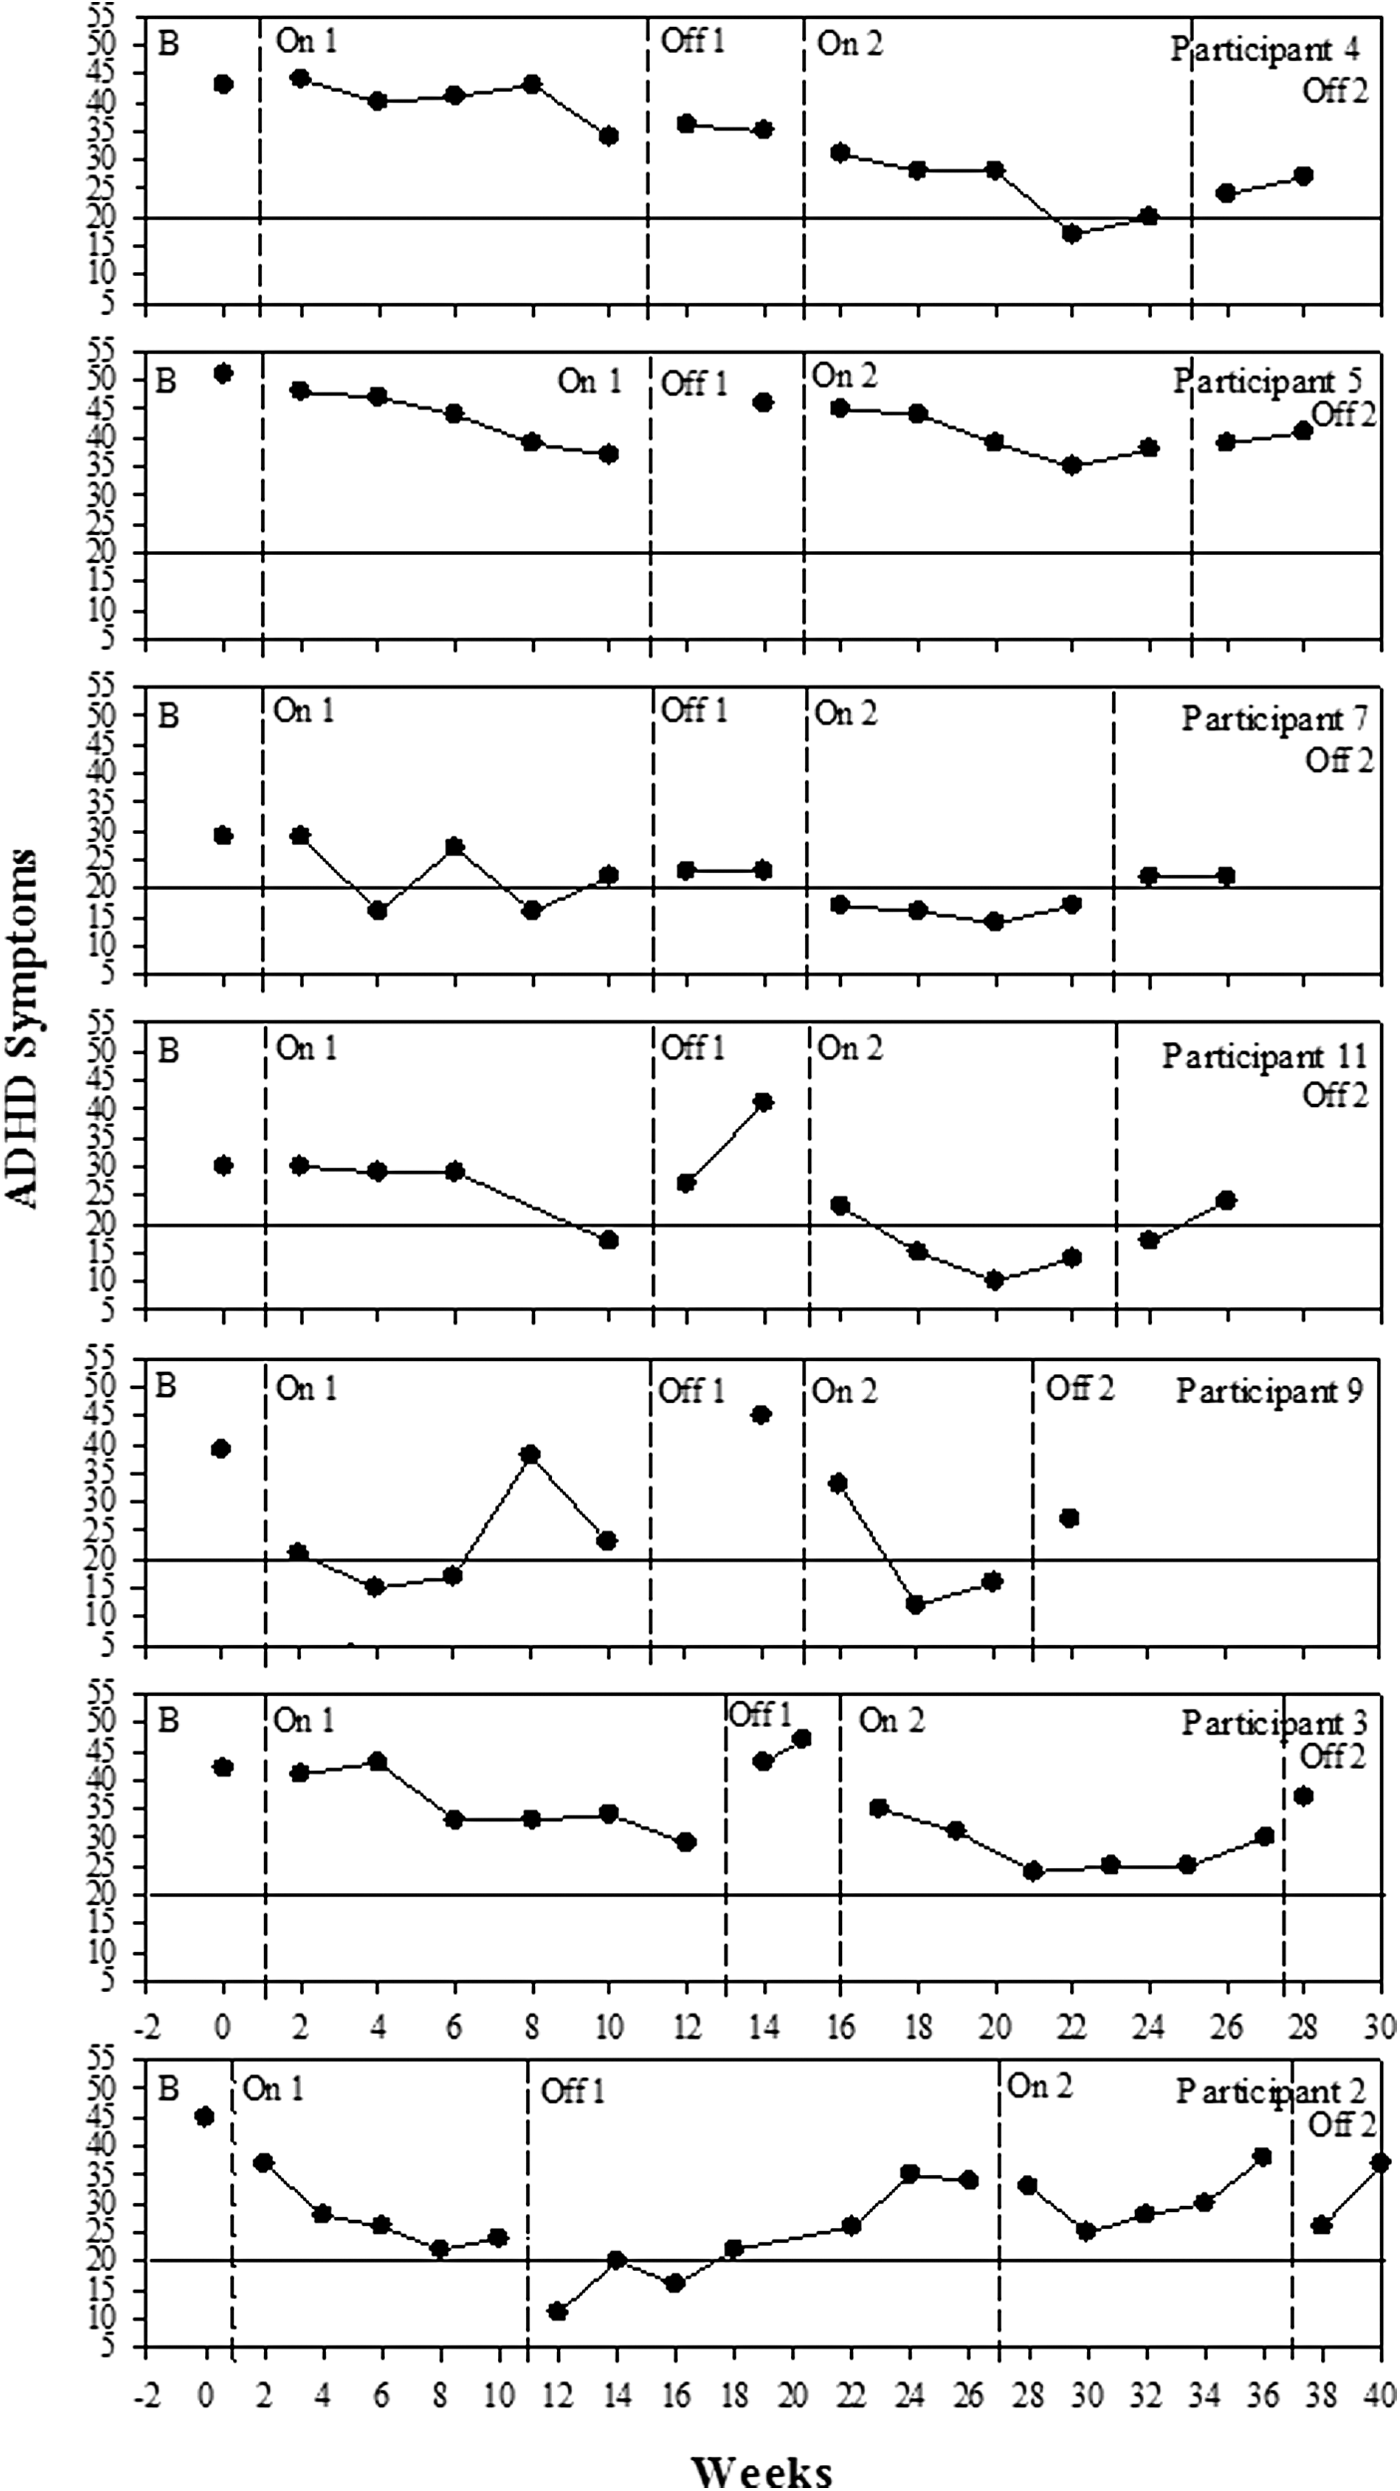
Table 4 shows group-level outcomes on the SDQ, comparing baseline to the second treatment phase (On 2). Large treatment effects were observed for four of the SDQ subscales: Total Difficulties, Conduct Problems, and Hyperactivity, and the Impact Score, and there was a small but statistically significant increase in Prosocial Behavior. These domains are all highly relevant to ADHD symptomology, and further confirm clinically meaningful change following micronutrient treatment.
SDQ = Strength and Difficulties Questionnaire, which consists of five subscales: Emotional Symptoms Scale, Conduct Problems Scale, Hyperactivity Scale, Peer Problems Scale and Prosocial Scale. The Total Difficulties score is generated by summing the scores from all of the scales except the prosocial scale. For all the subscales except for Prosocial Behavior, a decrease in scores is indicative of improvement in behavior/symptoms; as such, all changes are in the desired direction.
SEM = standard error of the mean; MD = mean difference of On 2 compared with baseline; MD 95% CI = 95% confidence interval of the mean difference; ES = Cohen's d (as for Table 3); ES 95% CI = 95% confidence interval of the Cohen's d.
Statistically significant difference at p < 0.05 level.
Statistically significant difference at p < 0.01 level.
Secondary outcome measures
Patterns of change over the five phases of the study are shown for the YMRS, the CDRS, and the CGAS in Figure 4. As the SEM was relatively large for these three measures, the upper and lower boundaries of reliable change are quite wide and, therefore, only a minority of participants showed reliable change on these measures in the treatment phases. The failure to observe many instances of reliable change must temper, but not negate, the interpretation of change observed for the secondary measures; however, the consistency of the direction of change is important. At baseline, the YMRS scores of seven participants placed them above the clinical cutoff for at least minimal severity (≥13) (Fig. 4, top row). During the first treatment phase (On 1), 10 participants reduced their symptoms and the ES is large (and significant), but only 1 participant changed to a reliable extent. These changes clearly reversed during the first reversal (Off 1). Greater therapeutic change was evident in the second treatment phase (On 2), with an even larger ES and more participants showing reliable change. Again, these changes largely reversed in the final reversal (Off 2).
CDRS depression scores (Fig. 4, middle row) at baseline placed all but one participant above the clinical cutoff (≥20) and two participants' scores indicated significant depression (≥30). The majority of these individuals changed in a therapeutic direction during the first treatment phase (On 1) and the ES was large and statistically significant; however, only a few participants changed to a reliable degree. These changes all reversed substantially during the first reversal (Off 1). This pattern was repeated in the second treatment and reversal phases (On 2 and Off 2), with a larger treatment effect and more than one third of participants showing reliable change during the second treatment (On 2).
This pattern of clinically and statistically significant improvement, as measured by the ES, during treatment phases, is replicated for the CGAS (Fig. 4, bottom row). However, again because of the large SEM for this measure, only a minority of participants showed reliable change sufficient to move them into the normal range on this measure. As was the case for the CDRS, but not for the YMRS, the ES remained large (>0.8) and statistically significant during the final reversal (Off 2), although it was smaller than during the second treatment phase (On 2). There is evidence of persistent treatment benefit during the final reversal phase (Off 2) for all measures shown in Figures 3 and 4, except for Hyperactivity/Impulsivity, and the YMRS. Of the 84 opportunities to observe change on these measures, 74 (88%) were in a therapeutically positive direction.
In Table 5, Baseline is compared with the second on phase (On 2) and shows that the children's reports were consistent with those of parents and clinicians on the MYMOP across ADHD behaviors, mood, and sleep. They show medium to large effects of the intervention and significant improvements on each measure. The children's perspectives supported the parents' and clinicians' reports of clinically meaningful change from baseline to the end of the second on phase (On 2).
MYMOP = Measure Yourself Medical Outcome Profile, a self-report measure adapted to monitor the participants' hyperactivity, impulsivity, inattention, sleep. and mood. A score of 0 indicates no problems and a score of 4 indicates major difficulty.
SEM = standard error of the mean; MD = mean difference of On 2 compared with baseline; MD 95% CI = 95% confidence interval of the mean difference; ES = Cohen's d; ES 95% CI = 95% confidence interval of the Cohen's d.
Statistically significant difference at p < 0.05 level.
Statistically significant difference at p < 0.01 level.
Safety and dose adherence
Reported side effect events were generally rated as mild to moderate in intensity, and were typically remedied by ensuring that EMP+ was taken along with appropriate amounts of food and water (see Table 6). Eleven (79%) participants reported stomachaches as an adverse event, most commonly at the beginning of the treatment phases, and generally only once. One participant reported some agitation that reduced with a reduction in dose. Two of the 14 participants experienced nausea/vomiting related to EMP+ consumption. One participant experienced this on one occasion only and no further action was needed; the other eliminated the problem by splitting the morning dose between breakfast and a midmorning snack. Approximately half of the sample reported a skin rash at some point during the intervention. In all cases, the rashes were reported on only one visit and were gone at the next visit. We did not observe the rashes, as they had cleared up by the time the participants reported them to us. None required treatment. One child reported achy joints, which the parent attributed to growing pains. Like the rashes, this symptom was transient and stopped without any need for intervention.
One absence seizure was reported at the end of the on phase (week 8) in one participant. He did not have a history of seizures, and further investigations were unable to determine whether the child had experienced a seizure or whether the teacher who had observed it misinterpreted extended inattention as a seizure. No other seizures were reported throughout the rest of the trial. As a consequence, the child's physician did not believe that the intake of nutrients was related to the reported event.
Adherence was defined as ingesting a minimum 80% of the designated doses throughout the trial. Seven of the 14 participants (50%) took the recommended maximum dose (15 pills/day), two took 11–13 pills/day, and five participants took 8–10 pills/day, and all were judged adherent to their prescribed consumption regime.
Analyses of blood collected at baseline and posttreatment are presented in Table 7. Consistent with previous research (Simpson et al. 2011; Rucklidge et al. 2014a), the current study did not identify any significant adverse events or safety concerns. There were significant changes over time in group mean differences in aspartate aminotransferase (AST), alanine aminotransferase (ALT), thyroid stimulating hormone (TSH), and nutrient levels of zinc from baseline to post-trial; however, none fell outside the normal reference ranges.
Based on 13 participants as 1 refused to do the second blood test.
ES = effect size, Cohen's d.
p < 0.05; ** p < 0.01.
APT, activated partial thromboplastin,;WBC, white blood cells; GGT, gamma-glutamyl transpeptidase; AST, aspartate aminotransferase; ALT, alanine aminotransferase; HDL, high-density lipoprotein; TSH, hyroid-stimulating hormone.
Discussion
The current study makes an important contribution to the sparse literature investigating nutritional supplements, specifically micronutrients, as a treatment for children with ADHD. It presents results from a five phase reversal design, with replication over 14 cases. The number of treatment phases and replications is substantially in excess of the minimum design standards specified in Kratochwill et al. (2013), and this research design is recognized as appropriate for establishing treatment efficacy (Chambless and Hollon 1998). While taking micronutrients, the great majority of participants experienced clinically significant reductions in ADHD symptoms, improvements in mood, and increases in overall functioning that were reversed when the treatment was withdrawn. Benefit was observed across all three sources of information: parents, clinicians, and the children themselves.
The results are consistent with research using EMP+ for adults with ADHD (Rucklidge et al. 2014a), as well as research on children with other psychiatric diagnoses, including bipolar disorder and autism (Frazier et al. 2009; Mehl-Madrona et al. 2010; Frazier et al. 2012). These positive results were clearly evident in visual analysis, quantified by positive effect sizes including Cohen's d, the percent showing reliable positive change (RC+), and the PS, and confirmed by mean differences, 95% CIs about the means, and t tests. Benefits were achieved with minimal and transitory side effects, excellent adherence, and no study dropouts. Further, the sample was reflective of children typically seen in clinical practice with a high rate of co-occurring diagnoses (57%) and previous unsuccessful treatment with medications. The participants came from families of diverse SES, enhancing the potential generalizalitity of the results. Ten participants (71%) were observed to have at least a 30% decrease in combined ADHD symptoms at the end of the second on phase (On 2) when compared with baseline functioning, and 79% were identified as “much improved,” or “very much improved” by CGI-I (reflecting on the global change as a whole across all psychiatric symptoms they presented with). Typically, a clinical response to an intervention has been defined as a 30% decline in ADHD symptoms from baseline and/or a CGI-I rating of 1 (very much improved) or 2 (much improved) at the intervention end-point (Steele 2006; Spencer et al. 2001). Importantly, the children themselves agreed with their parents and clinicians that their symptoms had improved. The observed changes in global functioning suggest that the micronutrient treatment not only reduces ADHD symptom severity, but also benefits multiple areas of psychological functioning.
Because of the greater power of within-subject designs (Lakens 2013), effect sizes such as Cohen's d are typically somewhat larger in such studies than in between-subject designs. Nevertheless, even allowing for this, the effect sizes observed in the current study are large (or very large), with a strong trend for them to be larger in the second treatment phase than in the first. They are also substantially larger than those typically reported for placebo effects (Grissom 1996) and at least comparable to the most recent meta-analyses examining the effects of stimulant medication on ADHD, which found medium to large effect sizes (Faraone 2009; Faraone and Buitelaar 2010).There was consistency with which positive effects of micronutrients were replicated across participants, treatment phases, and measures. Putting these indices in context is difficult, because conventional between-groups research rarely considers the consistency of response to treatment, and the use of PS as an effect size is equally rare (Zahra and Hedge 2010); nevertheless, it is reasonable to consider the consistency of replication found in this study to be large to very large. The difficulty in observing reliable change, especially for the secondary measures, was largely because of those measures having considerable measurement error, which points to the need to select outcome measures that have a small SEM to facilitate the detection of reliable change.
It is also important to highlight that participants improved relative to baseline in all the subsequent phases of the study, even when off the micronutrients. Small to large effect sizes were found when off phases were compared with baseline, on both parent- and clinician-rated measures, suggesting that there was still a positive effect on symptoms during the withdrawal phases compared with baseline. This was particularly marked for the second reversal phase, which came after a treatment phase when the micronutrients were taken throughout the phase at maximum dose. One possible reason for the positive effects found during withdrawal phases, especially the second, is that participants may have experienced residual effects of the micronutrients, with dissipation rates of the formula differing among participants. In addition, the withdrawal phases were shorter than the micronutrient treatment phases; therefore, the opportunity to observe a full elimination of any residual effect of the micronutrients may not have occurred. Notably, the shorter withdrawal period was based on caregiver and participant requests to resume taking the micronutrients earlier than planned, because of the return of symptoms. Also, the regular consultation with the researchers may have given the participants, and their parents/caregivers, a chance to discuss what had been happening in recent weeks. Although no additional therapy was intended, the regular contact may have resulted in a focus on both desirable and undesirable behaviors that may have otherwise gone unnoticed and, therefore, facilitated change. Another possible factor that may have resulted in improved functioning during off phases compared with baseline was that during the on phases, participants' eating habits may have altered (although we did not directly measure dietary intake) because of the requirement to consume plenty of food and water with the micronutrients. The potential increased intake of food and water at three meal times may have increased the participants' overall functioning, even during the off phases. Regression to the mean may also have contributed to change, but is unlikely to have produced effects as large as observed here.
The benefit observed across a wide range of symptoms may seem surprising, but is consistent with the hypothesized mechanism of action of broad-spectrum micronutrients (Kaplan et al. 2015). These formulations may correct inborn errors of metabolism (Kaplan et al. 2007), correct mitochondrial dysfunction by increasing the nutrient intake to levels required for optimal functioning (Gardner and Boles 2005), reduce oxidative stress, and improve the absorption of vitamins and minerals through promoting healthy gastrointestinal functioning (Jackson et al. 2012; Kaplan et al. 2015). The results are also consistent with the growing body of literature identifying poor nutrition, Western diet, and food additives as possible etiological factors in the expression of psychiatric symptoms in children (Howard et al. 2011; Pelsser et al. 2011; Arnold et al. 2012; Galler et al. 2012; O'Neil et al. 2014; Sarris et al. 2015).
Limitations
Teacher data were collected on both the Conners' Teacher Rating Scales and the SDQ; however, a large amount of data was missing because of phase changes falling during school holidays, and other timing factors. Consequently, these data could not be reliably interpreted. Future research would benefit from independent teacher observations, preferably blinded. It is also possible that ratings were affected by school holidays, parents often commenting that their child's behavior tended to get worse during these vacation periods.
Another limitation is the open-label nature of the design, in which participants, caregivers, and clinicians knew when they were taking and not taking the micronutrients. This means the positive responses given may have been influenced by expectancy effects. Although the contribution of a placebo response to the observed results cannot be estimated, there are convincing reasons why a placebo effect is unlikely to explain the entire therapeutic results found. For example, for most participants, the therapeutic effect was gradual, with the most benefit shown several weeks after starting the micronutrients. Placebo/expectancy effects would likely have been observed relatively immediately, and as noted, the magnitude of the treatment effects observed was much larger than those typical of a placebo response. Additionally, 64% of the participants had trialled at least one psychiatric medication prior to starting the study and had not experienced significant positive changes, or had been unwilling to continue the medication because of undesirable side effects.
Conclusions
In terms of future directions, independent and systematic replications, preferably under double-blind conditions and with a placebo control, are required to establish the reliability and the generality of treatment effects. In addition, trialling different micronutrient formulations, in a variety of treatment settings, and across the full range of manifestations of ADHD across the life span and alongside other related disorders (Chambless and Hollon 1998; Blampied 2013; Dallery et al. 2013) are important future directions. Clinical replication will be required to establish the generality of micronutrient treatment in combination with other treatments, such as behavioral or cognitive-behavioral therapies, for the full range of ADHD presentations across the life span. Given that the present study sample was primarily boys, ensuring gender balance in subsequent trials is important in order to understand the response of girls to micronutrients. Further, although the sample recruited likely represents the typical clinical presentations of ADHD in that over half of the children had a comorbid diagnosis, it means that we are unsure whether children with only ADHD and no other comorbid disorders would benefit. It may be that the nutrients assist with regulating mood symptoms and, in turn, that ADHD symptoms improve as a result. Further studies with a variety of clinical presentations would assist in determining who might benefit from the treatment. It is of note, however, that results from the randomized controlled trial (RCT) conducted with adults with ADHD indicated that comorbidity was not moderating treatment response (Rucklidge et al. 2014b).
Additional research investigating multi-ingredient micronutrient formulas should explore long-term outcomes, particularly on brain development; however, preliminary results support positive long-term outcomes with micronutrients (Simpson et al. 2011; Popper 2014). Future research investigating long-term adherence will also be of benefit. For some, the large number of capsules required to be consumed daily can act as a barrier to adoption and maintenance of the treatment. The possibility that the dose regime might be reduced to some maintenance level once sustained reduction in symptoms has been achieved should, therefore, be investigated.
Clinical Significance
There is a growing body of well-designed studies revealing the effectiveness and efficacy of micronutrients on a variety of mental health disorders (Gesch et al. 2002; Kennedy et al. 2010; Popper 2014; Rucklidge et al. 2014a,b). The current study chose a psychiatrically complex group of participants, and evaluated a number of psychiatric symptoms within the same study to assess whether micronutrients may be a viable treatment for ADHD, a chronic and debilitating condition. The findings revealed improvements across a range of ADHD symptoms, including hyperactivity and inattention, as well as general overall functioning, with only minor, transitory adverse events. There were no reports of sleep disturbance, decreased appetite, increased irritability, or weight loss, issues that are frequently reported in medication trials (Graham and Coghill 2008). When the optimal dosage for each participant was reached, we observed a continuous control of symptoms, minimal adverse events, and high adherence rates. The current study, alongside others, supports an investment into further controlled research on the effects of broad-spectrum micronutrients in the treatment of ADHD in children.
Footnotes
Acknowledgments
We thank Dr. David Ritchie, Helios Medical Centre, for overseeing the blood testing results. We thank the Department of Psychology and the Vic Davis Memorial Trust for funding the study, and Truehope Nutritional Support Ltd., Raymond, Alberta for donating the micronutrients. We also thank Dr Brigette Gorman for assistance with data collection.
Disclosures
No competing financial interests exist.